

The impacts of climate change on population groups in Scotland
DOI: http://dx.doi.org/10.7488/era/3843
Executive summary
This research brings new insight into how climate-related hazards and their impact on people and communities vary across Scotland. The project explored which, if any, population groups are disproportionately affected by flooding, high temperature and poor air quality, how they are affected now and potential impact in the future.
Vulnerability to the impacts of climate change depends on two sets of factors:
- The likelihood that people and communities are exposed to climate-related hazards, eg where they live and the dwelling type.
- The characteristics of people and communities that make them more or less likely to experience a negative outcome if they were to be exposed to a hazard. These characteristics include eg age, health, income, property tenure and insurance cover.
To deliver a just (ie fair) approach to managing climate related risks the outcomes for the most vulnerable need to be understood and well managed. The process of identifying, and, if necessary, addressing the disproportionate risk faced by the most vulnerable is therefore a central component of a just approach to climate adaptation.
Main findings
- Low income and poor health are strong drivers of social vulnerability to all three of the climate-related hazards we investigated.
- In rural areas, access to the internet and isolation heighten vulnerability.
- In urban settings, poor health, income deprivation, high levels of social and private renting, lack of local knowledge and limited mobility are all important contributors to vulnerability.
- In general, local authorities experiencing the greatest disadvantage today continue to do so in the future.
- People in rural areas are at greater risk of being adversely impacted by climate change than those living in urban areas. This is particularly the case for flooding, though population density means that a greater number of people are affected in urban areas.
- The most socially vulnerable neighbourhoods in large urban areas are three times more likely to be exposed to high temperatures than others, and 50% more likely to be exposed to poor air quality. However, if planned reductions in emissions are realised, the latter risk is projected to decrease in the future.
- Different ethnic groups experience different levels of risk:
- Black ethnic groups tend to experience higher risk today than any other ethnic group, particularly in relation to poor air quality.
- However, difference between the risks faced by the most socially vulnerable neighbourhoods and others within the same ethnic group is greatest amongst white ethnic groups.
Implications for policy
Many of the most important drivers of social vulnerability affect vulnerability to all hazards considered in this report – flooding, high temperatures and poor air quality. Recognising this presents an opportunity to enhance resilience to multiple climate hazards through targeted action and adaptation.
Climate-related disadvantage is often driven by a limited capacity to appropriately prepare for, and recover from, hazard events eg flooding or heat waves. Supporting the most socially vulnerable to make property-level adaptations, including those in rented accommodation, would reduce the negative outcomes when exposed to a hazard.
Note
The datasets and thresholds used are not representative of thresholds of health-related impacts per se but are chosen to provide a relative insight into social disadvantage across Scotland. For any individual, the relationship between climate related hazards (such as flooding, heat, and air quality) and physical and mental health is extremely complex. It is widely documented, for example, that air pollution can have a negative impact on health, with the very young, the elderly and those with pre-existing health conditions being particularly vulnerable. However, the types of illnesses that may be exacerbated by air pollution can also be affected by multiple other factors – such as obesity, alcohol consumption, smoking and genetics. The ways in which these factors interact with air quality to influence overall health are not currently well understood, and further long-term research is needed. Similar complex interactions between multiple factors exist in relation to flooding and heat. Consequently, it is not generally possible to say with any certainty the impact air pollution may have on a specific individual. These caveats should be borne in mind when considering the information contained in this report.
Glossary
The following table provides selected definitions. Definitions of metrics are given in the appropriate location in the report.
|
Term |
Definition |
|
Climate justice |
Defined here as the outcome of taking action to manage climate related risks that provide a more equitable distribution of the potential harms faced because of both inherent social vulnerability and potential for exposure to hazards. |
|
Driver (of vulnerability) |
Factors that increase the impact exposure to a hazard has on a household or an individual |
|
Exposure |
The potential to encounter a climate-related hazard (i.e., to be flooded, or experience a high temperature, or poor air quality). |
|
Geographic disadvantage |
A function of: (a) the likelihood of exposure to a hazard, and (b) individual or group social vulnerability to that hazard. This considers the spatial coincidence of the hazard, exposure and social vulnerability that can be aggregated to the spatial scale of interest. |
|
Hazard |
The occurrence of a situation with the potential to cause harm (loss of wellbeing). In the context here, the hazards considered are flooding, high temperatures and poor air quality. |
|
Indicator |
The specific variables, e.g. ‘% unemployment’, that contribute to the drivers of vulnerability, e.g. low income |
|
Just transition |
Defined here as a ‘fair’ distribution of the short and long-term costs and benefits of climate mitigation or adaptation; an outcome achieved through a process that balances principles of utility and equality with maximising the outcomes from the most socially vulnerable. |
|
Risk |
A function of the chance of an event (e.g., the hazard) and the impact that the event would cause if it occurred (taking account of the social vulnerability of those exposed). |
|
Systemic disadvantage |
The risk faced by the most socially vulnerable when compared to those less vulnerable (Sayers et al., 2016). Since this enables a comparison of the risks faced within a selected grouping (for example, those living in urban areas or from a particular ethnic group) it is referred to here as systemic disadvantage. |
|
Vulnerability (social) |
The inherent characteristics of individuals and communities in which they live that influence the potential to experience loss of wellbeing when exposed to a climate hazard. |
Introduction
Motivation
Scotland’s climate is already changing, and further change is now inevitable. However, the effects of climate change will not be felt equally by everyone. Some places in Scotland – and the people living in those places – are more likely than others to be exposed to climate-related hazards, such as floods. The impact also varies, with some people and communities more vulnerable than others to being negatively affected when exposed to a climate-related hazard.
The Scottish Government is committed to embedding the principles of climate justice and just transition within its response to climate change. The plans developed to adapt to the effects of climate change should help to address inequality and support the people who are most affected by climate change and are the least equipped to adapt to its effects. Scotland’s Climate Change Adaptation Programme 2019-2024[1] (SCCAP2) states the Scottish Government’s objective to ensure that adaptation is focused directly on empowering the people who are more vulnerable to climate change and that adaptation actions are just and put people first.
Delivering these commitments successfully will require an understanding of the impacts of climate change across different social groups in Scotland. Although some evidence already exists, a recent independent assessment of SCCAP2[2] conducted by the Climate Change Committee (CCC) included a specific recommendation to improve the knowledge base around the distributional impacts of climate change.
The research presented here responds to this recommendation by identifying those groups in Scotland most likely to be disproportionately impacted by three selected climate hazards (flooding; high temperature; and poor air quality), now and in the future.
Research questions
Given this context, the research focuses on three primary questions:
Q1. What are the drivers of social vulnerability to climate hazards across Scotland?
Q2. Which groups are at the greatest social risk from climate related hazards, now and in the future?
Q3. To what extent are the most socially vulnerable disproportionately impacted by climate-related hazards?
It is anticipated that the evidence presented in responding to these questions will be relevant to public engagement on climate change issues, and in implementing a just transition.
Report structure
The report is structured as follows:
- Chapter 2 – Assessment approach, sets out the approach to the assessment.
- Chapter 3 – Climate-related hazards – Present and future, sets out why flooding, poor air quality and the high temperatures have been selected, as well as the data sources used, and the adaptation assumptions made.
- Chapter 4 –Social vulnerability, sets out the definition of social vulnerability, the individual indicators and integrated indices of social vulnerability used and shows how they vary across Scotland. This responds to the first research question: ‘What are the drivers of social vulnerability to climate hazards across Scotland?’
- Chapter 5 – Geographic disadvantage, sets out the definition of geographic disadvantage and aggregates the risk spatially to compare the risk faced across Scotland. This responds to the second research question: ‘Which groups are at the greatest social risk from climate related hazards, now and in the future?’
- Chapter 6 – Systemic disadvantage, sets out the definition of systemic disadvantage and compares the risks face by the most socially vulnerable and the less socially vulnerable across Scotland. This responds to the third research question: ‘To what extent are the most socially vulnerable disproportionately impacted by climate-related hazards?’
- Chapter 7 – Conclusions, summarises the findings of the study.
References are provided in Chapter 8. Appendix 1 provides an extended discussion of the rationale for the selection of three hazards. Appendix 2 presents the rationale for the selected indicators of social vulnerability and sets out the approach to calculating a vulnerability index.
Assessment approach
Climate-related hazards and the impact they have on the people and communities exposed to them vary across Scotland. Delivering a just (i.e., fair) approach to managing climate related risks seeks to ensure the outcomes for the most socially vulnerable are understood and well-managed, rather than basing decisions on strict utilitarian or purely egalitarian principles (e.g., Sayers., 2017). The process of identifying, and if necessary, addressing disproportionality in the risk faced by the most socially vulnerable is therefore a central component of a just approach to climate adaptation.
The framework of assessment used to support this process considers the factors that influence social vulnerability and how these combine with exposure to three selected hazards (flooding, heat, and poor air quality) to drive geographic and systemic disadvantage (Figure 1). The rationale of the approach is discussed in more detail below.
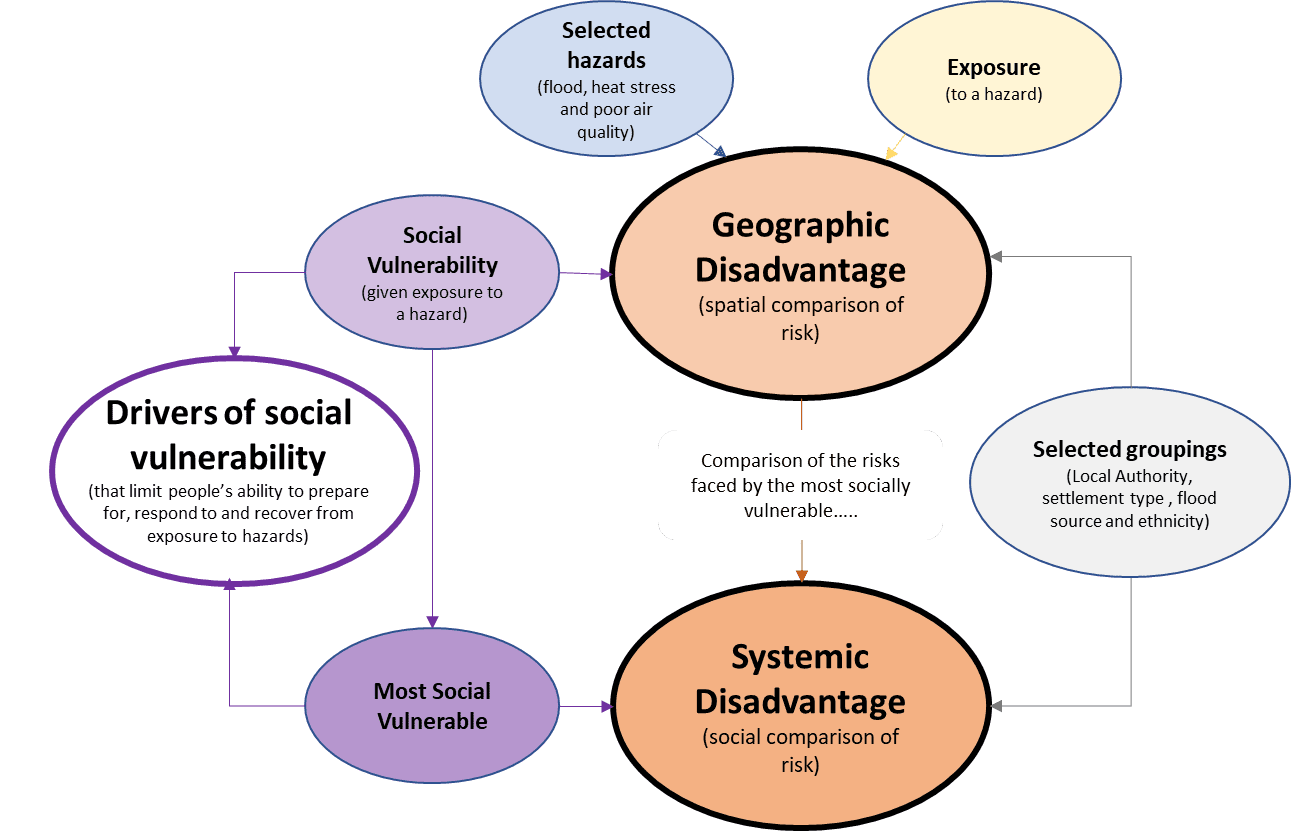
Figure 1 Overview of the assessment process
Climate-related disadvantage arises through the combination of two aspects:
- Social vulnerability – Social vulnerability refers to the combination of social characteristics of people and communities that determine their propensity for harm. Social vulnerability therefore reflects the inherent characteristics of the people and communities in which they live that would – if they were to be exposed to a hazard – make them more or less likely to experience a negative welfare outcome. There are many factors that contribute to social vulnerability, including bio-physical indicators such as older age groups and people with pre-existing ill-health as well as factors such as income, property tenure, access to insurance and access to support to enable adaptation. Multiple indicators are therefore used here to assess a relative measure of social vulnerability at the scale of a ‘neighbourhood’ (defined as one Data Zone[3]). The range of indicators used vary subtlety between the selected hazards (i.e., flooding, poor air quality and high temperatures) but many are shared (as detailed in Chapter 4). People and communities may be classified as socially vulnerable even if they are never exposed to a hazard – it is a measure of their potential to experience harm.
- Exposure to climate-related hazards – This refers to the likelihood of people and communities being exposed to one of the selected climate-related hazards (flooding, high temperature, and poor air quality). Exposure to each hazard varies across Scotland, with some communities more likely than others to be exposed to one or more of these three hazards.
To help understand how climate disadvantage manifests in Scotland the results of the analysis are viewed through two lenses; a geographic spatial lens and a systemic social lens as described below.
Geographic disadvantage (a spatial lens). This considers the risk faced by each neighbourhood, based on the social vulnerability and exposure to climate hazards within each neighbourhood. Those neighbourhoods with the greatest risk face the greatest ‘geographic disadvantage.’ To provide insight into how these risks are distributed, the risks at a neighbourhood scale are aggregated according to four selected groupings:
- Local authority: Local authorities are central to managing climate related risks and disadvantage (Figure 2, left). Neighbourhoods within a local authority area have been aggregated to enable an assessment of the geographic disadvantage faced by each local authority, and how this compares to other local authorities. All local authorities are considered alongside a specific focus on Glasgow and Dundee, that is used to illustrate the potential disadvantage experience in two city regions (Figure 2, right).
- Settlement type: The Scottish Government (2018) identifies eight settlement types ranging from very remote rural areas to large urban areas (Figure 2, middle). Neighbourhoods within each of these eight settlement types have been aggregated and compared to understand the differences in geographic disadvantage faced across rural and urban settings.
- Flood source: Across Scotland some communities are exposed to flooding and others are not, and the different sources of flooding can lead to different types of challenges. Neighbourhoods, therefore, have been grouped according to their potential exposure to three different sources of flooding: coastal, fluvial, and surface water. This enables an analysis and comparison of the risks faced across each source of flooding.
- Between different ethnic groups: Ethnicity is an important consideration across policy. Information on the proportional representation of five different ethnic groups in each neighbourhood (white, black / African / Caribbean, Asian, other minorities, mixed minorities) is used to aggregate the neighbourhood scale risks. The data on ethnicity is drawn from readily available information within public domain and linked at a neighbourhood scale to property tenure and income (Sayers et al., 2020). Ethnicity is not considered as a driver of social vulnerability, but aggregated risks faced by different ethnic groups is used to aid the understanding of distributional aspects of climate-related risks.
The approach and insights into geographic disadvantage across Scotland are discussed further in Chapter 5.
Systemic disadvantage (a social lens) (Sayers et al, 2017). Systemic disadvantage arises when the risks faced by the most socially vulnerable are greater than those experienced by the less vulnerable within a given grouping. To assess the degree of systemic disadvantage the risks faced by the 20% most socially vulnerable within the same local authority, settlement type, flood source or ethnic group are compared with the risks faced by the less vulnerable within the same group. This comparison of the risks faced within each of the four groupings helps to understand how the outcomes for the most socially vulnerable compare to those of others and hence, where needed, how improved outcomes may be appropriately supported (a central consideration in a just (i.e., fair) approach to adaptation, Rawls, 1971).
The approach and insights into systemic disadvantage across Scotland are discussed further in Chapter 6.
Note: Further elaboration of the assessment approach to both geographic and systemic disadvantage is provided where necessary throughout the report and in the supporting appendices.

Figure 2 Geographic aggregations – Local authorities, settlement types and city regions
Climate-related hazards – Present and future
Selected hazards
The 3rd Climate Change Risk Assessment (CCRA3) highlights increased climate-related risks across Scotland from a range of hazards (CCC, 2021). Flooding, increasing water scarcity and the degradation of the natural environment are all highlighted as important challenges. The European Environment Agency (EEA, 2017) also highlight higher temperatures and their association with poor air quality and other risks, such as wildfire, as important considerations.
Based on this evidence and review of available data, three selected priority climate-related hazards are assessed: flooding, heat stress, and air quality (with the rationale for their selection elaborated in Appendix 1). Both the associated present-day risks and how these may change in response to a 2oC rise in Global Mean Surface Temperature (GMST) by 2100 are assessed. In the case of flooding, a second higher, but plausible, 4oC rise in GMST is also considered (mirroring the scenarios used in UKCCRA3 future flood projections, Sayers et al., 2020). Information to support a similar analysis for heat and air quality given a 4oC climate future is not readily available and is excluded here.
Data sources and models
Table 1 sets out the data sources used, and processing undertaken, for each hazard. The approach necessarily varies across the selected hazards to reflect the availability of supporting datasets and previous analysis.
Adaptation assumptions
To explore future risk, it is assumed that flood-related adaptation continues as in the recent past (defined by the Current Level of Adaptation used within the CCRA3 flood projections, ibid) and that no further adaptation takes place to reduce heat or air quality risks (although it is noted that some aspects of adaptation are embedded in the UK Air Quality projections used here as input data). It is also assumed that the present-day socio-economic setting and related distributions (population, income etc) remains unchanged into the future.
|
Hazard |
Climate future* |
Climate data used |
Processing overview |
|
Flood | |||
|
Fluvial |
2oC, 4oC |
As used in UKCCRA3 – changes in future flows derived from UKCP18 Probabilistic Projections (in Sayers et al., 2020 based on Kay et al., 2020). |
Present-day and future flood hazard and associated risk are derived using the Future Flood Explorer (FFE, Sayers et al., 2020) taking account of climate change and a modification representation of Current Levels of Adaptation to better reflects existing flood defence standards in Scotland (as set out in UKCCRA3 modified to assume present-day coastal defence standards remain unchanged in urban areas). Note: The underlying information is based on the analysis undertaken for the UKCCRA3 (Sayers et al., 2020) that includes important caveats on variation in the accuracy of the underlying hazard mapping and important the location of the flood defence infrastructure and the ongoing programme of improvement. |
|
Coastal |
2oC, 4oC |
As used in UKCCRA3 – changes in relative Sea Level Rise (rSLR) from the UKCP18 Marine Report (Palmer et al., 2018) are used to provide an estimate of the change in coastal standards (in Sayers et al., 2020 based on Gouldby et al., 2017). | |
|
Surface water |
2oC, 4oC |
As used in UKCCRA3 – a pre-cursor to the 2.2km UKCP18 short duration rainfall projections (in Sayers et al., 2020 based Kendon et al., 2014 and Dale et al., 2017). | |
|
Air quality | |||
|
Particulate Matter (PM10) |
n/a |
Derived here using UK Air background concentrations developed for use in Local Air Quality Management assessments. These data are produced at a 1km resolution for the present-day (2018) through to 2030 with the latter taken as the future scenario for the purposes of this analysis (Figure 3). |
PM10 and NO2 are key pollutants influencing human health and regulated as such in associated regulatory frameworks. Severity is considered using a threshold approach to exposure based on the following thresholds: an annual mean air quality that exceeds 9.92 µg m3 PM10 and 9.21 µg m3 NO2 These thresholds represent the present-day (2018) average annual (mean) levels of PM10 and NO2 across Scotland. They are referred to as ‘poor air quality’ for the purposes of this report[4]. |
|
Nitrogen Dioxide (NO2, largely derived from burning fossil fuels) |
n/a | ||
|
Heat | |||
|
TMax – 95th percentile maximum temperature |
2oC Note: Equivalent data is not readily available for a 4oC |
Based on from 12km resolution UKCP18 outputs for the RCP8.5 scenario (Kennedy-Asser et al., 2021). The extreme heat measure is taken to be the average temperature for days exceeding the 95th percentile maximum temperature (TMax) for each 12km cell (Figure 4). Present-day refers to a 30-year period in the recent past (1990-2019). The future scenario refers to a 30-year period representing 2oC global warming*. |
Severity is considered using a threshold approach to exposure based on the following threshold: the mean temperature of days that exceed the present-day 95th percentile of the daily maximum summer temperature (TMax) averaged across Scotland (i.e., 21.6 °C). |
*Rise in Global Mean Surface Temperature (GMST)
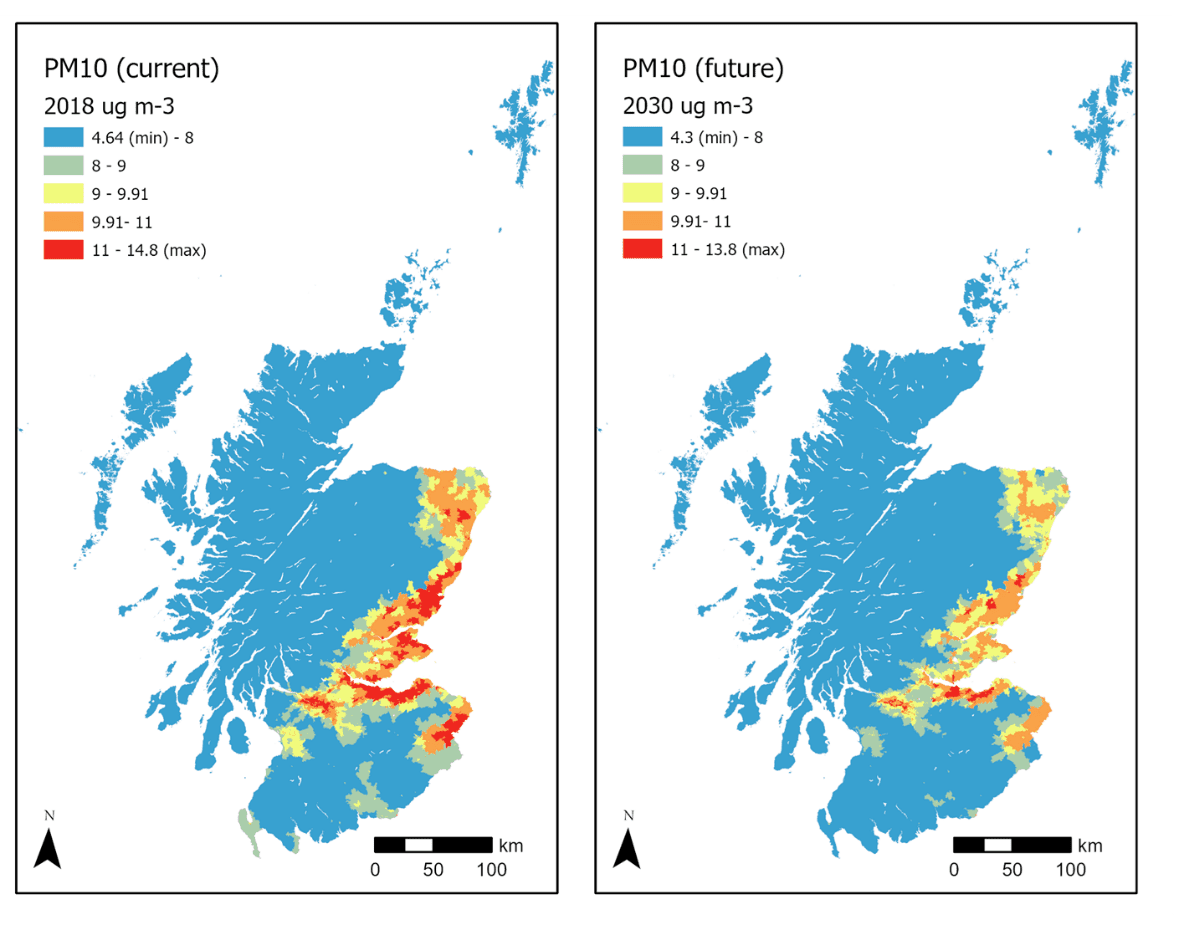
PM10 – Present and future (yellow, orange, and red indicate areas above the threshold of poor air quality used here)
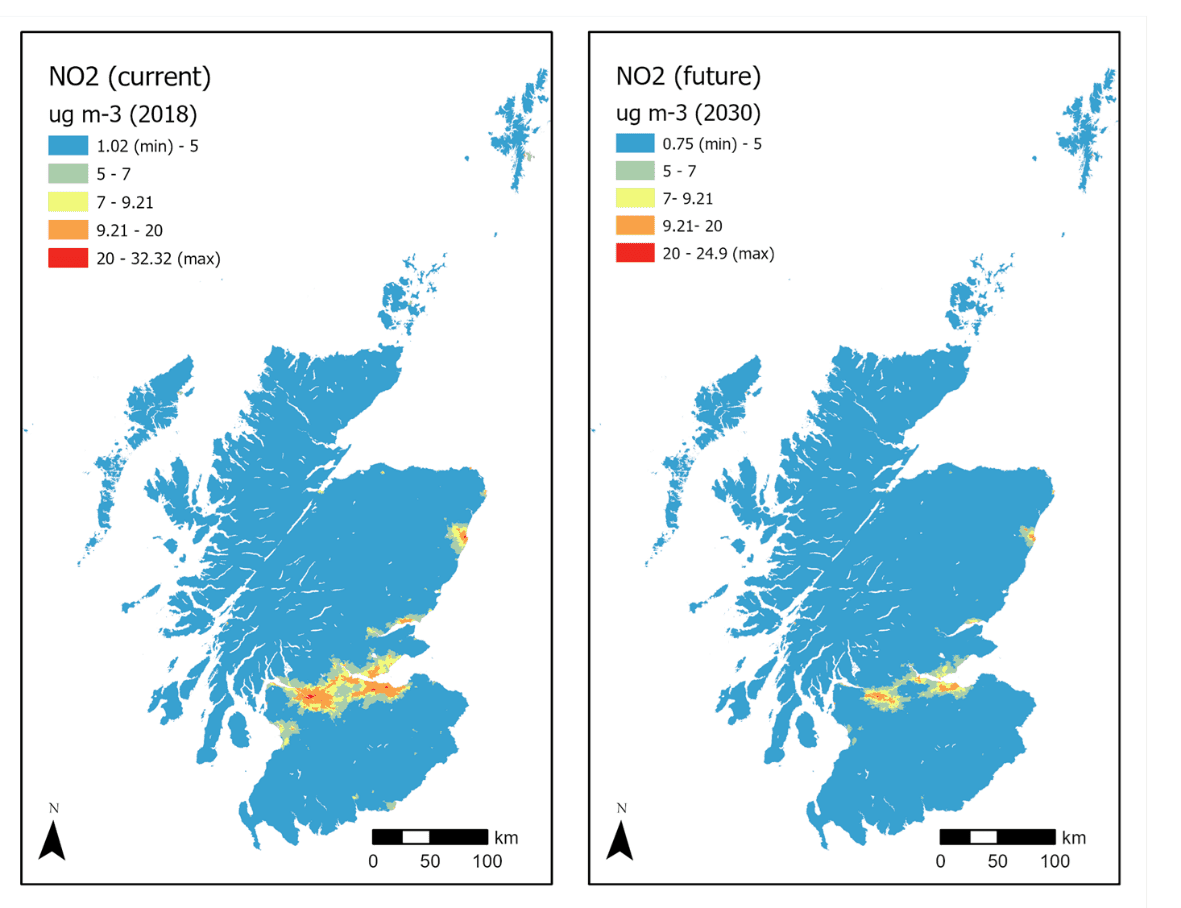
NO2 – Present and future (yellow, orange, and red indicate areas above the threshold of poor air quality used here)
Figure 3 Poor air quality – Present and future hazard
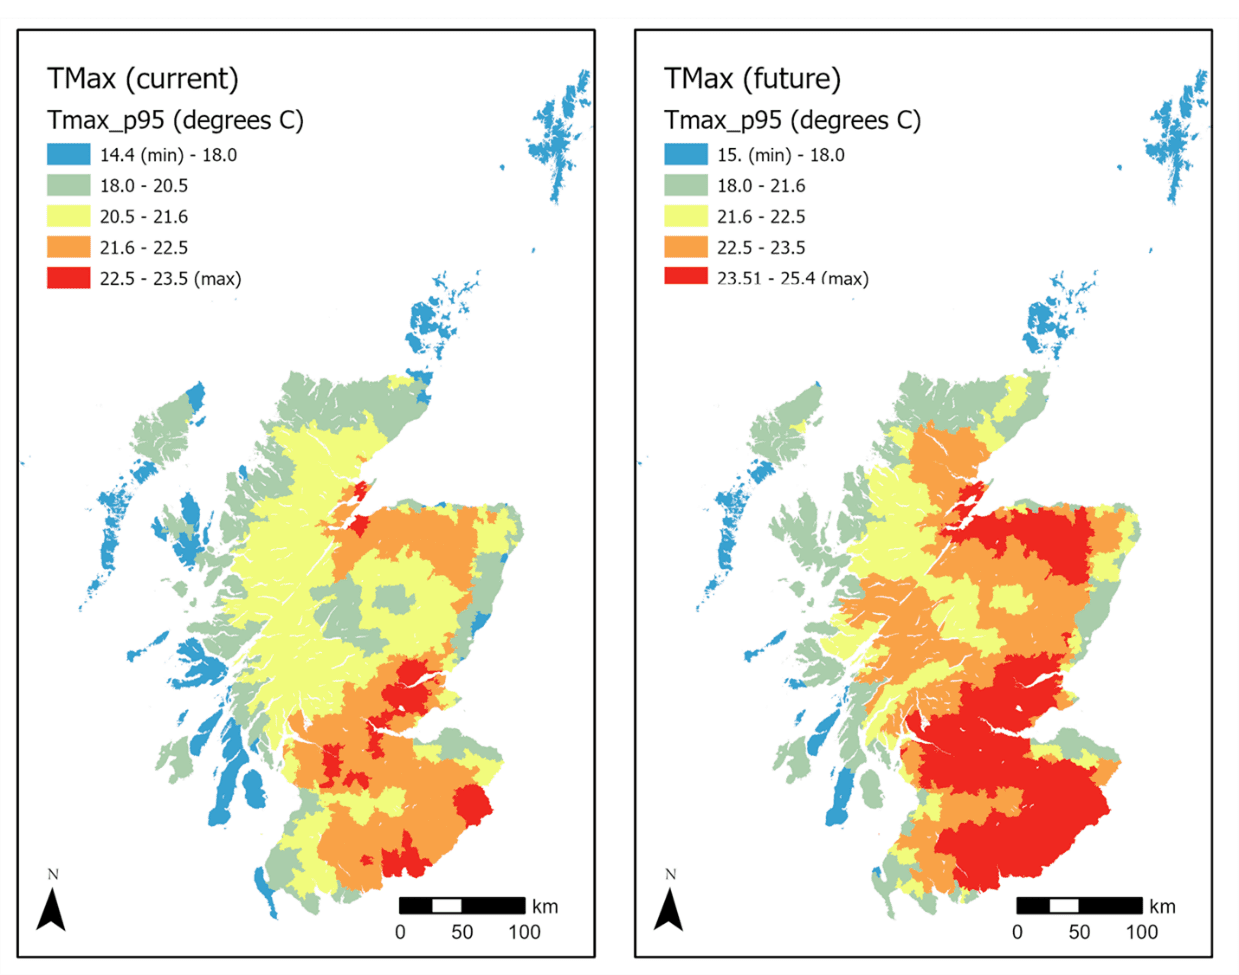 Left: Orange and red areas indicate areas above the threshold of high temperature used here
Right: Yellow, orange, and red indicate areas above the threshold of high temperature used here
Figure 4 High temperature – Present and future
Social vulnerability
What is social vulnerability?
Social vulnerability refers to characteristics of people and communities that determine their propensity for harm, irrespective of whether they are exposed to a hazard. Social vulnerability therefore reflects the specific characteristics of the people and communities in which they live that would – if they were to be exposed to a hazard – make them more or less likely to experience a negative welfare outcome.
There are many conceptualisations of social vulnerability and ways to consider who is vulnerable and why (e.g., Adger and Kelly, 1999; Tapsell et al., 2010; Lindley et al., 2011; Sayers et al., 2017, 2020). There is, however, general agreement that the most important characteristics relate to five domains:
- Susceptibility to harm – personal biophysical characteristics that lead to a differential (negative) impact on welfare given exposure to a hazard (e.g., older age groups and people with pre-existing ill-health).
- Ability to prepare – factors that may influence the degree to which people are able to prepare (e.g., access to insurance, income, and local knowledge).
- Ability to respond – factors that may influence the degree to which people are able to respond to a hazard event (e.g., income, personal mobility, and community networks).
- Ability to recover – factors that may influence how well people can recover from being exposed to a hazard event (e.g., income, insurance, housing mobility, and health service availability).
- Service access and community support – factors that may influence the help people are able to access when needed (e.g., GP services, help from neighbourhoods, access to online advice and support).
These domains underpin the three social vulnerability indices used here:
- Neighbourhood Flood Vulnerability Index (NFVI, Sayers et al., 2017)
- Neighbourhood (poor) Air Quality Vulnerability Index (NAQVI, defined here)
- Neighbourhood (high temperature) Heat Vulnerability Index (NHVI, defined here)
All three indices use multiple indicators at the scale of a ‘neighbourhood’ (defined by the census unit of a Data Zone, GI-SAT, 2011) to evaluate social vulnerability (Table 2). The selected indicators draw upon previous research (e.g., Lindley et al., 2011; Kazmierczak et al., 2015) and are combined to provide the three standardised social vulnerability indices across Scotland (Figure 5).
The rationale for the inclusion of each indicator is detailed in Appendix 2 together with the approach to calculating indices illustrated using the calculation of the NFVI.
| Group | Indicator | Heat | Air | Flood |
|
Age
|
Young Children |
🗸 |
🗸 |
🗸 |
|
Older Adults |
🗸 |
🗸 |
🗸 | |
|
Health
|
People in ill-health |
🗸 | ||
|
Households with members in ill-health |
🗸 | |||
|
Emergency hospital admissions |
🗸 |
🗸 | ||
|
Disability and ill-health |
🗸 |
🗸 | ||
|
Mood and Anxiety Disorders |
🗸 |
🗸 | ||
|
Medical and Care Residents |
🗸 |
🗸 | ||
|
Low birthweight |
🗸 |
🗸 | ||
|
Income
|
Unemployment |
🗸 | ||
|
Long-term unemployment |
🗸 | |||
|
Low-income occupations |
🗸 | |||
|
Households with dependent children and no employed adults |
🗸 | |||
|
Employment Deprivation |
🗸 |
🗸 | ||
|
Income Deprivation |
🗸 |
🗸 |
🗸 | |
|
Average Household Income |
🗸 |
🗸 | ||
|
Information Use |
Recent Arrivals to the UK |
🗸 | ||
|
English Proficiency |
🗸 |
🗸 |
🗸 | |
|
Internet
|
Sub-standard Broadband |
🗸 |
🗸 | |
|
Lack of Superfast Broadband |
🗸 |
🗸 | ||
|
Local knowledge
|
Population Transience |
🗸 |
🗸 | |
|
New Migrants from outside the local area |
🗸 | |||
|
Tenure
|
Social renting |
🗸 |
🗸 |
🗸 |
|
Private renting |
🗸 |
🗸 |
🗸 | |
|
Direct Flood Experience |
Households exposed to significant flood risk |
🗸 | ||
|
Crime |
Crime rates |
🗸 |
🗸 |
🗸 |
|
Mobility
|
Disability |
🗸 | ||
|
Disability and Ill-health |
🗸 |
🗸 | ||
|
Medical and Care Residents |
🗸 |
🗸 |
🗸 | |
|
Private Transport ownership |
🗸 |
🗸 |
🗸 | |
|
Accessibility by bus |
🗸 |
🗸 | ||
|
Social networks
|
Single Pensioner Households |
🗸 |
🗸 |
🗸 |
|
Primary School networks |
🗸 |
🗸 |
🗸 | |
|
Civil Organizations |
🗸 |
🗸 | ||
|
Single Adult Households |
🗸 |
🗸 | ||
|
Lone Parent Households with dependent children |
🗸 | |||
|
Health service access
|
Accessibility of Pharmacies |
🗸 |
🗸 | |
|
Accessibility of Hospitals |
🗸 |
🗸 | ||
|
Travel time to GP surgery (private transport) |
🗸 |
🗸 | ||
|
Travel time to GP surgery (public transport) |
🗸 |
🗸 | ||
|
Service Availability |
Emergency services exposed to flooding |
🗸 | ||
|
Care homes exposed to flooding |
🗸 | |||
|
GP surgeries exposed to flooding |
🗸 | |||
|
Schools exposed to flooding |
🗸 | |||
|
Indoor pollution sources |
Smoking Behaviour |
🗸 | ||
|
Indoor sources |
🗸 | |||
|
Housing Characteristics |
Caravan, mobile or temporary structures in all households |
🗸 |
🗸 |
🗸 |
|
Overcrowding |
🗸 | |||
|
High Rise Flat indicator |
🗸 | |||
|
Urban cover |
🗸 | |||
|
Lack of Private Greenspace |
🗸 | |||
|
Lack of Community Greenspace |
🗸 |
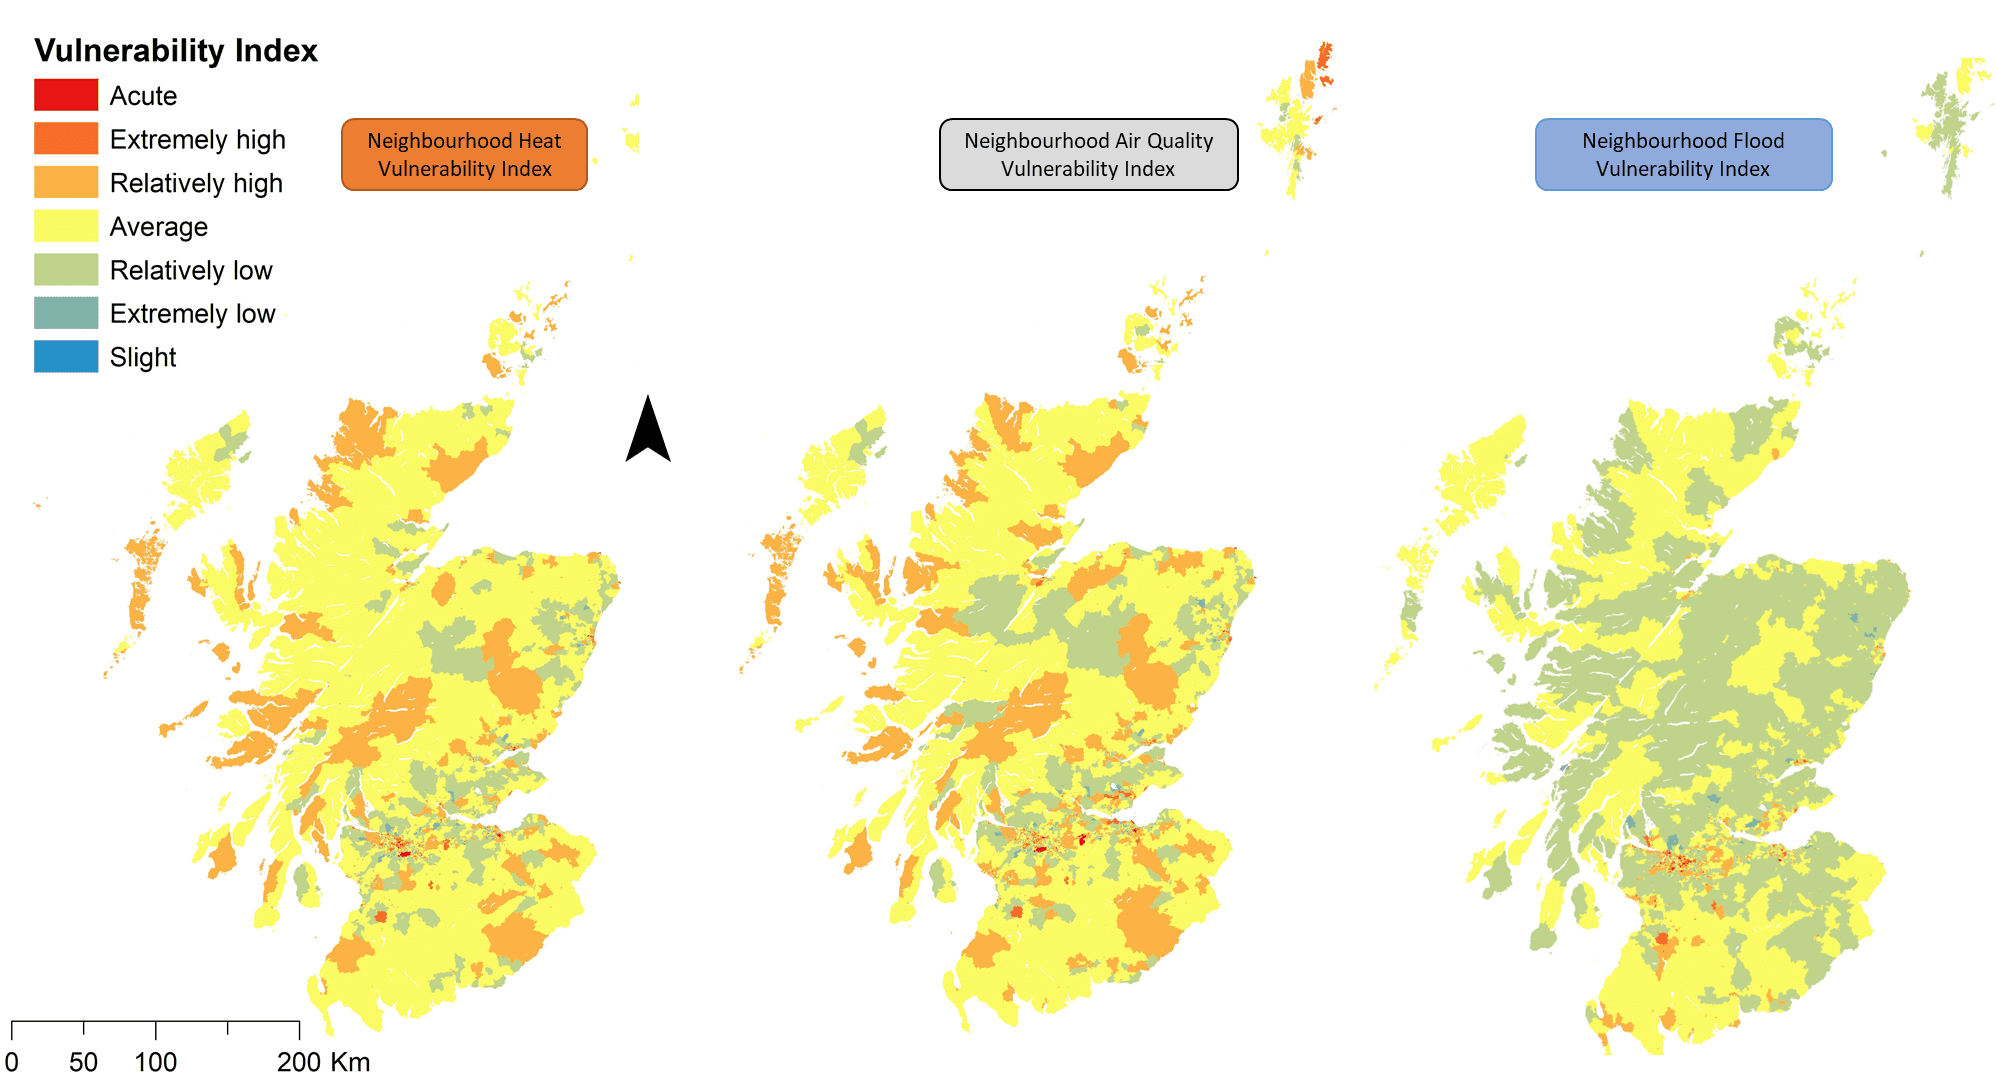
Figure 5 Indices of social vulnerability across Scotland: Heat, air quality, and flooding
Drivers of social vulnerability
Social vulnerability varies across Scotland. These include low income, ill-health, property tenure (particularly social housing) and a lack of local knowledge (either due to issues of language or relatively poor internet access) as well as biophysical sensitivities due to household composition (physical mobility, younger children, and older adults). Consequently, many of the neighbourhoods most socially vulnerable to one hazard are also inherently vulnerable to the others. The relative importance of these common factors that influence social vulnerability to each hazard, as well as hazard specific influences, are discussed below.
Flooding – Neighbourhood Flood Vulnerability Index
Poor health, income deprivation, and limited mobility are dominant contributors to social vulnerability to flooding across all settlement types (Figure 6). Income affects the extent to which people can prepare for, respond to, and recover from events (including their ability to purchase household insurance, make property adaptations or have autonomy over other aspects of adaptation). Restricted personal mobility and transport make it difficult to deploy household level adaptations (e.g., flood gates, move personal items or respond to post-flood challenges, such as find alternative accommodation or access services). In remote and rural areas, social and physical isolation also have a strong influence on social vulnerability. The most socially vulnerable neighbourhoods, particularly in very remote rural areas, also tend to experience low mobility (linked to indicators of physical disability, residential care, and private transport availability) and are more likely than others to have local services (e.g., GP practices and hospitals) affected by flooding and may have more limited social networks to draw upon (e.g., as suggested by higher number of single person households).
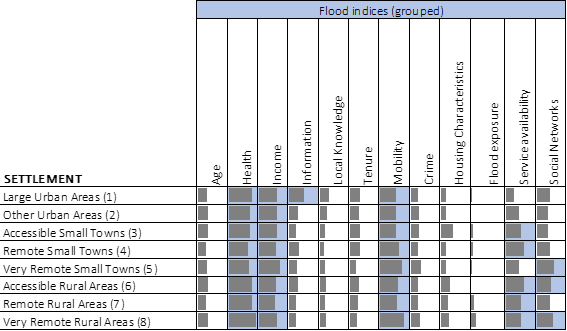
Bars show the relative contribution to the overall index of social vulnerability. Highlighted cells show the grouped indicators with greatest influence on social vulnerability for each settlement type.
Figure 6 Relative contributions to the Neighbourhood Flood Vulnerability Index
Poor air quality – Neighbourhood Air Quality Vulnerability Index
Biophysical drivers of social vulnerability (e.g., age, including younger children and older adults, as well as underlying health conditions) are important influences across Scotland (although are particularly influential in smaller towns and remote rural areas). These combine with income deprivation, lack of local knowledge (relating to pollution), and the presence of indoor air pollution sources that exacerbate the risk (e.g., parental smoking and household fuel types) to be the dominant drivers of social vulnerability to poor air quality across Scotland (Figure 7). In combination these issues both increase the potential to experience harm when exposed to poor air quality and reduce the capacity of households to adapt to poor air quality during an event and in the longer term.
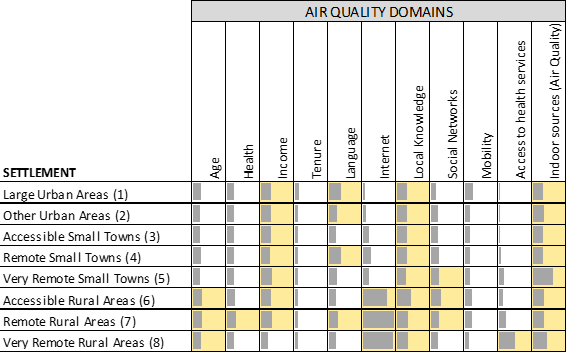
Bars show the relative contribution to the overall index of social vulnerability. Highlighted cells show the grouped indicators with greatest influence on social vulnerability for each settlement type.
Figure 7 Air quality – Relative contributions of social vulnerability
Beyond these nation-wide patterns, in rural and more remote areas poor internet availability further undermines adaptive capacity (limiting access to online information and health services as well as access warnings and support). Consequently, accessible rural areas, remote rural areas and very remote rural areas tend to higher social vulnerability than elsewhere due to lower adaptative capacity driven by relatively poor communications. Rural communities also tend to exhibit an increased prevalence of indoor sources of pollution that further increase inherent vulnerability to poor air quality. In remote towns and remote rural areas more limited English proficiency is also an influential factor in determining the overall level of social vulnerability. Within large urban areas and other urban areas social vulnerability is driven by issues of income, language, and local knowledge. The adaptive capacity of households in these communities tends to be limited due to poor access to information (e.g., reflecting limited internet connectivity) that in turn restricts awareness of potential problems as well as income.
High temperature – Neighbourhood Heat Vulnerability Index
Similar indicators increase social vulnerability as reported for air quality and flooding, particularly income and local knowledge (Figure 8). These drivers combine to undermine adaptive capacity by limiting the available resources to adapt their homes, accessing information about the dangers of excess heat in their homes, and accessing help during heatwaves.
In rural and remote areas, factors associated with biophysical drivers (relating to health and age) are also important influences on social vulnerability. As with air quality, the ability to access information through online sources tends to be more difficult. Difficulties in accessing health services is a particularly influential driver in very remote rural areas (although such areas are less likely to experience high temperatures, residents will be less well adapted to heat-wave events when very extreme events do occur).

Bars show the relative contributions to the overall index of social vulnerability. Highlighted cells show the domains with greatest influence on the vulnerability index for each settlement type.
Figure 8 Heat indicators – Relative contributions to social vulnerability
Variation in social vulnerability across Scotland
By Local authority
Social vulnerability varies between Local Authorities (Figure 9). The social character of some Local Authorities, including West Dunbartonshire, Glasgow City, and Dundee City, leads to high levels of social vulnerability to all hazards. This reflects the many challenges these Local Authorities face in addressing underlying social issues (such as income and information access that are important drivers of social vulnerability across all hazards). Subtle differences in the drivers of social vulnerability to each hazard are evident in some locations. For example, East Ayrshire exhibits a particular social vulnerability to flooding (as represented through the NFVI), whereas in Argyll and Bute, for example, social vulnerability to heat and air quality is dominant.

Positive values indicate greater social vulnerability compared to the average across Scotland. Data are averages (means) for each local authority.
Figure 9 Social vulnerability indices by Local Authority
By settlement type
Social vulnerability to all three selected hazards (flood, poor air quality and heat) is greatest in large urban areas, remote small towns, and very remote small towns (Figure 10). The underlying social vulnerability to poor air quality and heat are typically higher in more rural areas than the equivalent vulnerability to flooding. In part this reflects the important influence of internet access within the assessment of social vulnerability to poor air quality and high temperatures that is typically more limited in rural areas (an influence not explicitly included as part of the social vulnerability to flooding, see table 2.

A positive value indicates the social vulnerability is greater than the national average. A negative value indicates social vulnerability is less than the national average. All data are means.
Figure 10 Social vulnerability by settlement type: Flood, heat, and air quality
Geographic disadvantage
What is geographic disadvantage
Geographic disadvantage considers the combination of social vulnerability (from Chapter 3) and exposure to a hazard (i.e., high temperatures, poor air quality or flooding). How exposure to a hazard and social vulnerability combine determines the related social risk. Those neighbourhoods with the greatest risk are at greatest geographic disadvantage.
Geographic flood disadvantage
By flood source
Across Scotland fluvial flood risks are dominant today (~2018) and remain so in the future. Surface water flood risks and coastal flood risks are projected to increase more rapidly than fluvial risks and hence make a larger contribution to the national risk by 2080s (in terms of Expected Annual Damage, EAD)[5]. This is particularly the case given a 2oC climate future (Figure 11).

EAD is based on residential direct damage
Figure 11 Flood – Expected Annual Damage by flood source – all neighbourhoods
By Local Authority
Flood risk (as expressed by EAD) varies significantly across the Local Authorities, with Glasgow City, and Dumfries and Galloway experiencing the greatest risk today (~2018) and in the future (Figure 12). EAD is based on residential direct damage
As sown in Figure 12 the influence of climate change varies, with some Local Authorities experiencing more significant increases in flood risk than others. In Dundee City, Orkney Islands, North Lanarkshire, and Inverclyde, for example, the present-day flood risk is projected to double by the 2080s given a 4oC climate future. In some locations the influence of climate change on flood risk is much less; in South Ayrshire, Perth and Kinross, and East Renfrewshire, for example, the projected increase is around 30%.

EAD is based on residential direct damage
Figure 12 Flood – Flood – Expected Annual Damage by Local Authority – All neighbourhoods
By settlement type
Flood risk (as expressed by EAD) varies across the eight settlement types. Most of the national flood risk is generated within urban areas (large urban areas and other urban areas) – Figure 13. This is as expected given the large number of people living within the major, low-lying, estuaries of Scotland. Accessible rural areas are also significant in the context of the national flood risk profile. This is less intuitive and may in part reflect the greater uncertainty in underlying understanding of flood hazards in rural settings (including less information on the location and standard of flood defences). At an aggregated scale however, this insight is considered a credible finding.

EAD is based on residential direct damage
Figure 13 Flood – Expected Annual Damage by settlement type – all neighbourhoods
A focus on EAD can be misleading in terms of understanding how the risk is distributed at an individual scale. This is because some settlement types represent a much higher number of people than others. The metric of Expected Annual Damage: Individual (EADi, as defined in Sayers et al, 2017) provides an insight into the risk experienced by individuals (Figure 14). The EADi is calculated by dividing the EAD by the exposed population and highlights that those individuals living in smaller towns (accessible small towns) and rural areas (all categories) are, on average, subject to greater levels economic risk that those living in urban areas.

EADi is based on EAD residential direct damage normalised by population
Figure 14 Flood – Expected Annual Damage: Individual by settlement type – all neighbourhoods
By ethnicity
Present-day risk experienced by each ethnic group is similar, although black ethnic groups experience slightly higher flood risk today (when expressed by EADi) than all others (on average). In the future, given climate change, this broad pattern remains, however the risks faced by black, Asian, and Other minority groups are projected to increase more rapidly than for others (Figure 15). This tends to reflect the concentration of these ethnic groups in urban settlements most exposed to increases in flood hazard as the climate changes.

EADi is based on EAD residential direct damage normalised by population across Scotland
Figure 15 Flood – Expected Annual Damage: Individual – By ethnicity
Geographic air quality disadvantage
In general, poor air quality associated with NO2 is principally limited to larger urban areas although there is a stronger regional component for PM10 (Figure 3). As efforts are made to reduce emissions, air quality is projected to improve from present-day levels by 2030 in terms of both PM10 and NO2 (although the broad spatial pattern of concentrations remains largely unchanged). Consequently, there is a corresponding projected reduction in the proportion of neighbourhoods across Scotland exposed to above threshold concentrations of PM10 (falling from 57% in 2018 to 31% in the future) and of NO2 (from 46% to 14%).
This national scale perspective masks the significant variation in disadvantage across Scotland, as illustrated by Figure 16. This figure presents the spatial pattern of disadvantage by combining the Neighbourhood Air Quality Vulnerability Index (Figure 5) with the air quality hazard (Figure 3). Areas marked as extremely high or acute are of particular interest as these locations are within the 20% most disadvantaged across Scotland. The reason for this may be because:
- High social vulnerability levels combine with high concentration levels
- Lower social vulnerability levels combine with very high concentrations
- Lower concentrations combine with very high social vulnerability levels
These issues are considered further below from the perspective of Local Authorities, different settlement types and ethnic groups below.
By Local Authority
Glasgow City experiences the highest level of disadvantage associated with below average air quality, with over half of its neighbourhoods within the 20% most disadvantaged neighbourhoods today and in the future (Figure 18). Similarly, a high proportion of their neighbourhoods within the cities of Edinburgh and Dundee are within the 20% most disadvantaged in terms of below average air quality across Scotland. The principal pollutant of concern is not the same in all Local Authorities. In Mid Lothian and East Lothian, below average air quality is driven largely by PM10 and less so NO2. In Aberdeen, the opposite occurs, with high levels of disadvantage more associated with NO2.

Figure 16 Air quality – Future (2030s) – Social disadvantage. Left: PM10 –future; Right: NO2 –future. In both yellow indicates the Scottish average, i.e., areas where the combination of relative social vulnerability and relative air quality balance out at around average overall. Present-day distributions are similar and not shown here

A neighbourhood is defined at ‘significant risk’ if it is within the 20% most disadvantaged neighbourhoods across Scotland
Figure 17 Air quality – Local Authority
By settlement type
Much of Scotland is sparsely populated with good air quality (according to the threshold values set out earlier in Table 1). Exposure to below average air quality tends to be associated with urban areas (Figure 18). This is particularly evident for NO2 and, of course, is unsurprising. This basic narrative, however, masks two more subtle insights that highlight the present-day regional influence of PM10 pollution in accessible small towns and rural areas and that the air quality hazard is projected to significantly improve in urban settings (but this relies upon significant reduction in emissions).
By ethnicity
There is a stark variation in exposure to below average air quality (defined by the threshold values set out earlier in Table 1) across different ethnic groups (Figure 19). There is also a marked disproportionality in who benefits most from the projected improvements in future air quality. For PM10, for example, non-white ethnic groups are much more likely to experience below average PM10. This is especially true for the black ethnic group since there are five times as many black people living in neighbourhoods with above average PM10 concentrations compared to below average PM10 concentrations. Indeed, the black, and the ‘other’ non-white ethnic groups are the only groups who are still more likely to be exposed to above present-day average PM10 concentrations than not by 2030. A similar pattern holds for NO2 with the black, Asian, and other non-white ethnic groups all being more than three times as likely to be exposed to above average NO2 concentrations compared to below average NO2 in the present-day. By 2030, people in non-white ethnic groups are still more likely to be exposed to NO2 concentrations above the present-day average than people in the white ethnic group.

A value of 1.0 indicates a 1:1 ratio, i.e., an equal number of people exposed to above and below threshold of present-day average air quality (Table 1) today and in the future in the specified settlement type. Values greater than 1 indicate that a larger proportion of people living in the given settlement type are exposed to above threshold conditions compared to below threshold conditions.
Figure 18 Exposure to below average air quality – By settlement type

A value of 1.0 indicates a 1:1 ratio, i.e., an equal number of people exposed to above and below threshold of present-day average air quality (Table 1) today and in the future in the specified ethnic group. Values greater than 1 indicate that a larger proportion of people in the given ethnic group are exposed to above threshold conditions compared to below threshold conditions.
Figure 19 Exposure to below average air quality – By ethnic group
Geographic heat disadvantage
Much of the south and east of Scotland (away from the cooler coastal fringe) is projected to experience a considerable rise in high temperatures relative to the present-day average (Figure 4). Combining this pattern of exposure with information on social vulnerability provides an assessment of disadvantage (Figure 20). The distributions of disadvantage by Local Authorities, settlement types and ethnicities are discussed below.
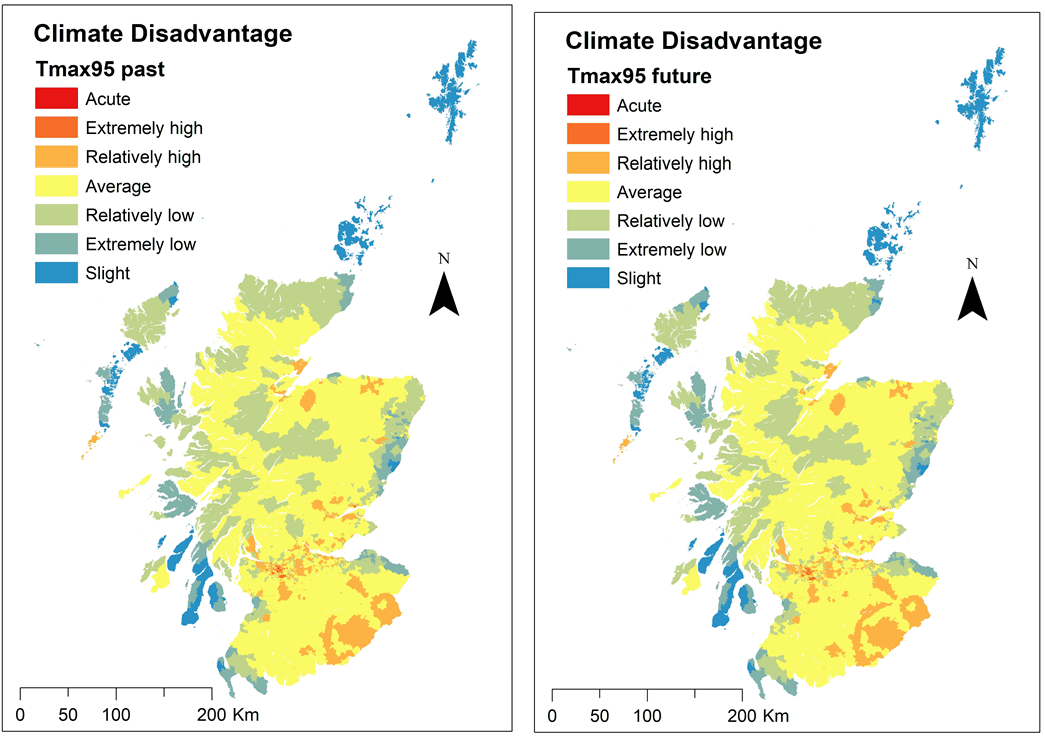
Figure 20 Heat – Future (2oC 2030s) – Social disadvantage
By local authority
All but 16% of Glasgow City’s neighbourhoods fall within the top 20% most heat disadvantaged neighbourhoods in Scotland, with East Renfrewshire, Falkirk and Dundee City also already experiencing significant heat disadvantage (Table 2). In general, most Local Authorities with significant disadvantage today continue to experience similar risks in the future. There are however some variations. Across Falkirk, for example, relative social risk from heat is projected to reduce in the future, whereas elsewhere increases are projected (e.g., in Scottish Borders and Dundee City). This takes account of changes in relative patterns of warming (Figure 21).

A neighbourhood is defined at ‘significant risk’ if it is within the 20% most disadvantaged neighbourhoods across Scotland. Local authorities with less than 1% of neighbourhoods at significant risk are excluded from the chart.
Figure 21 High temperature – Local Authority
By settlement type
Heat disadvantage is currently largely confined to urban areas (Figure 22). The present-day disadvantage is projected to increase and extend to influence more rural settings. The projected increase is significant across all settlement types (including a fourfold increase in the population exposed to above average maximum temperatures in Other Urban areas by 2030s).

A value of 1.0 indicates a 1:1 ratio, i.e., an equal number of people exposed to above and below threshold of present-day average high temperatures (defined by Tmax95) today and in the future in the specified settlement type. Values greater than 1 indicate that a larger proportion of people living in the given settlement type are exposed to above threshold conditions compared to below threshold conditions.
Figure 22 Exposure to above threshold high temperature – By settlement type
By ethnicity
The projected increase in exposure to extreme heat varies considerably between ethnic groups (Figure 23). Given a 2oC rise in GMST and assuming no change in population distribution, the analysis suggests that people in the Asian ethnic group are almost eight times as likely, and black groups more than nine times as likely, to live in neighbourhoods where temperature extremes are above the present-day Scottish average (as defined by the Tmax95) compared to below the present-day Scottish average.

A value of 1.0 indicates a 1:1 ratio, i.e., an equal number of people exposed to above and below threshold of present-day average high temperatures (defined by Tmax95) today and in the future in the specified ethnic group. Values greater than 1 indicate that a larger proportion of people in the given ethnic group are exposed to above threshold conditions compared to below threshold conditions. The threshold for comparison is an average (mean) temperature for Scotland (Table 1). This national value is compared against respective local averages per neighbourhood to determine whether the neighbourhood’s population is exposed or not. Given the resolution of temperature data used and tendency for warmer areas to be more populated all values are greater than 1.
Figure 23 Heat – Exposure to above average maximum temperatures – By ethnic group
Systemic Disadvantage
What is systemic disadvantage?
Systemic disadvantage arises when the risks faced by the most socially vulnerable are greater than those experienced by others.
Systemic flood disadvantage
Systemic flood disadvantaged is explored by comparing the risks faced by all neighbourhoods with those faced by the 20% most socially vulnerable neighbourhoods (as defined by the NFVI) within a given grouping (i.e., those exposed to the same flood source, living within the same settlement type, or from the same ethnic group).
By flood source
Across Scotland the present-day Expected Annual Damage experienced by an individual (EADi) living within the 20% most socially vulnerable neighbourhoods is, on average, similar in the case of surface water flooding and slightly less in the case of fluvial and coastal flooding (Figure 24). Given climate change, surface water and coastal flood risks increase similarly for the less and most socially vulnerable (in both a 2oC and 4oC future). Fluvial flood risk, however, is projected to increase more rapidly for the most socially vulnerable than for others given a 4oC climate future. The reason for this is difficult to determine (given the scope here) but highlights the importance understanding flood source-specific issues in supporting a just transition.

EADi based on EAD residential direct damage normalised by population
Figure 24 Flood – Systemic disadvantage in Expected Annual Damage: Individual by source
By settlement type and city regions
Flood risk (as defined by the EADi) experienced by those living in the 20% most socially vulnerable neighbourhoods varies markedly across the eight settlement types, with the most socially vulnerable living in remote and very remote small towns, accessible rural areas as well as other urban areas experiencing significantly higher risk than the average (Figure 25Figure 25).
The city of Glasgow and Dundee are important cites in Scotland with contrasting contributions to the national flood risk profile of Scotland; with the Expected Annual Damages from flooding greater in Glasgow than any other Local Authority whilst in Dundee flood damages are much less. This simple narrative fails to capture differences in the number of people exposed to flooding (with Glasgow having many more people exposed to flooding than Dundee) and provides no insight to how the risks are distributed between the most and less socially vulnerable. In both cities, when normalised by the exposed population, the most socially vulnerable experience greater risk than the less socially vulnerable and higher than average risk compared to the most socially vulnerable neighbourhoods across Scotland (as defined by EADi, Figure 26). When income, property tenure, and the likely access to insurance is considered (using the metric of Relative Economic Pain, REP, Sayers et al., 2017)[6] the significant disadvantage experienced by the most socially vulnerable in Dundee (and to a lesser extent Glasgow) is clear (Figure 27). This is likely to reflect the combined influences of low income, and social and private rented accommodation; both of which are considered important barriers to insurance (as reported by Flood Re, Sayers et al., 2020).
EADi based on EAD residential direct damage normalised by population across Scotland
Figure 25 Flood – Systematic disadvantage – By Settlement type

EADi based on EAD residential direct damage normalised by population
Figure 26 Flood – Systematic disadvantage (EADi) – Glasgow and Dundee city regions

Relative Economic Pain (REP) expresses the ratio between uninsured economic damages and household income
Figure 27 Flood – Systematic disadvantage (REP) – Glasgow and Dundee city regions
By ethnicity
Flood risk varies significantly across the five ethnic groups considered. As discussed earlier, black ethnic groups regardless of social vulnerability, on average, experience much higher levels of risk compared to others (Figure 15). This disproportionality is underlined when considered from the perspective of Relative Economic Pain (REP). As shown in Figure 28, the REP associated with present day flood risk is around 1.8 times higher within the black ethnic groups compared to the national average. This increases to 3.6 times by the 2080s given a 4oC climate future (much higher than for any other ethnic group). When comparing the risks faced by the most socially vulnerable within each ethnic group, the most socially vulnerable white groups are most disadvantaged, experiencing a REP of flooding similar to, or greater than, the average for white ethnic groups (Figure 28). The broader social and economic drivers for these issues are difficult to determine but reflect similar issues within the analysis here. For example, both black and the most socially vulnerable white groups are more likely than others to be living in socially rented accommodation and (Figure 29a) and within these two groups household incomes are also more likely to be constrained (Figure 29b). These findings indicate greater inequalities amongst white ethnic groups compared to others around both household incomes and household tenure. These influences lead to both black groups and the most socially vulnerable white groups experiencing higher levels of REP (from flooding) compared to others.
Note:
As introduced earlier the social vulnerability of each neighbourhood is independent of ethnicity. The systemic disadvantage within each ethnic group has therefore been determined as follows:
- The number of people from each ethnic group within each neighbourhood is determined based on published proportions at the neighbourhood scale.
- The number of people from each ethnic group living within the 20% most socially vulnerable neighbourhoods is then summed.
- The proportion of people from each ethnic group living with the 20% most socially vulnerable neighbourhoods is then determined.
- The various metrics (EADi, REP etc) for each ethnic group, including those living in 20% most socially vulnerable neighbourhoods and for all neighbourhoods are then determined.

A value of one indicates the Relative Economic Pain (REP) is equal to the present-day national average in Scotland. A value greater than one indicates the REP is higher than the present-day average by the given factor (i.e., a value of 1.5 indicators the REP is 1.5 times the present-day value).
Figure 28 Flood – Relative Economic Pain – By ethnicity

Distribution of tenure – Percentage of households living in social rented accommodation

Distribution of income (social renters) – Percentage of national average
Figure 29 Ethnicity – Income and tenure distribution
Systemic air quality disadvantage
Systemic disadvantage associated with air quality is explored by comparing the ratio of people facing above average concentrations of PM10 and NO2 compared to below average concentrations, using 2018 as a baseline. The assessment compares ratios for all neighbourhoods to those in the 20% most socially vulnerable neighbourhoods (defined using the Neighbourhood Air Quality Vulnerability Index – NAQVI) and grouped by settlement type.
Today, people living in large urban areas are six times more likely to be exposed to above average rather than below average concentrations of PM10, and eight times more likely for NO2. However, the most socially vulnerable neighbourhoods within large urban areas are much more likely to experience above average poor air quality, being nearly 10 and 13 times more likely for PM10 and NO2 respectively, i.e., compared to the population as a whole living in that settlement type (Figure 30). There is also a particular tendency for the most socially vulnerable neighbourhoods to experience higher pollutant concentrations in other urban areas (for NO2) and accessible small towns (for PM10) (Figure 31).
Elsewhere, the most socially vulnerable are generally less likely to be exposed to above mean concentrations compared to the population as a whole living in that settlement type, or there is very little difference. In rural areas, air quality is generally very good (and is expected to be even better in the future – Figure 18). In all rural areas, it is therefore more likely that people are exposed to concentrations which are below the Scottish mean rather than above it.
In the future, far fewer people are estimated to be exposed to concentrations above present-day averages. Nevertheless, future air quality improvements are expected to be less marked for the most socially vulnerable in large urban areas (for PM10 and NO2) and accessible small towns (for PM10) compared to the population as a whole living in these settlement types.

The y-axis shows the ratio of people expected to be exposed to above vs. below average concentrations of PM10 and NO2 using 2018 as the baseline. A value of 1 represents no difference, i.e., the same number of people for above vs. below.
Figure 30 Air Quality – Exposure to below average air pollutant concentrations – By settlement type

The y-axis shows the mean concentrations of PM10 and NO2. This is expressed as a mean of all neighbourhoods associated with each of the settlement types.
Figure 31 Mean air quality of all and top 20% most vulnerable by settlement type
Systemic heat disadvantage
Across Scotland, the most socially vulnerable neighbourhoods are disproportionately exposed to high temperatures (Figure 32). This is particularly the case in large urban areas, remote small towns, and accessible rural areas (Figure 33). In very remote small towns and very remote rural areas the reverse is true. This is because social vulnerability in these settlement types is strongly influenced by isolation-related factors (such as low accessibility of health services and poor internet) and isolated, more rural areas tend to have lower temperatures and lower temperature extremes. Currently the most socially vulnerable neighbourhoods in large urban areas are much more likely than not to be exposed to above average high temperatures (Figure 34). This is also true under the 2oC scenario; however, the most marked finding is that almost all socially vulnerable neighbourhoods in accessible rural areas are expected to experience above average high temperatures in the future relative to the present-day high temperature threshold. Similar patterns are seen in remote small towns and remote rural areas. In contrast, other urban areas and accessible small towns are expected to see a general trend towards higher numbers of people in less vulnerable neighbourhoods becoming exposed to temperatures exceeding the present-day high temperature average relative to the most socially vulnerable in the same settlement type.

Figure 32 Comparison of exposure of most socially vulnerable neighbourhoods
The y-axis shows the mean temperature for days exceeding the 95th percentile maximum temperature (TMax). This is expressed as a mean of all neighbourhoods associated with each of the settlement types. Modelled temperatures are averaged over large areas (see Table 1) so are expected to under-estimate elevated temperatures due to factors like Urban Heat Island intensity.

Figure 33 High temperatures of all and top 20% most vulnerable by settlement type

The y-axis shows the ratio of people expected to be exposed to above vs. below average high temperatures, i.e., for days exceeding the 95th percentile maximum temperature (TMax), using the present-day (1990-2019) as the baseline. The 1:1 line represents no difference, i.e., the same number of people for above vs. below. This accounts for the total number of people living in all neighbourhoods associated with each of the settlement types.
Figure 34 Heat – Exposure to worse than average high temperatures – By settlement type
Conclusions
The analysis presented provides evidence to support the development of more targeted approaches to delivering a just transition and improving resilience to climate change across Scotland. The analysis selects three climate related hazards (flooding, heat, and poor air quality) and for each explores three research questions:
- What are the drivers of social vulnerability to climate hazards across Scotland?
- Which groups are at the greatest social risk from climate related hazards, now and in the future?
- To what extent are the most socially vulnerable disproportionately impacted by climate-related hazards?
The rationale for the selected climate-related hazards and the conclusions from the research are summarised below.
Drivers of social vulnerability
Across Scotland, low income and poor heath are key drivers of social vulnerability. Income is important because of the potential for reducing adaptive capacity (including how well people can prepare for, respond to, and recover from exposure to potentially harmful hazards). People in poor health are more susceptible to further heath impacts when exposed to a climate-related hazard. For example, exposure to flooding can make pre-existing conditions worse or make treatment difficult due to power cuts. Some pre-existing conditions (or the medicine used to treat them) may make people more sensitive to the effects of air pollution and high temperatures (e.g., dehydration, ability to sweat and exacerbate symptoms such as cardiovascular disease).
Social vulnerability has various drivers across Scotland. Low income, ill-health, property tenure (particularly social housing) and a lack of local knowledge (either due to issues of language or relatively poor internet access) as well as biophysical sensitivities due to household composition (physical mobility, younger children, and older adults) influence vulnerability to all three hazards. Consequently, many of the neighbourhoods most socially vulnerable to one hazard are also often vulnerable to the others.
#Finding-1 Key drivers of social vulnerability are associated with vulnerability to climate-related hazards across Scotland
Low income and poor health are strong drivers of social vulnerability to all three selected climate-related hazards (flooding, high temperature and poor air quality). Both tend to be associated with neighbourhoods with a high proportion of people living in rented accommodation, particularly social housing. A lack of local knowledge and biophysical sensitivities, such as reduced physical mobility, younger children, or older adults, also importance contributors to social vulnerability across all three hazards.
#Finding-2 In rural areas, access to the internet and isolation heighten social vulnerability to climate-related hazards
Across rural communities, limited internet access restricts access to information and support services and combine with social and physical isolation to have a strong influence on social vulnerability to all three hazards. Low mobility (linked to indicators of physical disability, residential care, and restricted access to private transport) are also important influences. Restricted mobility, for example, makes it more difficult to access local services such as GP practices and hospitals, install or deploy household level adaptations, such as flood gates, and access alternative accommodation or remote services, such as access to GPs and hospitals.
#Finding-3 In urban areas, social vulnerability to climate-related hazards is driven by multiple factors in particular income and property tenure
In urban settings, poor health, income deprivation, high levels of social and private renting, lack of local knowledge and limited mobility are all important contributors to social vulnerability. People living on lower incomes and in rented accommodation are also less likely to have access to flood insurance and have more limited capacity to appropriately prepare for, and recover from, flood events. This includes, for example, taking action to adapt their homes.
Drivers of social vulnerability to each hazard
Despite the many shared drivers of social vulnerability across the three selected hazards, there are differences. The following summarises the most important drivers of social vulnerability for each hazard in turn.
- Flooding: Social vulnerability is often driven by a combination of poor health and constraints on adaptive capacity (due to low income, property tenure and mobility). Income and tenure affect the extent to which people can prepare for, respond to, and recover from events (including their ability to purchase household insurance) make property adaptations or have autonomy over other aspects of adaptation. Restricted personal mobility (linked to indicators of disability, residents in care, and private transport availability) makes it difficult to deploy property level adaptations (e.g., flood gates), move personal items or respond to post-flood challenges, such as changes in accommodation or services. If public services are affected by flooding at the same time, access to services (e.g., GP practices, hospitals etc) can be lost or delayed (with potential loss of access to important medication).
- Air quality: Social vulnerability to poor air quality tends to be associated with neighbourhoods where lower incomes and more limited local knowledge relating to poor air quality (e.g., due to limited internet access) combine to limit the capacity of households prepare for, and recover from, events as well as adapt to future conditions. However, our knowledge of the factors influencing indoor air quality is currently limited, and more work is needed to improve our understanding of these interactions.
- Heat (high temperatures): Income and local knowledge are most influential across Scotland in determining social vulnerability to heat. These drivers combine to undermine adaptive capacity by limiting the available resources for people to adapt their homes, access information about the dangers of excess heat in their homes, and access help during heat-wave events. Biophysical sensitivity due to health and age are important across all hazards, but they are critical influences on social vulnerability to high temperatures.
Geographic and systematic disadvantage
In responding to the research questions of ‘Which groups are at the greatest social risk from climate related hazards, now and in the future?’ and ‘To what extent are the most socially vulnerable disproportionately impacted by climate-related hazards?‘ the research highlights that climate-related risks vary across Scotland (now and in the future). In some settings, and for some hazards, the most socially vulnerable face risks greater than the less vulnerable. These findings are summarised below.
#Finding-4 Challenges vary across local authorities
In Glasgow, 84% of neighbourhoods are classified as being among Scotland’s 20% most high heat disadvantaged, the greatest proportion of any Local Authority. The combination of social vulnerability and exposure to climate-related hazards mean Glasgow is similarly disadvantaged with respect to flooding and below average air quality.
In general, local authorities experiencing the greatest disadvantage will continue to do so in the future. Climate change does not, however, always increase risk in a uniform way but reflects the changing pattern of each hazard. For example, the relative proportion of neighbourhoods experiencing the most significant social risk from heat is projected to reduce in the future in Falkirk but increase in Dundee City.
#Finding-5 People living in rural settings tend to be more flood disadvantaged than those living in urban areas
People living in rural areas, on average, are subject to greater flood risk than those living in larger urban areas; particularly those living in remote and very remote small towns, and accessible rural areas. This reflects social factors (such as isolation, limited access to remote services, and limited social networks) as well as exposure to more frequent flooding than those living in urban areas (on average).
Social vulnerability to other hazards is also often high in rural areas. In the context of heat and air quality disadvantages this reflects the more limited internet coverage in rural areas compared to urban areas and consequently a greater difficultly accessing information. The exposure to high temperatures and below average air quality is often lower in rural areas than in urban areas and hence the associated risks are less. As the climate changes, however, many rural neighbourhoods are projected to experience above average high temperatures. This is particularly the case in accessible rural areas settlements.
#Finding-6 Urban settings present a concentration of disadvantage
Within urban settings the most socially vulnerable tend to experience higher disadvantage to heat and air quality. This is partly due to higher exposure in these settings. For example, the most socially vulnerable neighbourhoods in large urban areas are three times more likely to be exposed to high temperatures than others, and 50% more likely to be exposed to below average air quality. The differential in air quality between rural and urban settings tends to reflect higher levels of nitrogen dioxide (NO2). If planned reductions in NO2 emissions are realised this particular risk is projected to decrease.
The standard of protection against flooding tends to be higher in urban areas than in rural, however the exposed population is much larger, particularly in large urban areas and other urban areas settings. This leads to a greater number of people experiencing flood disadvantage in urban settings compared to rural areas (when considered in aggregate).
#Finding-7 black ethnic groups face the greatest geographic disadvantage
Black ethnic groups tend to experience higher risk than any other ethnic group, particularly in relation to poor air quality. For example, people in black ethnic groups are more than three times as likely to be exposed to above average concentrations of air pollution than people in white ethnic groups. Flood and high temperature related risks faced by people in black ethnic groups are also projected to increase more rapidly with climate change than for any other ethnic groups (although the rise is significant for all).
Projected improvements in air quality, if realised, would lead to a significant reduction in the number of people exposed to above average concentrations of nitrogen dioxide (NO2) air pollution across all ethnic groups (using present-day average concentrations as a threshold). This is not the case for those exposed to above average PM10 concentrations. By 2030 people in black and other minority ethnic groups will remain disproportionately exposed to above average levels of air pollution. Flood disadvantage is projected to increase for all ethnicities as the climate changes, but black ethnic groups are projected to experience the most rapid rise (as expressed through changes in expected annual damages).
#Finding-8 – The most socially vulnerable within white ethnic groups experience the greatest systemic disadvantage from flooding
The difference between the risks faced by the most socially vulnerable neighbourhoods and others within the same ethnic group is greatest amongst white ethnic groups. This reflects the greater inequalities within the white ethnic groups compared to others around household incomes and household tenure. Lower household incomes and living in socially rented accommodation tend to limit access to insurance and increase the Relative Economic Pain (REP)[7] associated with flooding and constrain the degree of autonomy over other aspects of adaptation, including household modifications.
Implications for enabling a just transition to climate change
The findings of the research have three central implications for enabling a just transition:
Recognising intersectionality in the underlying drivers of social vulnerability
Many of the most important drivers of social vulnerability affect vulnerability to all hazards considered here – flooding, high temperatures, and poor air quality. Recognising this intersectionality in social vulnerability presents an opportunity to enhance resilience to multiple climate hazards through targeted adaptation. This includes improving access to support and information services (including, for example, internet coverage, income, and tenure).
Enabling adaptive capacity
Climate-related disadvantage is often driven by a limited capacity to appropriately prepare for, and recover from, hazard events. Strengthening these capacities is central to reducing disadvantage. This includes, for example, supporting better access to flood insurance for those living in socially and privately rented accommodation with lower incomes, and addressing the disparities in internet access between rural and urban areas. Supporting the most socially vulnerable to make property-level adaptations, including those in rented accommodation, would also reduce negative welfare outcomes when exposed to a hazard.
Facilitating investments that reduce risk for the most socially vulnerable
Sound evidence on disadvantage is a prerequisite to shaping policy levers, guidance and funding arrangements that facilitate a just transition. The response will necessarily be multi-faceted involving actors operating at different levels. To achieve this, consideration will need to be given to how to address geographic and system disadvantage through multiple policy levers, including funding mechanisms and planning approaches.
Research needs
The presented analysis necessarily includes several assumptions. These include uncertainty in climate hazards (now and how they may change in the future) and adaptation choices that may be made. There is also uncertainty in our understanding of social vulnerability. Opportunities to improve both the methods and the data to refine the results and insights should be considered. Where possible this should include validation at a local level to support the national scale analysis and associated findings presented here. Developing a nuanced understanding of local characteristics and contexts developed through such an exercise would help interpret findings presented here.
Consideration should be given to updating the analysis presented here in the coming years. Updated Census data and advances in hazard mapping, for example, are all planned in the coming few years (e.g., relating to flooding this includes updates to surface water and fluvial assessment and at the coast through initiatives such as the Dynamic Coast). Such advances should be incorporated in any future update.
References
Adger, W.N. and Kelly, P.M., 1999. Social vulnerability to climate change and the architecture of entitlements. Mitigation and adaptation strategies for global change, 4(3), pp.253-266.
CCC – Committee on Climate Change (2021) Independent assessment for Scotland: The third Climate Change Risk Assessment https://www.ukclimaterisk.org/wp-content/uploads/2021/06/CCRA-Evidence-Report-Scotland-Summary-Final-1.pdf
Dale M., Gill E. J. Kendon, E. J, Fowler, H. J. (2017). Are you prepared for future rainfall? Results from the UKWIR rainfall intensity project. Conference paper to the CIWEM Urban Drainage Group
EEA – European Environment Agency (2017) Climate Change impacts and vulnerability in Europe: An indicator-based report. Copenhagen: European Environment Agency
GI-SAT (2011) Scottish Government Geographic Information Science and Analysis Team. Evaluation of the Data Zone Geography. Report available at http://www.scotland.gov.uk/Resource/Doc/933/0120159.pdf. Last accessed March 2013.
Gouldby, B. P., Wyncoll, D., Panzeri, M., Franklin, M., Hunt, T., Hames, D., Tozer, N. P., Hawkes, P. J., Dornbusch, U. and Pullen, T. A. (2017) Multivariate extreme value modelling of sea conditions around the coast of England. Proceedings of the Institution of Civil Engineers – Maritime Engineering, 170 (1). pp. 3-20.
Kay, A. L., Rudd, A. C., Fry, M. and Nash, G. (2020). Climate change and fluvial flood peaks. Report to Environment Agency/Scottish Environment Protection Agency, SC150009 WP2 Final Report, UKCEH, 65pp. + Appendix (27pp.) In review.
Kennedy-Asser, A.T., Andrews, O., Mitchell, D.M. and Warren, R.F., 2021. Evaluating heat extremes in the UK Climate Projections (UKCP18). Environmental Research Letters, 16(1), p.014039.
Kazmierczak, A., Cavan, G., Connelly, A. and Lindley, S. (2015) Mapping Flood Disadvantage in Scotland 2015. The Scottish Government.
Lindley, S. J., O‟Neill, J., Kandeh, J., Lawson, N., Christian, R., and O’Neill., M (2011) Climate change, justice, and vulnerability. Joseph Rowntree Foundation, www.jrf.org.uk
Palmer, M. D., Howard, T., Tinker, J., Lowe, J. A., Bricheno, L., Calvert, D., Edwards, T., Gregory, J., Harris, G., Krijnen, J. & Roberts, C. (2018) UKCP18 Marine Report.
Sayers, PB., Horritt, M, Carr, S, Kay, A, and Mauz, J (2020) Third UK Climate Change Risk Assessment (CCRA3): Future flood risk. Research undertaken by Sayers and Partners for the Committee on Climate Change (using the Future Flood Explorer). Published by Sayers and Partners and the Committee on Climate Change, London
Sayers PB., Carr S., Moss C., and Didcock A. (2020) Flood disadvantage – Socially vulnerable and ethnic minorities. Research undertaken by Sayers and Partners for Flood Re. Published by Sayers and Partners (SPL), London.
Sayers PB, Horritt M, Penning Rowsell E, and Fieth J (2017). Present and future flood vulnerability, risk, and disadvantage: a UK assessment. A report for the Joseph Rowntree Foundation published by Sayers and Partners LLP. Accessible here http://www.sayersandpartners.co.uk/flood-disadvantage.html
Scottish Government (2020). Fourth National Planning Framework: Position statement. www.gov.scot
Scottish Government (2019b). Second Scottish Climate Change Adaptation Programme-2019-2024 (www.gov.scot)
Scottish Government (2019a). Climate Change (Emissions Reduction Targets) (Scotland) Act 2019. https://www.legislation.gov.uk/asp/2019/15/enacted
Scottish Government (2018). Scottish Government Urban Rural Classification 2016. Scottish Government Urban Rural Classification 2016 – gov.scot (www.gov.scot)
Tapsell, S., McCarthy, S., Faulkner, H. and Alexander, M., 2010. Social vulnerability to natural hazards. State of the art report from CapHaz-Net’s WP4. London.
Appendix 1 – Rationale of the selection of priority risks
Introduction
The Independent Assessment[8] of evidence for Scotland undertaken for the third UK Climate Change Risk Assessment (CCRA3), highlights a range of climate risks and identifies the urgency scores for twenty-five risks from climate change in Scotland which have increased since the previous CCRA five years ago. Flood-related risks remain the number one priority for action, with water scarcity and impacts on the natural environment also highlighted. Under Health, Communities, and the Built Environment there are thirteen identified climate risks and opportunities. Both high temperatures and interactions of high temperatures with other impacts (for example air quality) are highlighted as important issues. Other climate risks are expected, including from coastal erosion as being considered through other research activity, e.g., Dynamic Coast Scotland[9]. High temperature events are frequently associated with episodic air pollution and there are complex interactions with other risks such as wildfire.1 These impacts are known to cascade into risks associated with health and care delivery, due to additional stresses such as hospital admissions.
Addressing these issues is a significant adaptation challenge but remains central to achieving aims set out in the Scottish Climate Change Adaptation Programme 2019-2024 (SCCAP2), i.e., to ensure that the people in Scotland who are most socially vulnerable can adapt and have their risks appropriately managed and in a just manner.
Selection process
The research report here uses the evidence presented in documents introduced above and knowledge of data and tools readily available to the research team to selected three priority hazards. Based on this process the research focuses on risks related to heat, air quality and flooding. The evidence to support this focus is elaborated below.
Prioritising heat-related risks for assessment
Historically, policy in Scotland has centred on the mitigation of health impacts from cold temperatures and excess winter deaths. The potential impacts of high temperatures therefore represent something of a hidden risk and one which is not at the forefront of action. Previous studies have used existing thresholds for NE England to characterise heatwaves in the context of southern Scotland. This analysis (Figure A1) shows the rising trends in extreme daytime and night-time temperatures projected through both UKCP09 and subsequent UKCP18 climate projection data. The impacts of heatwaves and high temperatures are felt through several sectors. They include impacts on infrastructure such as transport and energy in addition to direct consequences for human health and wellbeing. Changes in temperature regimes also affect energy demand with different seasonal patterns predicted.
Met Office records shows that extremely high temperatures are already occurring, for instance maximum recorded temperatures of 31.9°C (recorded in Bishopton, 28th June 2018)[10]. The number of heat-wave events is expected to increase, but it is not only temperatures which should be considered. Patterns of exposure relate to aspects of the built environment, with levels of harm being influenced by individual health and demographic characteristics together with wider community contexts. It is these latter characteristics that assessments of vulnerability help to reveal. Estimates suggest that heat-related deaths in Scotland are likely to range from 70-285 per year by 2050 and grow to 140-390 per year by the 2080s. Based on analyses of past events[11],[12], impacts are likely to primarily affect older demographic groups, especially those with multiple health issues and disadvantages.[13] Excess heat-wave deaths are more prevalent in urban locations compared to rural locations due to the Urban Heat Island effect[14].


Figure A1: Trends in heatwave frequency projected for Scotland[15].
Heatwave related excess deaths should also be considered alongside the benefits of less severe winters and the potential for increased physical activity and higher Vitamin D exposure, each of which are reported to bring health and wellbeing benefits from temperature increases.2 For instance, evidence suggests that between 1989 and 2001 there were 51,600 Scottish excess winter deaths primarily affecting people over 65 years of age[16]. Measures to reduce cold-weather related deaths and tackle issues of fuel-poverty have been important adaptations stretching over many decades. However, there are increasing concerns about the potential detrimental effects of ‘super-insulated’ buildings in the context of summer heat-wave events. High levels of over-heating have been recorded in new-build homes across Scotland, with exceedance of 25 degrees C (as a recognised threshold in the UK government’s Housing Health and Safety Rating System (HHSRS))[17]. Although inevitably related to ambient temperatures, over-heating is as much – if not more – related to building design and use of properties by occupants. While some occupants express a preference for over-heated conditions, this does not mitigate the potential for health-related impacts and there is also the potential for impacts on carbon mitigation agendas, through increased demand for air conditioning. In this context, it is also notable that between 1999 and 2009 Glasgow city Council have recorded a higher proportion of severe weather events associated with unreasonably high temperatures (11%) than unreasonably low temperatures (10%).3,[18]
Conclusion – to include heat as one of the three priority hazards
Prioritising flood-related risks for assessment
The risk of flooding to people, communities and buildings is one of the most severe risks from climate hazards for the population, both now and in the future. This risk encompasses flooding from all sources, particularly rivers (fluvial), the sea (coastal) and surface water (pluvial) flooding; the 2018 National Flood Risk Assessment for Scotland, for example, estimates that 284,000 properties are at risk of flooding (1:200-year return period) today. Recent analysis for the UKCCRA3 confirms that the most socially vulnerable experience disproportionate flood risks today and in some settings their disadvantage increases in the future (Sayers et al, 2020). Analysis for Flood Re highlights the low uptake of insurance by the most socially vulnerable across the UK (including in Scotland) and the disproportionate risks faced by some ethnic minorities[19]. This analysis reinforces our work for the Joseph Rowntree Foundation (JRF) in 2015-17[20].
These studies highlight that flooding to people, communities and buildings remains among the most severe climate-related risks for Scotland with flood disadvantage experienced by socially vulnerable communities particularly in some coastal areas, declining urban cities, and dispersed rural communities. The previous work has highlighted that flood disadvantaged communities exist across Scotland. Glasgow and the wider City-region experience significant disadvantage.
The Position Statement on the Scotland’s fourth National Planning Framework[21] highlights flooding as a particular adaptation focus. The statement commits to more action to: reduce a communities’ exposure to flooding by future-proofing the design of the built environment and investing in green infrastructure; promoting natural flood risk management and strengthening policies on the water environment and drainage infrastructure; restricting development in flood risk areas; adapting existing infrastructure where climate change may increase vulnerability to flooding; and placing greater importance on flood risk management and coastal protection and the interface between planning on land and at sea. The statement also re-iterates commitments to socially just transitions which tailor responses according to the specific needs of climate vulnerable communities within a framework of place-based actions which enhance the quality of places, improve health and wellbeing, and reduce geographic disadvantage.
Conclusion – to include flood as one of the three priority hazards.
Note: As part of the CCRA3 analysis decreases are shown in the numbers of people at significant risk of river flooding in the 2050s and 2080s for Scotland in the low population scenario. This is due to estimated decreases in population in some areas rather than the influence of climate change. To avoid confusion, population change (in demographics or growth) is excluded here.
Air quality as a priority risk
There are clear social justice dimensions to the distribution of air quality impacts across Scotland, even without considering future climate change. For instance, a ranking exercise carried out with stakeholders from government, activist groups, community organisations and academia identified air pollution as the top concern for distributive environmental justice in Scotland[22]. In the context of high variability in pollution concentrations, there have been calls to consider both concentrations and patterns of population vulnerability when prioritising interventions like Low Emissions Zones.[23]
Air quality is a function of emissions characteristics and meteorological conditions, and so estimating future changes is particularly challenging[24]. In a similar way to heat waves, health burdens from air pollution are not solely due to concentrations but also the type and nature of human exposure (e.g., exposure to extreme events, exposure at rest or during exercise, or due to aspects of the built environment which enhance or offset pollution levels) and underlying susceptibility to negative effects, such as pre-existing respiratory disease. There is thus a vulnerability component to negative health outcomes. Greater harms can be expected where there is underlying biophysical sensitivity, enhanced exposure and factors which inhibit adaptive capacity.
Emissions scenarios underpinning climate projections are not only indicative of carbon emissions but also a range of other pollutants with the potential to cause future health burdens. However, health-related air pollutants are also subject to regulatory control. It is estimated that all Representative Concentration Pathways (RCPs) are associated with large emissions reductions in particulate matter (PM) and in the precursors of ozone (O3), including nitrogen oxides (NOx)[25]. Projections of ozone concentrations – as the dominant hazard linked to climate change2 – are open to considerable debate and trajectories depend on scenarios and trends in other pollutants, such as methane. This uncertainty means that ozone cannot be considered in the current study. Furthermore, health burdens depend on demographic and social characteristics and how they change into the future, both of which are also out of scope in the current study. One study estimated that the UK’s ozone-related health impacts could rise by 16–28% between 2003 and 2030 if factoring in socio-economic change[26] though analyses suggest substantial falls in mortality related to nitrogen dioxide and fine particulates (PM2.5) with around 6.5 million life-years and 17.8 million life-years gained by 2050 compared to a 2011 baseline[27].
Air quality episodes with elevated concentrations of air pollutants can lead to a range of chronic and acute diseases, evidenced by health outcomes which include increased hospital admissions and excess morbidity and mortality rates. The stagnation weather events associated with air quality episodes can also be associated with summer heatwaves and therefore have cumulative outcomes for human health.[28] Nevertheless, evidence suggests that recent heatwaves in Scotland have not been associated with very high O3 concentrations.2 Indoor concentrations are strongly linked to building type and use (e.g., fuel types) and other behavioural influences (e.g., smoking). As with heatwave impacts, trends towards more insulated buildings could increase risks from these sources since this reduces ventilation (ibid.). The Scotland CCRA3 summary has identified air quality as requiring further investigation which may suggest it is not an immediate priority for the current project. However, despite uncertainties, understanding risks associated with poor air quality could make a useful contribution given synergies with vulnerability factors held in common with heat-related risk. It is currently only practicable to analyse PM10 and NO2 for this study, and using available projections, i.e., which focus on expected changes in air pollutant emissions only.
Conclusion – to include air quality as one of the three priority hazards.
Other climate related risk that could be considered in future assessments
The CCRA3 summary for Scotland identifies several other risks that should be given further attention. They include several that relate to social issues:
Changes the natural environment, including terrestrial, freshwater, coastal and marine species, forests, and agriculture – this has a clear social justice connection, linking those that rely on natural environments (fishing and agricultural, forestry etc) and the groups that may be more or less able to adapt the potential changes. Disruption to the natural environment influences the prevalence and distributions of pests and influences patterns of food- and water-borne disease and contamination. The degree of exposure is in turn influenced by occupational and recreational behaviour making future population risks very challenging to estimate. On balance exposure to the natural environment is widely recognised to be of net benefit for human populations[29]. Indeed, the lack of greenspaces in many urban areas is a core issue of distributive justice in the present-day.[30] Population health is affected by changes to the natural environment, including terrestrial, freshwater, coastal and marine species, forests, and agriculture. However, analysis of residential risks from changes in these sectors are highly complex and their assessment would require further primary research to develop appropriate metrics and models. These risks are therefore not considered priority risks within the scope of this investigation but are discussed below for context.
Changes in coastal erosion – To some extent this is already covered by the recent Dynamic coast Studies but could be usefully extended to consider those communities that may come under increasing pressure for realignment/relocation (as a similar study is underway in England, Sayers et al in press) to address the associated challenge of ‘the viability of coastal communities and the impact on coastal businesses due to sea level rise, coastal flooding and erosion’. Relocation has clear social justice considerations but is not considered a priority over those risks identified for this investigation.
Changes in high winds, moisture and driving rain: highlighted by the CCRA3 these changes are primarily concerned with homes and costs to households, resulting from damage to dwellings. Damp buildings cause harm to health and wellbeing, and damage to dwellings from high winds can also risk injury, but the CCRA3 suggests there is some evidence contained in the assessment that indicates that the vulnerability of the Scottish housing stock to extreme wind and rain is declining. However, this is not considered a priority risk in scope for the investigation here.
Changes in vector borne disease: Some diseases transmitted by insects and ticks (vectors) are likely to change in prevalence in the future due to warmer temperatures changing the distribution of the vector in the UK as well as diseases acquired by people overseas and being brought back into the UK; although in Scotland, the future magnitude of risk from vector-borne diseases due to climate change is medium. This is not considered a priority risk here and this area is a subject of ongoing research.[31]
Changes in household water quality and supply: Reduced summer precipitation resulting from climate change is likely to increase periods of water scarcity and droughts. This may lead to interruptions of household water supplies and associated health, social and economic impacts, particularly for vulnerable households. Private water supplies are most vulnerable to current and future climate hazards that affect water quality (outbreaks) and quantity (interruption of supply) and are particularly important for more isolated communities. Climate change may also increase the risk of contamination of drinking water through increased runoff and flooding events that overwhelm current water treatment approaches. Sea level rise, heavy rainfall, and coastal erosion can increase pollution from historical landfills. There are specific concerns around this issue in Scotland, mainly in relation to Private Water Supplies (PWS), which are those not regulated or supplied by Scottish Water, which are more commonly located in remote and rural communities in Scotland. There is ongoing research by Scotland’s Centre of Expertise for Waters to make PWS more resilient to drought in the future and overall, the CCRA3 assessed the associated risks as low today rising to medium in future. This is not considered a priority risk here.
Appendix 2 – Social vulnerability indicators and indices
Social vulnerability indicators
The indicators used to assess social vulnerability across the three prioritised hazards are summarised in the Table below together with a brief rationale for their inclusion. More detailed discussion can be found in the various supporting references cited. Unless otherwise indicated, all data were sourced from https://www.statistics.gov.scot/, or the Scottish Index of Multiple Deprivation 2020 (https://www.gov.scot/publications/simd-2020-technical-notes/)
Table A2-1 Social vulnerability indicators
|
Domain |
Indicator |
Rationale |
Summary metric |
|
Age |
Young Children |
Young children are more susceptible to harms from a range of environmental hazards. There is extensive evidence from analyses of past events, and wider academic research. Evidence is available for stress from hot weather via Climate Just Young children and babies | Climate Just |
% People under 5 years old |
|
Older Adults |
Not all older people are socially vulnerable, However, older people may be more likely to experience detrimental physical impacts during periods of high temperatures, e.g., due to inhibited ability for thermo-regulation and dehydration. This may exacerbate existing ill-health. Similar evidence exists with respect to poor air quality, with the potential for poor air quality and high temperatures to be experienced concurrently. Older people | Climate Just |
% People over 75 years old | |
|
Health |
People in long-term ill-health |
The long-term sick are more vulnerable to flooding, the flood they experienced often making their pre-existing condition worse either as a one-off ‘hit’ or accelerating its adverse trajectory (discussed in Sayers et al., 2017). |
% People whose day- to-day activities are limited |
|
Households with members in ill-health |
Flooding may prevent the use of complex home-based health care systems, for example home dialysis, due to direct flood damage or to loss of power (discussed in Sayers et al., 2017). |
% Households with at least one person with long-term limiting illness | |
|
Emergency hospital admissions |
Some conditions and illnesses (or the medicine used to treat them) make people more sensitive to the effects of air pollution and high temperatures, e.g., dehydration, ability to sweat and exacerbate symptoms, e.g., cardiovascular disease. Some illnesses are associated with acute symptoms and hospital admissions, while others might not People in poor health | Climate Just |
Emergency stays in hospital (index) | |
|
Disability and Ill-health |
Comparative illness factor (index) | ||
|
Mood and Anxiety Disorders |
Some mental health disorders affect people’s ability to self-regulate to avoid environmental hazards or recognise and take effective precautions against symptoms caused or aggravated by environmental hazards. In some cases, medicines used may also increase susceptibility to effects, e.g., of heat stress (Page et al, 2012).[32] People in poor health | Climate Just |
Population prescribed drugs for anxiety, depression, or psychosis | |
|
Medical and Care Residents |
People living in medical and care establishments may have greater dependencies because of health-related factors. People in poor health | Climate Just |
% Living in medical and care establishments | |
|
Low birthweight |
Babies with low birthweight are susceptible to a range of health effects which can be exacerbated by exposure to high temperatures and poor air quality. Furthermore heat, air quality and other environmental stressors are also a cause of low birthweight due to impacts on pregnant women (Dadvand et al, 2014). [33] |
Proportion of live singleton births of low birth weight | |
|
Income |
Unemployment |
Low-income households are less likely to have the capacity to fully prepare for future floods (through insurance and property level measures). The NFVI uses a combination of income metrics to represent this important influence. The indices used to assess social vulnerability to high temperatures and poor air quality also use a range of income factors (see following section). |
% Unemployed |
|
Long-term unemployment |
% long-term unemployed or who have never worked | ||
|
Low-income occupations |
% in routine or semi- routine occupations | ||
|
Households with dependent children and no |
% Households with dependent children and no adults in employment | ||
|
Employment Deprivation |
People on low incomes have reduced adaptive capacity to high temperatures and poor air quality, e.g., have fewer choices in terms of goods and services, and they may also suffer lower self-esteem, engage less with others (e.g., via support networks) and experience higher levels of stress and anxiety. Employment deprivation is a distinctive measure of lower income which accounts for the proportion of working age people who are involuntarily excluded from paid employment, due to lack of opportunities, ill-health and disability or caring responsibilities. |
Score | |
|
Income Deprivation |
Income deprivation is a direct measure of people who are expected to be negatively impacted due to unemployment or who have low earnings. There are a range of associations between income and other factors which reduce adaptive capacity to high temperatures and poor air quality, some of which cannot be directly measured at neighbourhood level such as engagement with public organisations People on low incomes | Climate Just |
Score | |
|
Average Household Income |
Average household income is included as a relative measure of resources that households may have to support adaptation to high temperatures and poor air quality, for instance ability to adapt homes, access to private transport etc. People on low incomes | Climate Just |
Pounds | |
|
Information use |
Recent arrivals |
Higher proportions of people recently arrived from outside an area indicate a higher vulnerability as they are more likely to have difficulty obtaining and using information and guidance provided to the public. |
% People with <1 year residency coming from outside UK |
|
English Proficiency |
Relatively poor proficiency in English restricts people’s ability to prepare for, respond to and recover from events with the capacity to cause harm because it restricts knowledge of and access to information and support services. |
% People who do not speak English well | |
|
Internet |
Sub-standard Broadband |
The internet is an increasingly important means of supplying and receiving information about public authorities and services, for obtaining goods and services and for communicating with others (ONS, 2019). [34] However, its availability, reliability and accessibility varies across Scotland. Furthermore, the internet, like other critical infrastructure, can also be impacted by some events, like high temperatures or extreme weather.[35] The Universal Service Obligation relates to average household requirements, assumed to be download speeds >10Mbps and upload speeds of 1Mbps. Areas with poorer internet may also have less well-developed infrastructure for other key sectors, e.g., mobile communications, transport, and energy. |
% premises below the Universal Service Obligation (USO) (Ofcom, 2018) |
|
Lack of Superfast Broadband |
Better connection speeds allow more rapid access to information, goods and services and social networks. This is important given the increasing reliance on online information, especially during periods where demand is high. Internet accessibility is also important for business sectors and for employees working from home. |
Percentage of premises without access to superfast broadband | |
|
Local knowledge |
Population Transience |
In places with high amounts of population turnover there is the potential for higher vulnerability due to lack of knowledge of hazards, health and support services and social networks. Such areas are more likely to be characterised by rented accommodation and in some cases insecure employment. These factors affect the capacity for preparing for, responding to, and recovering from environmental hazards like high temperatures. |
% HHs which appear to have changed occupier (2012-2020) [36] |
|
New migrants |
People who have recently moved into an area may lack awareness of local flood risk provided through family and community clues. | ||
|
Tenure |
Social renting |
Social renters are less able to prepare for extreme weather events, for example due to inability to modify their homes to prepare for heatwaves or account for poor air quality. Property maintenance and adaptation is normally the responsibility of the property owner although in the case of some social tenants social renting may also provide opportunities for adaptation. Tenants in social housing are likely to have a range of other characteristics which increase vulnerability Tenants in social or private rented housing: who are we concerned about? | Climate Just |
% Social rented households |
|
Tenure |
Private renting |
Private renters represent a very broad group and not all are equally socially vulnerable. However, on average private renters are less able to prepare for extreme weather events, for example due to inability to modify their homes to prepare for heatwaves or account for poor air quality. Property maintenance and adaptation such as insultation and ventilation is normally the responsibility of the property owner. Renters may also be more transient and therefore less familiar with local neighbourhoods, environmental hazards, and sources of support Tenants in social or private rented housing: who are we concerned about? | Climate Just |
% Private rented households (historical reference) |
|
Direct flood experience |
Households exposed to significant risk |
A large body of research shows that those with experience of flooding are less vulnerable in subsequent events as they have more knowledge as to what to do and how to respond. Flood experience has often been shown to be a key factor in level of willingness to take preventative action against future floods and respond seriously to warnings. | |
|
Crime |
Crime Rates |
People living in high crime (or perceived high crime) areas may have reduced adaptive capacity during high temperature events due to an unwillingness to leave windows open at night. There is also a connection between crime and income, and income and security measures. Who are we concerned about? | Climate Just |
Crime rate per 10,000 population |
|
Mobility |
Disability and Ill-health |
People with disabilities or poor health are more likely to have reduced mobility and/or be reliant on others to assist them during extreme events, e.g., if they have symptoms of heat stress or acute adverse effects due to poor air quality. Even if people are relatively independent in normal times, there may be additional pressures if infrastructure is impacted, e.g., power cuts, internet, or mobile networks. People with low personal mobility | Climate Just |
Comparative illness factor (index) |
|
Medical and Care Residents |
People living in medical and care establishments may have greater dependencies because of health-related factors. As well as making people generally more susceptible to negative effects, there are also more likely to be low mobility and additional needs in relation to responding to and recovering from environmental stresses like high temperatures and poor air quality. People with low personal mobility | Climate Just |
% Living in medical and care establishments | |
|
Private Transport ownership |
People with access to private transport have increased adaptive capacity as they have more flexibility to cope with impacts which may result from extreme events and environmental hazards, for instance helping immediate family or the local community access health or other support services, or handling changes due to transport problems during periods of extreme heat. |
% Households with no car or van | |
|
Accessibility by bus |
In areas with low public transport provision, it may be more difficult for people to cope during and after events like heat waves, or if immediate family is affected by symptoms aggravated by poor air quality. More physically isolated areas may also be associated with other factors which increase vulnerability (Preston et al., 2014[37]). |
Bus Accessibility | |
|
Social networks |
Single Pensioner Households |
Socially isolated people may have restricted adaptive capacity because of a lower ability to seek and receive help if negatively affected by heat or poor air quality. For instance, a sample of approximately half of 919 people who died at home during the 2003 heat wave in Paris showed that 92% of them lived alone and social service records for 383 indicated that a quarter had no social ties (Poumadère et al., 2005). [38] Other studies have shown that those with social ties have lower risk of death, were more likely to take remedial measures and to have support networks for recovery. Single pensioner households may be particularly vulnerable due to a greater chance of other factors such as older age and ill-health, all other things being equal. |
% Single pensioner households |
|
Primary School networks |
Social ties are generally greater in some sub- sections of society meaning that information and support networks developed as part of everyday life vary. People with primary school children are one such group since connections between children and between parents of young children (e.g., through school related activities) are likely to be stronger on average (Kazmierczak et al., 2015). [39] During and after extreme event trusted social networks may enable greater adaptive capacity, e.g., through information sharing, support and sharing resources. People who are socially isolated | Climate Just |
% Children not of primary school age | |
|
Civil Organisations |
The presence of charities and other voluntary organisations in an area is one indicator of social networks and civil society. Such networks facilitate greater social engagement and participation which provide more potential for information, sharing of resources and wider support. People in neighbourhoods with these networks are less likely to be socially isolated, and people who are socially or physically isolated may also benefit because of activities of these organisations. People who are socially isolated | Climate Just |
Per capita rate of registered local civil organisations (Rutherford and Brook, 2018) [40] | |
|
Single Adult Households |
Living alone is not necessarily an indicator of social isolation, there are however several reasons why single adult households may be more vulnerable, including because of the potential for poorer social networks especially following traumatic life events. Furthermore, people in single households may have fewer resources and more precarity. [41]People who are socially isolated | Climate Just |
% Single adult households | |
|
Lone parent households |
These households face practical difficulties in responding to a flood where children are dependent on them as there is less direct within-the-family support. |
% Lone-parent households with dependent children | |
|
Health Service access |
Accessibility of Pharmacies |
People living in areas which are more physically isolated from health services are less likely to be able to access health services, medical help, or medicines quickly if experiencing heat stress or the effects of poor air quality. They are also less likely to use such services (Ensor, 2004). [42]Fortunately, more physically isolated areas tend to have cooler temperatures and better air quality, although residents may be affected by relatively low temperatures compared to people adapted to warmer environments. This situation is reflected in the differences with heat health warning thresholds across the UK. |
Accessibility of Pharmacies (Daras et al., 2019) [43] |
|
Accessibility of Hospitals |
Accessibility of Hospitals | ||
|
Travel time to GP surgery (private transport) |
Travel time to GP surgery (private transport) (mins) | ||
|
Travel time to GP surgery (public transport) |
Travel time to GP surgery (public transport) (mins) | ||
|
Service availability |
Emergency services exposed to flooding |
Various studies highlight the link between the degree of support provided by institutional (such as the police, the fire brigade, ambulances, and local authority social care) and community support networks and the vulnerability of the individuals in those communities. These linkages are discussed in Sayers et al, 2017 |
% of emergency services exposed to flooding |
|
Care homes exposed to flooding |
% no. of care homes exposed to flooding | ||
|
GP surgeries exposed to flooding |
% no. of GP surgeries exposed to flooding | ||
|
Schools exposed to flooding |
% no. of schools exposed to flooding | ||
|
Housing characteristics |
Over-crowding |
Densely populated locations and over-crowded households are indicators of where temperatures may be elevated indoors. There is also evidence for poorer health in residents living in crowded accommodation (Public Health Scotland, 2021). [44] |
% of people in over-crowded households |
|
High Rise Flat indicator |
High rise flats are well known to be associated with elevated temperatures during heat-wave events (Taylor et al., 2015). [45] Analyses of past events demonstrate increased mortality in these building types. Modelling suggests that the degree of enhanced exposure depends on a range of factors such as building orientation, insulation, ventilation and building use (DCLG, 2012). [46] |
Count of flats without gardens (Proxy for high-rise flats) Office of National Statistics Source: Ordnance Survey Open Greenspace | |
|
Smoking Behaviour |
Maternal smoking is an indicator of the potential for smoking behaviour within the home which may leads to poor indoor air quality. |
% Mothers current or former smokers | |
|
Indoor sources |
Sources of indoor air pollution, such as solid fuel burning, can give rise to elevated air pollution within the home. Domestic and commercial black carbon emissions are taken as a proxy indicator of a range of air pollutants associated with solid fuel use. |
Per HH Domestic/Commercial black Carbon emissions (t/a total / HH total) National Atmospheric Emissions Inventory [47] | |
|
Physical Environment |
Urban Cover |
Urban land covers are associated with higher temperatures because of the Urban Heat Island effect, especially during heat wave conditions (low wind speed, high solar radiation, and low cloud cover) (Levermore et al., 2018). [48] The effect is particularly marked in larger urban areas due to urban structures which prevent re-radiation of stored heat, albedo and thermal capacity of urban structures and waste heat from human activities (Smith et al., 2009). [49] Changes in urban cover overtime also exert an influence on temperature trends as has been shown for Glasgow (Emmanuel and Krüger (2012). [50] Neighbourhoods without much greenspace | Climate Just |
% Urban land cover Land Cover Map (2019) |
|
Physical Environment |
Lack of private greenspace |
Vegetated cover around individual dwellings has the potential to provide cooling through shading and evapotranspiration, thus cooling the local areas around where people live. However, it should be noted that this assumes that private spaces are vegetated. In Manchester, the average garden is about 50% vegetation and 17% trees (Baker et al., 2018). [51]Modelling studies have shown both local cooling effects from vegetation and increased temperatures if vegetation is removed (Skelhorn et al., 2014). [52] Private greenspace may also offer residents better adaptive capacity during hot weather. |
Lack of private greenspace (% dwellings without gardens) Office of National Statistics Source: Ordnance Survey Open Greenspace |
|
Physical Environment |
Lack of community greenspace |
Urban parks have been shown to be on average 1°C cooler than built-up areas and larger parks have a greater cooling effect due to shading and evapotranspiration (Bowler et al., 2010). [53] This impact can be particularly important in larger and denser urban areas where the cooling effect has an influence on surrounding areas. This effect can be reduced or even reversed in some cases, e.g., dried grass areas. Neighbourhoods without much greenspace | Climate Just |
Median combined size of parks and public gardens and playing fields within 1,000 m radius (m2) Office of National Statistics Source: Ordnance Survey Open Greenspace |
Social vulnerability indices
A unique social vulnerability index has been derived for each hazard:
- Flooding: Neighbourhood Flood Vulnerability Index (NFVI)
- Air quality: Neighbourhood air Quality Vulnerability Index (NAQVI)
- Heat: Neighbourhood Heat Vulnerability Index (NHVI)
To calculate each index the associated indicators of social vulnerability are combined using a statistical process. This process is illustrated for the NFVI below (taken from Sayers et al., 2017). Each other index follows a similar process of calculation. In all cases data are standardised and allocated no weights, i.e., where there are multiple factors contributing to a particular vulnerability theme they are all given equal importance in the calculations.
Approach to calculating the Neighbourhood Flood Vulnerability Index (NFVI)
The Neighbourhood Flood Vulnerability Index (NFVI) is determined through a three-stage process as outlined in Figure A2-1 and described below.
Figure A2‑1 The process used to calculate the NFVI (Sayers et al, 2017)
Stage 1: Determine the z-score for Individual Indicators
Each indicator (‘age’ etc. as described in the previous section) is normalised to a z score. The z score is derived by subtracting the mean value and dividing by the standard deviation. If an indicator is already in the form of a rank (e.g., as is the Index of Multiple Deprivation, IMD), the equivalent z score is determined by assuming the rank is drawn from a normal distribution and calculating the number of standard deviations from the mean associated with that rank. This is done so that each indicator has the same numerical parameters, rather than its original numbers (which might be a %, a number, a rank, a fraction, etc.), and to enable them to be compared and combined on the “same playing field.”
Stage 2: Determine the z-score for each domain
Z scores for the individual indicators that contribute to each domain (Susceptibility, Ability to Prepare, Respond and Recover, and Community Support) are combined based upon the assumption of equal weighting (Table A2‑1). The only exception is the individual indicator associated with ‘direct flood experience’ (e1). In this case the weighting is negative as it acts to reduce the relative vulnerability of one neighbourhood compared to another.
The resulting values for each domain are then themselves transformed into a z score.
Stage 3: Determine the NFVI
For each neighbourhood, the z scores derived for each Indicator are summed with equal weighting. The final z score is calculated based on these results and used as the NFVI.


Top: Belfast, Bottom: Boston
Figure A2‑2 Example Neighbourhood Flood Vulnerability Index Maps (Sayers et al, 2017)
Table A2‑1 Indicator weighting (Sayers et al, 2017)
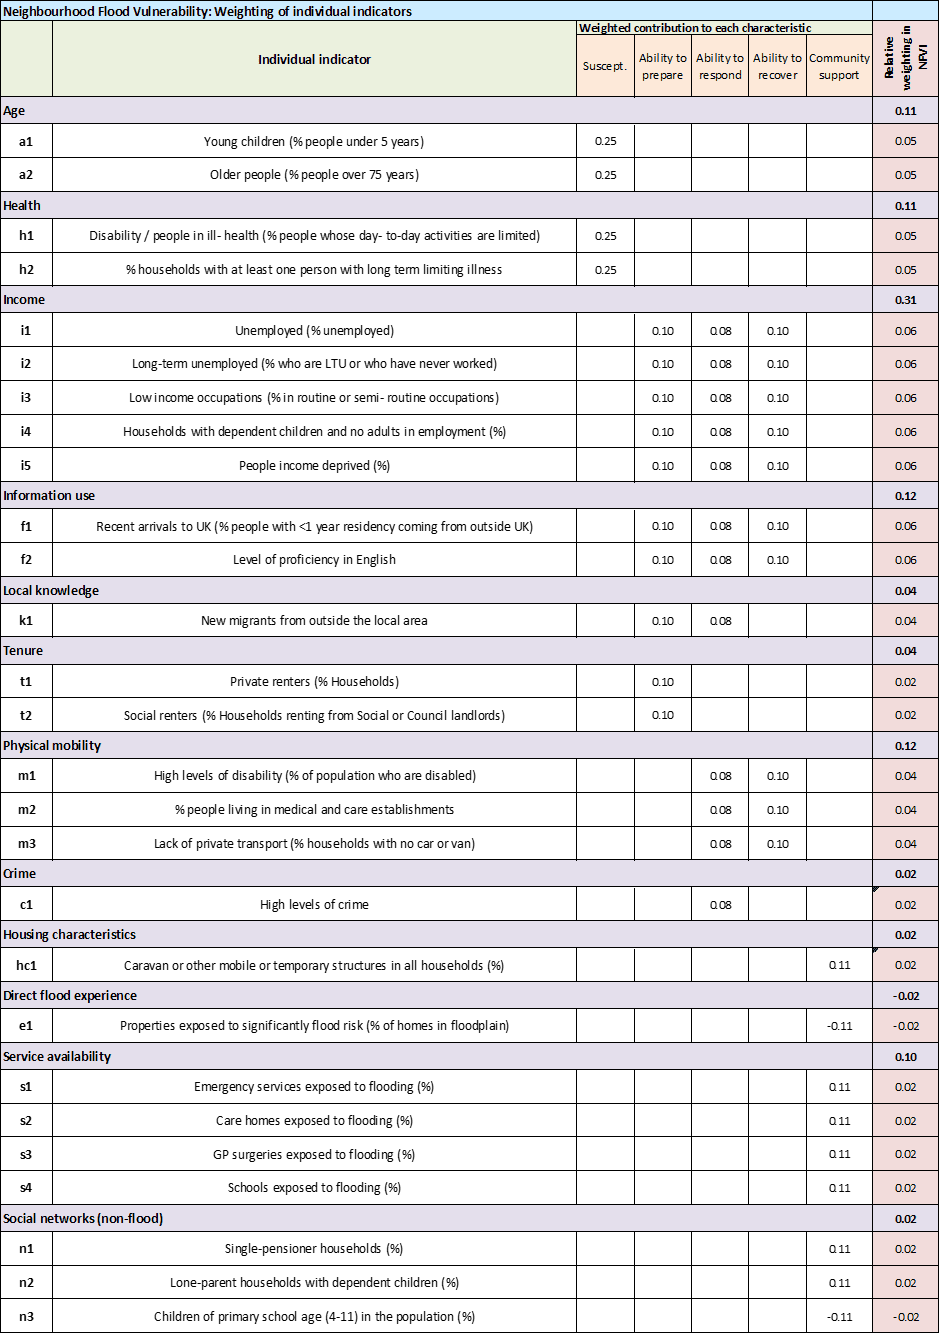
© Published by Sayers and Partners 2022 on behalf of ClimateXChange. All rights reserved.
While every effort is made to ensure the information in this report is accurate, no legal responsibility is accepted for any errors, omissions, or misleading statements. The views expressed represent those of the author(s), and do not necessarily represent
those of the host institutions or funders.
Suggested citation: Sayers, PB., Lindley. S, Carr, S and Figueroa-Alfaro, R. W(2021) The impacts of climate change on population groups in Scotland. Research undertaken by Sayers and Partners in association with the University of Manchester for ClimateXChange.
-
https://www.gov.scot/publications/climate-ready-scotland-second-scottish-climate-change-adaptation-programme-2019-2024/ ↑
-
https://www.theccc.org.uk/publication/is-scotland-climate-ready-2022-report-to-scottish-parliament/ ↑
-
750 people on average in 2011 ↑
-
For air quality standards used in Scotland see Standards (scottishairquality.scot) ↑
-
Expected Annual Damage (EAD): defines annual ‘average’ residential damage considering a hazard event, from frequent to rare, their annual probability of exceedance and the associated damage (detailed in Sayers et al, 2020). ↑
-
The ‘relative pain’ of the economic risks faced by those exposed to flooding (expressed as the ratio between uninsured economic damages and household income). ↑
-
Relative Economic Pain (REP, Sayers et al., 2017): The ‘relative pain’ of the economic risks faced by those exposed to flooding (expressed as the ratio between uninsured economic damages and household income). ↑
-
https://www.ukclimaterisk.org/wp-content/uploads/2021/06/CCRA-Evidence-Report-Scotland-Summary-Final-1.pdf ↑
-
https://www.dynamiccoast.com/files/dc2/_DC2_WS6_CE_Disadvantage_FINAL.pdf ↑
-
Majekodunmi, M., Emmanuel, R., & Jafry, T. (2020). A spatial exploration of deprivation and green infrastructure ecosystem services within Glasgow city. Urban Forestry and Urban Greening, 52, article 126698. https://doi.org/10.1016/j.ufug.2020.126698 ↑
-
Johnson H et al. (2004) The Impact of the 2003 Heat Wave on Mortality and Hospital Admissions in England. Epidemiology, 15(4)6-11 ↑
-
Poumadere M, Mays C, Le Mer S, Blong R (2005) The 2003 Heatwave in France: Dangerous Climate Change Here and Now. Risk Analysis, 25(6):1483-1494 ↑
-
Climate Change and Marginalised Communities Workshop Contributors (2020) Climate change, marginalised communities and considered debate within Scotland’s climate emergency, Scottish Geographical Journal, 136:1-4, 41-48, DOI: 10.1080/14702541.2020.1834335 ↑
-
Marselle MR, Hartig T, Cox D, Siân de Bell SK, Lindley S, Triguero-Mas M, et al. Linking biodiversity to human health: a conceptual framework. Environ Int. 2021; 150:106420 ↑
-
a sequence of five days or more during which minimum temperatures do not fall below 15°C and maximum temperatures exceeds 28°C averaged across the region, from Large increase in projected heatwave frequency for Scotland under new UK climate projections (climatexchange.org.uk) ↑
-
McCartney, G, Collins, C, Walsh, D, Batty, GD (2012) Why the Scots die younger: Synthesizing the evidence Public Health 10.1016/j.puhe.2012.03.007 ↑
-
C. Morgan, J. A. Foster, A. Poston & T. R. Sharpe (2017) Overheating in Scotland: contributing factors in occupied homes, Building Research & Information, 45:1-2, 143-156, DOI: 10.1080/09613218.2017.1241472 ↑
-
Glasgow City Council (2017) ‘A Local Climate Impacts Profile for Glasgow City Council’. ↑
-
Sayers PB., Carr S., Moss C., and Didcock A. (2020) Flood disadvantage – Socially vulnerable and ethnic minorities. sayers_-_flood_disadvantage_-_socially_vulnerable_and_ethnic_minorities_10feb2021.pdf (sayersandpartners.co.uk) ↑
-
Sayers, P.B., Horritt, M., Penning Rowsell, E., and Fieth, J (2017). Present and future flood vulnerability, risk, and disadvantage: A UK assessment. A report for the Joseph Rowntree Foundation. ↑
-
Fourth National Planning Framework: position statement – gov.scot (www.gov.scot) ↑
-
Todd, H; Zografos, C; Todd, Helen; Zografos, Christos (2005) Justice for the Environment: Developing a Set of Indicators of Environmental Justice for Scotland Environmental values., 2005, Vol.14(4), p.483-501 ↑
-
Lee, D., Robertson, C., Ramsay, C., Gillespie, C. and Napier, G (2019) Estimating the health impact of air pollution in Scotland, and the resulting benefits of reducing concentrations in city centres Spatial and Spatio-temporal Epidemiology 29 (2019) 85–96 ↑
-
https://www.ukclimaterisk.org/wp-content/uploads/2021/06/CCRA-Evidence-Report-Scotland-Summary-Final-1.pdf ↑
-
Fenech et al (2021) Future air pollution related health burdens associated with RCP emission changes in the UK Science of the Total Environment. https://doi.org/10.1016/j.scitotenv.2021.145635 ↑
-
Heal, M.R., Heaviside, C., Doherty, R.M., Vieno, M., Stevenson, D.S., Vardoulakis, S., 2013.
Health burdens of surface ozone in the UK for a range of future scenarios. Environ.Int. 61, 36–44. ↑
-
Williams, M.L., Lott, M.C., Kitwiroon, N., Dajnak, D., Walton, H., Holland, M., Pye, S., Fecht, D., Toledano, M.B., Beevers, S.D., 2018. The Lancet Countdown on health benefits from the UK Climate Change Act: a modelling study for Great Britain. Lancet Planet. Heal. 2, e202–e213 ↑
-
Doherty R M, Heal M R, O’Connor F M (2017) Climate change impacts on hu-man health over Europe through its effect on air quality. Environmental Health, 16 (Suppl 1):1-18 ↑
-
Lindley, S.J., Cook, P.A., Dennis, M., Gilchrist, A., (2018), Biodiversity, Physical Health, and Climate Change: A Synthesis of Recent Evidence In: Marselle, M., Bonn, A., Graner, T., et al. (Eds.) Biodiversity, Health & Climate Change. Springer. ↑
-
Labib, SM, Lindley, SJ, Huck JJ (2021) Estimating multiple greenspace exposure types and their associations with neighbourhood premature mortality: A socioecological study Science of The Total Environment Vol 789 https://doi.org/10.1016/j.scitotenv.2021.147919 ↑
-
Maximising ecosystem services in urban environments (MEaSURE) (nercmeasureproject.co.uk) ↑
-
Page, L, Hajat, S, Kovats S, and Howard, LM (2012). Temperature-related deaths in people with psychosis, dementia, and substance misuse. Br J Psychiatry 200(6): 485-490. ↑
-
Dadvand, P; Ostro, B; Figueras, F; Foraster, M; Basagaña, X; Valentín, A; Martinez, D; Beelen, R; Cirach, M; Hoek, G; Jerrett, M; Brunekreef, B; Nieuwenhuijsen, M (2014) Residential Proximity to Major Roads and Term Low Birth Weight, Epidemiology: Vol 25 – Iss 4 – p 518-525 doi: 10.1097/EDE.0000000000000107 ↑
-
Office for National Statistics (2019) Exploring the Digital Divide. https://www.ons.gov.uk/peoplepopulationandcommunity/householdcharacteristics/homeinternetandsocialmediausage/articles/exploringtheuksdigitaldivide/2019-03-04#why-does-digital-exclusion-matter ↑
-
UK Parliament Note no, 621 (not dated) Infrastructure and Climate Change https://researchbriefings.files.parliament.uk/documents/POST-PN-0621/POST-PN-0621.pdf ↑
-
CDRC Residential Mobility Index | CDRC Data https://data.cdrc.ac.uk/dataset/cdrc-residential-mobility-index ↑
-
Preston, I., Banks, N., Hargreaves, K. Kazmierczak, A., Lucas, K., Mayne, R., Downing, C and Street, R (2014) Climate Change and Social Justice: an evidence review Report for the Joseph Rowntree Foundation ↑
-
Poumadère, M., Mays, C., Le Mer, S. and Blong, R. (2005), The 2003 Heat Wave in France: Dangerous Climate Change Here and Now. Risk Analysis, 25: 1483–149 ↑
-
Kazmierczak, A., Cavan, G., Connelly, A and Lindley, S (2015) Mapping Flood Disadvantage in Scotland 2015: Methodology Report. Scottish Government. ↑
-
Rutherford, A., Brook, O. (2018). Civil society organisations in Scotland, 2017. [data collection]. UK Data Service. SN: 852915, DOI: 10.5255/UKDA-SN-852915 ↑
-
Palmer, G (2006) Single Person Households Report for the Joseph Rowntree Foundation https://www.npi.org.uk/files/4213/7544/5585/single_people.pdf ↑
-
Ensor, T. (2004) Overcoming barriers to health service access: influencing the demand side. Health Policy and Planning 19, 69–79. ↑
-
Daras K., Green M. A., Davies A., Barr B., Singleton A. (2019) Open data on health-related neighbourhood features in Great Britain. Scientific data 6 (1), 107. DOI: 10.1038/s41597-019-0114-6 ↑
-
Public Health Scotland (2021). Healthy housing for Scotland: a briefing paper setting out the fundamental link between housing and public health. Edinburgh: Public Health Scotland; Healthy housing for Scotland (publichealthscotland.scot) ↑
-
Taylor, J, Wilkinson, P., Davies, M, Armstrong, B., Chalabi, Z., Mavrogianni, A., Symonds, P., Oikonomou, E., Bohnenstengel,EI (2015) Mapping the effects of urban heat island, housing, and age on excess heat-related mortality in London, Urban Climate, 14:4, Pages 517-528 ↑
-
DCLG (2012) Investigation into overheating in homes. Literature review. ↑
-
Tsagatakis, I., Richardson, J., Evangelides, C., Pizzolato, M., Pearson, B., Passant, N., Pommier, M. & Otto, A. (2021) UK Spatial Emissions Methodology: A report of the National Atmospheric Emission Inventory 2019. Retrieved from: https://naei.beis.gov.uk/reports/reports?report_id=1024 ↑
-
Levermore, G, J Parkinson, K Lee, P Laycock, S Lindley (2018) The increasing trend of the urban heat island intensity Urban Climate, 24: 360-368 ↑
-
Smith, C., Lindley, S. & Levermore, G. Estimating spatial and temporal patterns of urban anthropogenic heat fluxes for UK cities: the case of Manchester. Theor Appl Climatol 98, 19–35 (2009). https://doi.org/10.1007/s00704-008-0086-5 ↑
-
Emmanuel, R and Krüger, E (2012) Urban heat island and its impact on climate change resilience in a shrinking city: The case of Glasgow, UK, Building and Environment, Volume 53, 2012, Pages 137-149 ↑
-
Baker, F, Smith, CL and Cavan, G (2018) A Combined Approach to Classifying Land Surface Cover of Urban Domestic Gardens Using Citizen Science Data and High-Resolution Image Analysis Remote Sensing 10(4):537 DOI:10.3390/rs10040537 ↑
-
Skelhorn, C., Lindley, S., Levermore, G (2014) The impact of vegetation types on air and surface temperatures in a temperate city: A fine scale assessment in Manchester, UK, Landscape and Urban Planning, 121: Pages 129-140, ↑
-
Bowler, D. E. Buyung-Ali, L., Knight, T. M and Pullin, A. S (2010) Urban greening to cool towns and cities: A systemic review of the empirical evidence Landscape and Urban Planning 97 (2010) 147–155 ↑