

Monitoring outcomes of the third Scottish National Adaptation Plan
Research completed August 2024
DOI: http://dx.doi.org/10.7488/era/4836
Executive summary
Aims
This report presents indicators for monitoring the four domestic outcomes of the third Scottish National Adaptation Plan (SNAP3). These outcomes are summarised as:
- Nature Connects
- Communities
- Public Services and Infrastructure
- Economy, Business and Industry
It establishes a baseline prior to the implementation of SNAP3 for monitoring and determining progress at the end of the Plan’s five-year period.
The report addresses the challenges of developing indicators for a national adaptation plan by adopting an approach that balances robustness and practicality, considering available resources and data. We have developed a set of indicators for each outcome, assessing their relevance and feasibility for monitoring, through desk-based review and stakeholder engagement. The assessment has been grounded in the practical reality of what data is available rather than theoretically ideal indicators.
Findings
The indicators proposed for each of SNAP3’s outcomes are listed below. For each indicator, there was sufficient data available to allow for a pre-SNAP3 baseline to be established and then reported against after a five-year period.
- Nature Connects – outcome indicators
- Habitat Connectivity Index
- Proportion of surface water bodies classified in high and good condition
- Proportion of Scotland’s protected sites in favourable condition
- Proportion of soft shorelines affected by coastal erosion
- Extent of green-blue land cover in urban areas
- Proportion of adults who live within a five-minute walk of their nearest green or blue space
These six indicators cover elements of ecological connectivity, ecosystem health, and nature-based solutions (NbS) for climate adaptation. A marine ecosystem indicator could not be included due to insufficient data availability.
- Communities – outcome indicators
- Level of community awareness around climate change
- Level of community climate action
- Progress of actions in local flood risk management plans
- Level of community wellbeing
The four indicators cover elements of community resilience, wellbeing, and climate action. It was particularly challenging to capture the complexity of health and equity in relation to climate adaptation with only a few high-level indicators. The onus was placed on monitoring levels of community action in creating resilient, healthy, and equitable places.
- Public Services and Infrastructure – outcome indicators
- Level of collaboration across public services
- Level of adaptation actions across public services
The two indicators monitor collaboration and adaptation action among public bodies. While these indicators provide high-level insights into public sector collaboration and adaptation efforts, they do not measure the effectiveness or inclusiveness of these actions, which would require numerous sector-specific indicators that would be onerous to monitor.
- Economy, Business and Industry – outcome indicators
- Proportion of businesses monitoring climate-related risks
- Proportion of businesses taking action to adapt to the effects of climate change
- Number of green jobs
- Uptake of grants for agriculture storage reservoirs and off-season storage lagoons
The five indicators cover elements of business preparedness, adaptation actions, and economic opportunities related to climate change. These indicators provide an overview of Scotland’s economic adaptation to climate change. However, they do not cover investment in climate adaptation initiatives or economic resilience to climate-related hazards, as there were insufficient available data.
Recommendations
Key recommendations for the outcome indicators following this project include:
- Consistent application of indicators. The indicator set for SNAP3 should be finalised as soon as possible and consistently applied to enable meaningful and coherent monitoring over the Plan’s five-year period. Any changes made to individual indicators or the data that underpin them may compromise the ability to track progress consistently relative to the baseline.
- Maintain continuity, quality and availability of data required by each indicator. It is vital to maintain the allocation of resources to the collection, maintenance and accessibility of datasets used by the indicators across all relevant Scottish Government departments.
- Maintain flexibility regarding potential for additional indicators. New indicators may be added in the immediate term if relevant data becomes available, as may be anticipated regarding, for example an ecosystem functions indicator for Nature Connects or a green finance indicator for Economy, Business, and Industry. While the suite of indicators addresses the needs for monitoring the outcomes of SNAP3, it may be viewed as a foundation to build upon regarding monitoring of SNAP4.
- Establish a working group to sustain the functioning of the indicators. The working group could comprise key stakeholders and data providers who could meet annually to review the functioning of the indicators and address any issues regarding their deployment, e.g., continuity and availability of data and its quality.
The findings of this report may also be of interest to anyone interested in monitoring and evaluation of climate adaptation planning more generally.
Glossary / Abbreviations table
BICS | Business Insights and Conditions Survey |
CCAH | Community Climate Action Hubs |
LPP | Local Place Plans |
|
MEL | Monitoring, Evaluation and Learning |
|
NAP | National Adaptation Plan |
|
NbS | Nature-based solutions |
|
ONS | Office of National Statistics |
|
SEPA | Scottish Environment Protection Agency |
|
SHeS | Scottish Health Survey |
|
SHS | Scottish Household Survey |
|
SNAP3 | 3rd Scottish National Adaptation Plan |
|
SSN | Sustainable Scotland Network |
|
WEMWBS | Warwick-Edinburgh Mental Wellbeing Scale |
Introduction
Aims of this report
The third Scottish National Adaptation Plan (SNAP3)[1] will be published in Autumn 2024 and Scottish Ministers have agreed that there is a need to improve monitoring of its outputs and outcomes, as compared with the way previous adaptation plans in Scotland have been monitored. The central aim for monitoring, evaluation and learning (MEL) of SNAP3 is to ensure that the indicators are as robust and relevant as possible for monitoring its specific outcomes, while remaining practical and accessible to implement in terms of resources and data available. We have sought to strike this balance between robustness and feasibility in the outcome indicators presented in this report.
The structure of SNAP3 is based around five long term outcomes and 23 objectives that set out adaptation priorities for the Scottish Government between 2024-2029. These five outcomes are (with abbreviations used hereinafter in brackets):
- “Nature connects across our lands, settlements, coasts, and seas” (Nature Connects)
- “Communities are creating climate-resilient, healthy, and equitable places” (Communities)
- “Public services are collaborating in effective and inclusive adaptation action” (Public Services and Infrastructure)
- “Economies and industries are adapting and realising opportunities in Scotland’s Just Transition” (Economy, Business and Industry)
- “Scotland’s international role supports climate justice and enhanced global action on climate adaptation” (International Action)
The indicators developed here address the first four outcomes, which are focused on Scotland’s resilience at the national level. Through a process of desk-based research and engagement with the Scottish Government’s departments and relevant organisations, we have developed a suite of indicators to monitor progress of these outcomes. Each indicator was assessed using criteria to determine its inclusion. The criteria addressed the indicator’s conceptual relevance and practical implications, including availability of baseline data. Our development of indicators for the four outcomes of SNAP3 took place concurrently with work undertaken by the Scottish Government to develop a suite of indicators for the 23 objectives that sit beneath the outcomes.
This report takes the following structure: first, Section 1.2 provides a brief overview of MEL in national adaptation contexts. Section 2 outlines the process undertaken to develop the outcome indicators. Section 3 provides information for each indicator and is structured by each outcome. Baseline data is presented in the Section 4. Section 5 concludes with a discussion and recommendations for next steps. Annexes provide further details on methodology and technical information.
Context
A key takeaway from the COP28 in December 2023 was the importance of monitoring, evaluation, and learning (MEL) to understand and report on the effectiveness of the design and implementation of national adaptation planning processes (Beauchamp & Józefiak, 2023). Due to the iterative nature of climate adaptation, MEL is essential to periodically understand the effectiveness of adaptation plans effectiveness and improve their design accordingly (GEF, 2016). Furthermore, national MEL systems are of importance for fulfilling national reporting commitments, such as the Enhanced Transparency Framework under the Paris Agreement (UNDP, 2022).
Developing indicators of climate adaptation is challenging, conceptually and practically, due to the complex, multi-sectoral and context-specific nature of climate impacts that need to be addressed (UNFCC, 2022). Challenges include: the length of time it can take to implement adaptation actions due to their scope and scale; the length of time for adaptation actions to mature and deliver measurable outcomes; and the need for monitoring to be sustained, which poses practical issues regarding maintenance of a consistent methodology using comparable data and associated long-term funding and policy cycles.
No standard metrics exist to capture adaptation nor an off-the-shelf indicator framework to apply to a country’s context (New et al., 2022). Nevertheless, there are numerous efforts to structure MEL of climate adaptation in the form of checklists and toolkits. Examples include: the BASE Evaluation Criteria for Climate Adaptation, which offers a checklist for evaluation focused on outcomes and processes; and the ‘Toolkit for MEL for National Adaptation Plan (NAP) Processes’ for developing countries (Beauchamp et al., 2024).
The Global Goal on Adaptation (GGA) framework adopted at COP28 (known as the UAE Framework for Global Climate Resilience) represents a concerted effort at a global level to establish universal targets to guide countries’ adaptation pathways. However, identifying a set of indicators to monitor progress remains a fundamental challenge (Gabbatiss & Lempriere, M, 2024). This is exemplified by the wide-ranging list of potential indicators found in the recent UAE – Belém work programme that synthesises countries’ submissions to the United Nations Framework Convention on Climate Change (UNFCCC) (UNFCCC, 2024).
In Scotland, the approach to climate adaptation M&E monitoring and evaluation has been robustly developed through the previous Scottish Climate Change Adaptation Programmes (SCCAPs). The Climate Change Committee (CCC) has provided significant recommendations on enhancing the M&E framework within Scotland. A key recommendation from the CCC has been to establish clear, measurable outcomes and associated indicators that can effectively capture the progress and impact of adaptation initiatives (CCC, 2022). Recognising the benefits of this approach, the Scottish Government has adopted an outcomes-focused approach for its Adaptation Plan. The importance of aligning national adaptation indicators with local contexts, ensuring that the indicators are relevant and actionable for Scotland’s unique environmental, social, and economic conditions has been highlighted in previous ClimateXChange research (Moss, A., 2019). he work presented in this project builds upon this background of previous MEL work.
Developing the suite of indicators
To develop the suite of indicators for monitoring the four outcomes of SNAP3, we followed a five-step approach, as illustrated in Figure 1 and described below.
The first step was a desk-based, data-mapping process. This involved reviewing draft SNAP3, the previous adaptation national plans, the published relevant Scottish policies and some international guidelines on MEL to identify possible indicators. The second step involved developing criteria to rank the indicators and facilitate their selection. At the third and fourth steps, this first longlist of indicators was presented and discussed with several stakeholders, during both one-to-one interviews and four workshops organised on each of the four SNAP3 outcome areas. This dynamic process enabled us to refine and amend the longlist of indicators, clearly identify gaps and limitations, and provide some recommendations. The final step of the process was the presentation of the indicator framework containing 12 outcome indicators.
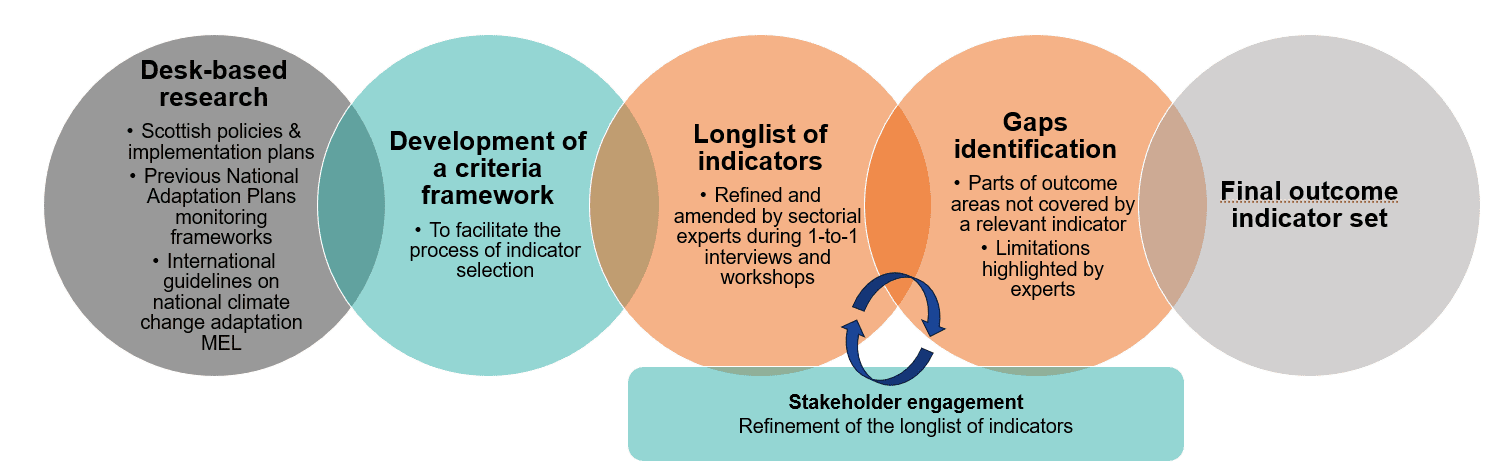
Figure 1: The five-step approach to develop the suite of indicators
Figure 2:: visualisation of the indicator development process
Desk-based research
The first stage of developing indicators involved data mapping through review of:
- Sectoral policies listed in the draft SNAP3 and their implementation plans, where published, to search for relevant existing indicators and associated datasets (See Annex 1).
- Relevant existing indicators and associated datasets used by previous Scottish adaptation plans (CCC, 2023; Moss, A., 2019,) and unpublished meeting notes from a stakeholder workshop led by CXC in May 2023 entitled ‘Monitoring and evaluation of Scotland’s Climate Change Adaptation Programme 2024-2029’.
- A selection of international guidelines and frameworks on national climate change adaptation monitoring and evaluation (EPA, 2017; FAO, 2017; Mäkinen et al., 2018; OECD, 2015; UNFCCC, 2023; UNFCCC, 2024) to learn from others’ approaches to the identification of outcome indicators and to identify if they used any adaptation outcome indicators that might be modified for use regarding SNAP3.
The four outcomes cover a wide range of different elements. Therefore, we used an approach based around theory of change (ToC) to identify those core elements that the indicators for each outcome should cover. This approach complemented the ToC work undertaken by Scottish Government as part of the draft SNAP3. We identified core elements through interpretation and analysis of each outcome section in the draft SNAP3. The core elements identified were:
- Nature Connects: Ecological connectivity (terrestrial, marine, and coastal); ecosystem health (terrestrial, marine, and coastal); and connection to nature.
- Communities: Community action; community resilience; health and equity.
- Public Services: Public sector collaboration; public sector adaptation action; effectiveness of public sector action; and inclusiveness of public sector action.
- Economy, Business, and Industry: Business preparedness and action; and economic adaptation.
This approach provided a broad structure and scope for the development of a longlist of potential indicators. The latter emerged from this desk-based research (See Annex 2). The longlist was refined by applying the indicator criteria (see Section 2.2 below) and amended based on the inputs gathered during the stakeholder engagement.
Indicator criteria
The indicator criteria (see Table 1) built upon established indicator criteria, such as SMART (Specific, Measurable, Achievable, Relevant and Time-Bound) (Biden, 2022) and RACER (Relevant, Accepted, Credible, Easy and Robust) (Peter & Peter, 2009), while refining elements to the specific context (e.g. adaptation relevance). Indicator ranking “low” for any criterion were excluded.
Table 1: Criteria for selecting outcome indicator for SNAP3
| Criterion | Description | Low | Moderate | High |
|---|---|---|---|---|
|
Adaptation relevance |
The indicator should relate to key elements of climate adaptation, including vulnerability, risk, exposure, and adaptive capacity. |
Minimal to no relevance to key climate adaptation elements. |
Some relevance to key climate adaptation elements. |
Clear relevance to key climate adaptation elements. |
|
Representativeness |
The indicator represents a core element of the outcome area within the adaptation plan that it fits under. |
Indicator only represents a small element of the outcome area. |
Indicator somewhat represents the key characteristics of the outcome area. |
Indicator represents well the key characteristics of the outcome area. |
|
Understanding |
The indicator should be easily understandable by a wide range of stakeholders, including non-experts, to ensure effective communication. |
Technical expertise required to fully understand indicator. |
Some technical expertise required but broadly understandable to non-expert audiences. |
Indicator is clearly understandable to a wide audience. |
|
Data availability |
Data for the indicator is readily available and accessible for use by wide range of stakeholders |
No data available or heavily restricted access to necessary data. |
Data exists but requires resources and expertise to fully access. |
Data fully and freely available. |
|
Sensitivity |
The indicator is sensitive enough to detect changes over five-year period. |
Changes in indicator not detectable over the required time-period. |
Indicator data is somewhat sensitive enough to detect changes over the required time-period. |
Indicator data is sensitive enough to detect changes over the required time-period. |
|
Baseline |
It should be possible to set clear, quantifiable baseline for the indicator to track progress. |
Data not available to establish a baseline. |
Baseline data is possible but requires resources to obtain. |
Baseline data is easily accessible. |
|
Practicality |
Indicator should be cost-effective to use and have low resource requirements for data collection and analysis. |
Prohibitively expensive and/or impractical to use indicator data. |
Some expenses and resources required to use indicator data. |
Cost-effective and low-resource to use indicator data. |
Stakeholder engagement
With support from the Scottish Government’s steering group, and drawing upon our desk-based research, we identified relevant stakeholders that could help validate and refine indicators within each outcome area. Stakeholders were considered from various backgrounds relevant to outcome areas, who could offer insights into data availability and gaps, as well as practicality of indicators.
We conducted one-to-one interviews with experts who could offer insights into data availability and gaps to discuss specific areas of the SNAP3 and four stakeholder workshops were organised; one for each outcome area[2]. We also gathered 66 participants over four workshops, from more than 25 different organisations, detailed in Annex 3. They were invited based on their expertise in fields relevant to each outcome area discussed and their knowledge of climate adaptation. The participants received the longlist of indicators before the workshop and were asked: (a) whether the indicators proposed covered well the targeted outcome area and (b) if there were any aspects missing.
The overall aim of stakeholder engagement was to engage with relevant teams across the Scottish Government on existing monitoring work to date, review existing available datasets, and amend the longlist of quantitative indicators developed by Ricardo. Experts confirmed, advised against, or suggested indicators that would best reflect the outcome areas. The workshops helped identify limitations of the selected indicators, as well as highlighting suggested outcomes that should not be included (for example, due to lack of data availability).
Outcome indicators
This section presents the proposed outcome indicators for SNAP3. Figure 2 visually presents the proposed outcome indicators, with each indicator categorised under the relevant outcome area. An overview is provided for each outcome before detailing each indicator. This information includes the indicator title, description, data holder, unit and rationale for inclusion. Detailed information for how the indicator criteria was applied to each indicator is provided in Annex 4.
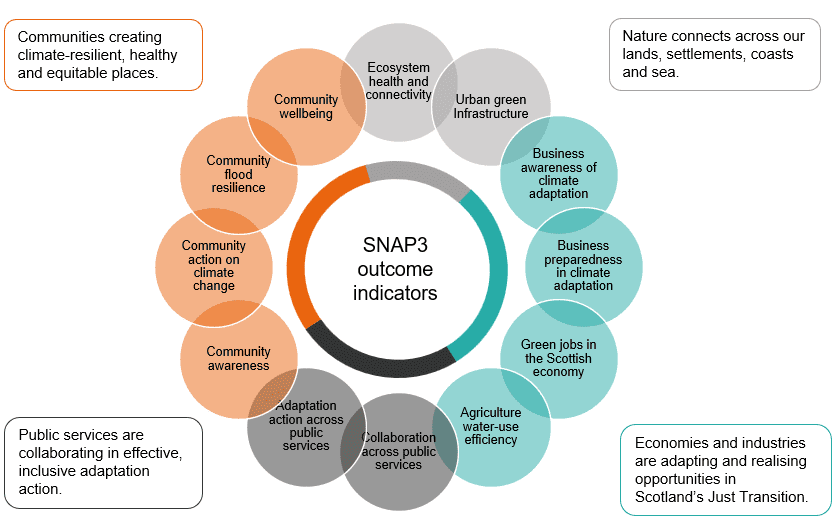
Figure 2: Proposed outcome indicators for SNAP3
Nature connects across our lands, settlements, coasts, and seas
Overview
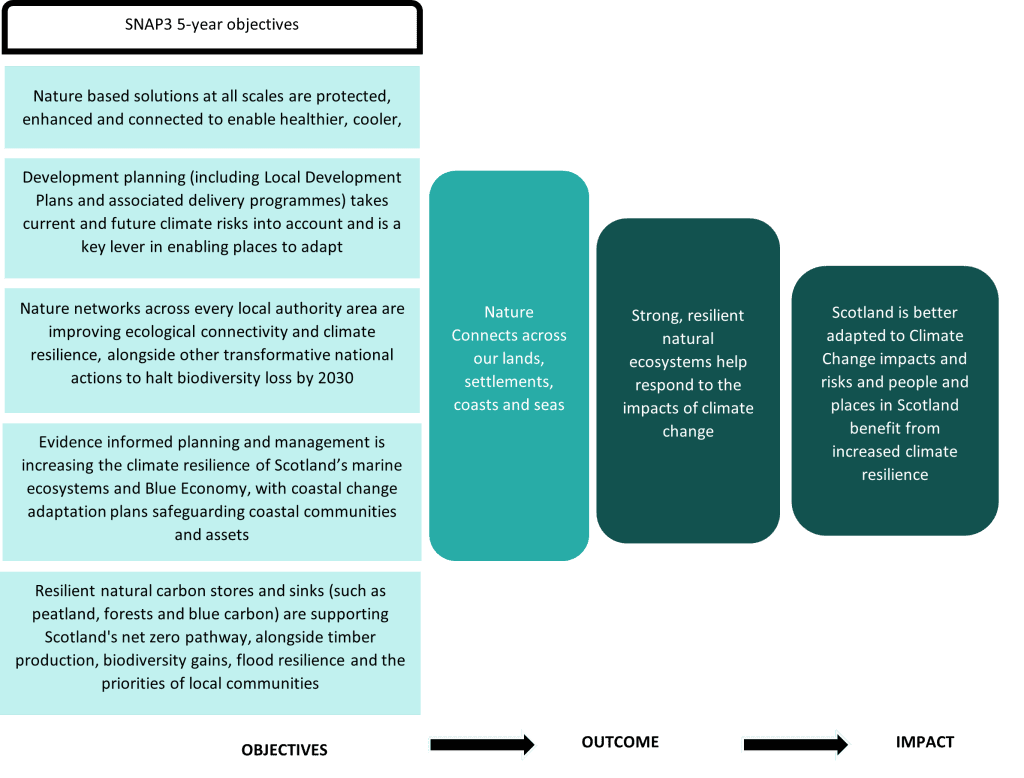
The outcome Nature Connects places emphasis on nature’s role in climate adaptation. It emphasises connectivity across landscapes, settlements, coasts, and seas to bolster ecosystem resilience. Key actions include developing nature networks in every local authority area, managing invasive species, and enhancing natural carbon stores like peatlands and forests. Taking a holistic approach aims to improve Scotland’s climate resilience while delivering co-benefits for biodiversity, flood mitigation and human wellbeing. Figure 3 illustrates the SNAP3’s pathway from objectives to outcome and impact for the Nature Connects outcome.[3]
Considerations for indicator selection
Following the desk-based review and stakeholder engagement, several considerations emerged regarding indicator selection for the Nature Connects outcome:
- The importance of acknowledging that connectivity indicators do not necessarily reflect habitat quality or overall ecosystem resilience. Hence, ideally, there would be a focus on ecosystem functions and processes. However, while indicators focused on ecosystem functions are currently under development by Nature Scot, they will not be operational in time for use in monitoring SNAP3.
- Despite the high-level nature of indicators, there is a need to reflect Scotland’s diverse environment. Freshwater environments were highlighted as both a useful proxy for the extent of ecological connectivity and with a comprehensive and accessible dataset.
- Urban green infrastructure is an important aspect of this outcome and the indicators should capture the extent of accessibility to nature and green spaces.
- Species indicators are not sufficiently sensitive to show a significant trend over SNAP3’s five years. Changes in species abundance and distribution due to climate change are often gradual. Species’ adaptation, whether through genetic changes, changes in behaviour, or moves to new areas, often require longer than five years to be observable. Over a shorter period, it can be difficult to distinguish between short-term fluctuations and longer-term changes driven by climate change. While five-year studies can provide valuable snapshots and early indicators, longer timeframes are typically needed to confidently assess significant trends in species abundance and distribution related to climate adaptation. Therefore, indicators like “terrestrial species’ abundance” developed by Nature Scot were deemed inappropriate for inclusion.
- As outlined in SNAP3, marine ecosystems will make a vital contribution to Scotland’s adaptation to climate change. However, there is very limited data available to measure marine habitat connectivity. Furthermore, there is difficulty capturing adaptation of the marine environment in a single, general indicator. For example, NatureScot’s marine species’ abundance indicator focuses upon the average abundance of 14 species of breeding seabird. Such an indicator was not considered to be suitably representative of marine ecosystems and, therefore, not selected.
- Not all the natural habitat types are captured in this framework. Specific indicators were considered but not selected. For example, the baseline for the Woodland Ecological Condition indicator was too old and the indicator would not cover the 2024-2029 period.
Nature Connects – proposed indicators
When setting out to develop a list of indicators for the Nature Connects outcome, it was important to cover ecological connectivity between habitats across land and sea, ecosystem health, and the implementation of NbS for climate adaptation. To a large extent, the six indicators chosen for this outcome efficiently achieve this coverage by using established indicators and available data held for various Scottish Government agencies.
The proposed indicators are:
- Habitat Connectivity Index
- Proportion of surface water bodies classified in high and good condition
- Proportion of Scotland’s protected sites in favourable condition
- Proportion of soft shorelines affected by coastal erosion
- Extent of green-blue land cover in urban areas
- Proportion of adults who live within a five-minute walk of their nearest green or blue space.
Immediately below we present the baseline information foreach of the six indicators proposed to monitor the Nature Connects outcome. For each indicator, we provide the baseline value, a description of the baseline, the recent trend and desired trend for each indicator to provide context. More information on baseline data is available in Annex 5. This is followed by a further detailed summary of each indicator and the rationale for their inclusion.
Nature Connects – baseline
Habitat Connectivity Index
- Description: In 2020, the total Equivalent Connected Area (Probability of Connectivity) (ECA (PC) value for Scotland was 35,570 ha for semi-grassland (2.9%), 5,655 ha for woodland (1.4%) and 214,277 ha for heathland (8.3%).
- Recent trends: None.
- Desired trend: Increase
- Baseline
- Semi-grassland: 2.9%
- Woodland: 1.4%
- Healthland: 8.3%
Proportion of surface water bodies classified in good and better condition
- Description: In 2022, 445 (13.7%) surface water bodies were in better condition and 1664 (51.2%) surface water bodies were in good condition.
- Recent trends: This percentage has remained broadly stable in recent years, rising slightly from 61.8% in 2014.
- Baseline: 64.9%
- Desired trend: Increase
Proportion of Scotland’s protected sites in favourable condition
- Description: In March 2024, the proportion of natural features in favourable condition on protected sites was 75.6%.
- Recent trends: The trend between 2023 and 2024 is relatively stable, slightly decreasing by 0.9%. However, the proportion of features in favourable condition has decreased by 4.8 percentage points since 2016 when it peaked at 80.4%.
- Baseline: 75.6%
- Desired trend: Increase
Proportion of soft shorelines affected by coastal erosion
- Description: In 2021, 46% of the soft coast is affected by coastal erosion. The average rate of erosion is 0.43 m/year.
- Recent trends: In 2017, 38% of the soft coast was affected by coastal erosion, representing an 8% increase in eight years. Note, the proportion of shorelines experiencing coastal erosion, and the rate of erosion, increases under all climate change emissions scenarios.
- Baseline: 46%
- Desired trend: Decrease
Extent of green-blue land cover in urban areas
- Description: The total area of urban greenspace in Scotland as defined by Ordnance Survey is 3,167 km².
- Recent trends: April 2024 represents the only OS MasterMap Greenspace data currently available from the Ordnance Survey.
- Baseline: 3,166km2
- Desired trend: Increase
Proportion of adults who live within a 5-minute walk of their nearest green or blue space
- Description: In 2022, 70% of adults reported living within a 5-minute walk of their nearest green or blue space.
- Recent trends: This percentage has remained broadly stable since 2013, where it was 68%. There has been a slight, steady increase from 2017 from 65% to 70%.
- Baseline: 70%
- Desired trend: Increase
Nature Connects – indicator summaries
ECOSYSTEM HEALTH AND CONNECTIVITY
Habitat Connectivity Index
|
Indicator |
Habitat Connectivity Index |
|
Description |
This habitat connectivity indicator measures ‘functional connectivity’. This refers to how well species can move from one habitat patch to another. This indicator shows the functional connectivity of three habitats (Woodland; Heathland; Grassland;). |
|
Data holder |
Nature Scot |
|
Unit |
% of total habitat area per catchment |
The Habitat Connectivity Index was selected to represent the functional health of natural ecosystems in Scotland. Habitat networks enable species to follow their shifting climate envelope and move to new habitats, ensuring their survival and the continuity of ecosystem services. Connectivity is crucial for promoting the survival, migration, and adaptation potential of species populations in response to climate change. By assessing functional connectivity, this indicator provides valuable insights into ecosystem resilience, highlighting areas where habitat fragmentation might increase the risk and exposure of species to climate-related impacts. Enhancing habitat connectivity directly supports the adaptive capacity of species by facilitating movement and gene flow, thereby reducing vulnerability, and supporting biodiversity conservation (Haddad et al., 2015). It reflects the interconnectedness of ecosystems and underscores the importance of maintaining and improving habitat connectivity to mitigate climate risks and enhance the adaptive capacity of natural systems (Krosby et. al., 2010).
Proportion of surface water bodies classified in good or better condition
|
Indicator |
Proportion of surface water bodies classified in high or good condition |
|
Description |
This indicator shows the proportion of surface water body with an overall status classified either “good” or “high”. SEPA monitors the environment to assess the condition of water quality, water resources, physical condition, fish migration and the impact of invasive non-native species. If any single aspect of a water body is classified as below good, that water body’s overall condition is reported as below good. |
|
Data holder |
Scottish Environment Protection Agency (SEPA) |
|
Unit |
% |
We chose ‘proportion of surface water bodies classified in high or good condition’ as a proxy for climate change adaptation because it reflects the health and quality of water ecosystems. Healthy water bodies are more resilient to climate change impacts such as altered precipitation patterns, increased temperatures, and pollution. By maintaining high and good conditions, these water bodies can better support biodiversity and delivery of ecosystem services that fulfil human needs, particularly regarding climate adaptation (Palmer et al., 2009).
Proportion of Scotland’s protected sites in favourable condition
|
Indicator |
Proportion of Scotland’s protected sites in favourable condition |
|
Description |
This indicator shows the efforts to improve the condition of natural features in protected sites as they will ensure terrestrial habitats are in good ecological health in Scotland. This indicator relates to the quality of natural habitats. |
|
Data holder |
Nature Scot |
|
Unit |
% |
We chose ‘proportion of Scotland’s protected sites in favourable condition’ as a proxy to reflect the health and resilience of Scottish ecosystems. Healthy and well-managed protected sites are better able to withstand and adapt to the impacts of climate change, such as shifting species distributions and extreme weather events (Watson et al., 2014). This indicator shows how effectively Scotland is preserving biodiversity and ecosystem services, which are crucial for climate resilience. It is important to look at the proportion of sites in favourable condition by habitat type. Indeed, habitats such as native woodland, which are vulnerable to overgrazing and invasive non-native species, have a lower percentage (56.8%) of sites in favourable condition than the other types of habitats (average of 73.4%).
Proportion of soft shorelines affected by coastal erosion
|
Indicator |
Proportion of soft shorelines affected by coastal erosion |
|
Description |
This indicator shows the proportion of shorelines experiencing coastal erosion in Scotland. |
|
Data holder |
Ordnance Survey |
|
Unit |
% |
Scotland’s coastline is estimated to be 18,743 km in length along the high-water line. This indicator was chosen as coastal erosion affects society’s assets such as infrastructure and cultural heritage, and contributes to more frequent coastal flooding. Coastal erosion is exacerbated by climate change. Implementing adaptation strategies to protect Scotland’s coasts is crucial to protect the biodiversity of coastal ecosystems. It also ensures the safety and resilience of coastal communities against climate impacts, as well as the resilience of regional and national infrastructure (McGranahan et al., 2007).
URBAN GREEN INFRASTRUCTURE
Extent of green-blue land cover in urban areas
|
Indicator |
Extent of green-blue land cover in urban areas |
|
Description |
This indicator shows the accessible and non-accessible greenspaces (woodland open semi-natural areas, inland water, beach or foreshore, manmade surface, multi-surface) in urban areas in Scotland. |
|
Data holder |
Ordnance Survey |
|
Unit |
% |
This indicator is chosen as a proxy for integration of nature into urban settlements. Green infrastructures within towns and cities are NbS designed to reduce the urban heat island effect, improve resilience to flooding and provide an opportunity for people to enjoy and benefit from nature. Compared to technology-based solutions to climate challenges, NbS like green-blue land cover in urban areas are often more cost-effective and longer lasting. They also have multiple co-benefits, such as reducing net emissions, providing habitats for biodiversity, enhancing human health and well-being (Demuzere et al., 2014; Gill et al., 2007).
Proportion of adults who live within a five-minute walk of their nearest green or blue space
|
Indicator |
Proportion of adults who live within a five-minute walk of their nearest green or blue space. |
|
Description |
This indicator measures the proportion of adults who live within a five-minute walk of their nearest green or blue space. |
|
Data holder |
Scottish Household Survey |
|
Unit |
% |
This indicator is chosen as a proxy to reflect the extent communities have access to natural spaces. Easy access to green and blue spaces enhances community resilience in the face of climate stressors by promoting well-being (e.g. air quality improvement, mental and physical health, etc.) (Maas et al., 2006). Access to green and blue spaces helps mitigate the urban heat island effect, providing cooler areas that can reduce heat-related health risks during extreme weather events. Lastly, green and blue spaces contribute to biodiversity and water management, supporting ecosystems that buffer against climate impacts such as flooding (Demuzere et al., 2014).
Communities are creating climate-resilient, healthy and equitable places
Overview
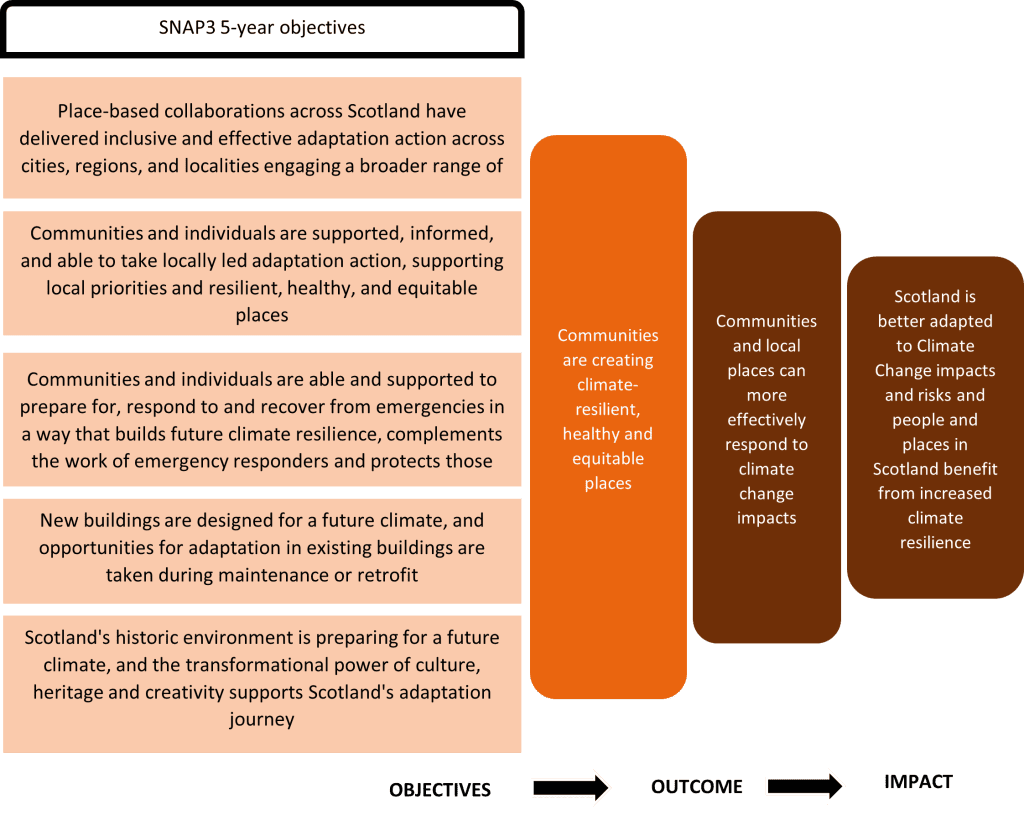
This outcome focuses on empowering communities to create climate-resilient, healthy and equitable places. It adopts a place-based approach, acknowledging that climate impacts vary by local context. Key initiatives include establishing Climate Action Hubs, developing collaborative planning partnerships and providing capacity-building support. This community-centred approach seeks to ensure adaptation efforts are inclusive, address local needs and build societal resilience to climate impacts. Figure 4 presents the SNAP3’s pathway from objectives to outcome and impact for the Communities outcome.[4]
Considerations for indicator selection
Following the desk-based review and stakeholder engagement, several considerations emerged regarding indicator selection for the Communities outcome:
- Data on exposure to climate-related hazards provides information on the places where efforts need to be intensified to limit inequalities, for example, if hazard data is coupled with data on deprivation or social vulnerability (Sayers, PB., et al., 2021). We explored one indicator related to the exposure of vulnerable populations to climate-related hazards. This indicator sought to understand inequality in how communities are impacted by climate hazards. There are limitations to such an indicator focusing on exposure to flood, heat, drought, or wildfire, as it does not consider the resilience of the population exposed. While exposure is unlikely to change in the short to medium term, measures to reduce the vulnerability of those most exposed to risks will be key to increasing their resilience. It is, therefore, important data but less suitable as an indicator measuring increased community resilience for the purposes of this work. The overall conclusion was that the indicators for the Communities outcome should focus more on actions being taken by communities that are indicative of resilience.
- Flooding and the action taken to adapt to this hazard was a focus for consideration due to its significance as a climate-related hazard for Scotland. Example indicators include the ‘proportion of flood resilience action undertaken’ or ‘uptake of property flood protection measures in deprived areas’, or ‘responses to surveys on adaptation action’. Indicators around property flood protection measures and insurance were considered. However, although schemes such as “Build back better” exist, there were insufficient national data available to include this indicator.
- A combination of two indicators, ‘progress of actions in local flood risk management plans’ and ‘percentage of the population declaring that they understand what actions they should take to help tackle climate change’ were selected as proxies to capture community action in climate adaptation.
- Collaboration at community level was often mentioned as essential when it comes to adaptation to ensure the salience, credibility and legitimacy of actions and common understanding, ownership, and a desire to implement. The level of community climate collaboration is captured through monitoring the Community Climate Action Hubs (CCAH) and Local Place Plans.
- Health is embedded in all the areas of SNAP3. This makes it difficult to have a general indicator linking health to climate-related hazards and issues, such as heatwaves, cold, flooding, vector-borne diseases, and food systems. This could only be captured by a fuller set of indicators focusing on health and well-being. A dataset measuring climate morbidity in Scotland could be relevant as a future outcome indicator for SNAP4 should suitable data become available. For this indicator set, a focus on wellbeing is taken using national data on the Warwick-Edinburgh Mental Wellbeing Scale (WEMWBS).
Communities – proposed indicators
When setting out to develop a list of indicators for the Communities outcome, we aimed to cover aspects of community resilience, health, and equity. Of the four indicators selected for this outcome, three indicators reflected the community resilience aspect (level of community awareness; level of community climate action; and progress of actions in local flood risk management plans). There was a particular challenge in capturing the complexity of health and equity in relation to climate adaptation with only a few high-level indicators in this framework. Instead of health, a focus on community wellbeing was taken with the use of national data on the Warwick-Edinburgh Mental Wellbeing Scale (WEMWBS). With elements of health and equity not explicitly covered, we have instead put onus on using established indicators and available data to monitor levels of community action in creating resilient, healthy, and equitable places. Monitoring this level of community action, be it in increased community awareness, the growth of Community Climate Action Hubs (CCAH) and Local Place Plans (LPP) or in specific community actions around flood management, provides important insight on how communities are adapting to climate change.
The proposed indicators are:
- Level of community awareness around climate change
- Level of community climate action
- Progress of actions in local flood risk management plans
- Level of community wellbeing.
Below we present the baseline information for each of the four indicators proposed to monitor the Communities outcome. For each indicator, we provide the baseline value, a description of the baseline, the recent trend and desired trend for each indicator to provide context. More information on baseline data is available in Annex 5. This is followed by a further detailed summary of each indicator and the rationale for their inclusion.
Communities – baseline
Proportion of adults viewing climate change as an immediate and urgent problem
- Description: In 2022, 74% of adults viewing climate change as an immediate and urgent problem.
- Recent trends: The Scottish population concerned about climate change representing an immediate and urgent problem has risen every year since 2013, where 46% held this view. In 2017, 61% held this view.
- Baseline: 74%
- Desired trend: Increase
Proportion of the population declaring that they understand what actions they should take to help tackle climate change
- Description: In 2022, 80% of adults agreed that they understood what actions they should take to help tackle climate change.
- Recent trends: In 2018, 74% of adults stated they understood what actions they should take to help tackle climate change.
- Baseline: 80%
- Desired trend: Increase
Number of Community Climate Action Hubs
- Description: In 2024, 20 hubs across Scotland support community-led climate action, covering 81% of the Scottish council areas.
- Recent trends: The first two hubs launched in September 2021 and the network has now expanded, consisting of the 20 hubs.
- Baseline: 81%
- Desired trend: Increase
Number of Local Place Plans
- Description: In 2024, no local place plans have been adopted.
- Recent trends: Many councils have recently invited communities to prepare Local Place Plans so that they can play a proactive role in defining the future of their places.
- Baseline: 0
- Desired trend: Increase
Progress of actions in local flood risk management plans
- Description: In 2019, 90% of the actions to avoid an increase in flood risk were complete. By 2021, 100% of the actions were expected to be complete. In 2019, 84% of the actions to reduce flood risk were complete. By 2021, 96% of the actions were expected to be complete.
- Recent trends: progress was assessed for cycle 1 (2015-2021).
- Baseline: 90% (completed actions to avoid an increase in flood risk), 84% (completed actions to reduce flood risk)
- Desired trend: Increase
Level of community wellbeing
- Description: In 2022, the mean WEMWBS score for all adults was 47.0
- Recent trends: The mean WEMWBS score for all adults remained stable between 2008 and 2019, between 49.4 and 50.0. Since 2019, it has decreased to 48.6 in 2021 and now 47.0 in 2022.
- Baseline: 47.0
- Desired trend: Increase
Communities – indicator summaries
Community awareness around climate change
|
Indicator |
Level of community awareness around climate change |
|
Description |
This indicator is measured by the following:
|
|
Data set holder |
Scottish Household Survey |
|
Unit |
% |
This indicator is chosen as it combines the knowledge of what is required to tackle climate change with the perception of urgency in addressing climate change. This combination is a critical aspect of community resilience. A well-informed community that recognises the urgency of climate action is more likely to engage in adaptive behaviours (Marshall et al., 2013; Shi et al., 2016). This indicator provides insights into the adaptive capacity of communities and their readiness to implement adaptation measures.
Community action on climate change
|
Indicator |
Level of community climate action |
|
Description |
This indicator covers the number of Community Climate Action Hubs (CCAH) and Local Place Plans in Scotland. Community Climate Action Hubs are centers that support local initiatives focused on climate resilience, providing resources, education, and networking opportunities to empower communities in addressing climate challenges. This indicator will look at the percentage across all Scotland’s regions that have at least one CCAH. Local Place Plans are community-led plans that detail the aspirations and priorities of residents for the development and improvement of their areas, ensuring that local voices are integrated into the broader planning process. |
|
Data set holder |
Scottish Government |
|
Unit |
CCAH – % / LPP – Number |
This indicator was selected as the number of Community Climate Action Hubs in Scotland indicates strong community resilience. This is done through fostering local engagement, resource distribution, capacity building, innovation, network-building, and policy advocacy for climate adaptation (Agrawal, 2008). Local Place Plans act as a good proxy for community-led collaboration and action. The data is available and how the hubs and plans relate to action is understandable to wider audiences.
Community flood resilience
|
Indicator |
Progress of actions in local flood risk management plans |
|
Description |
This indicator measures the progress of actions to reduce or avoid flooding set in the Flood Management Plans. |
|
Data set holder |
The 14 lead local authorities in charge of local Flood Risk Management Plans |
|
Unit |
% of actions completed |
This indicator focuses on actions of local authorities to build community flood resilience. It emphasises the importance of communities playing an active role in reducing the impact of climate change effects, in this case increased flooding (McEwen et al., 2014). This aspect is a key part of communities creating climate-resilient, healthy, and equitable places. These flood risk management plans are part of Scotland’s route map for reducing the effects of flooding on communities. This is key to Scotland’s health, wellbeing and economic success, with an estimated 284,000 homes, businesses and services identified as at risk of flooding.
Community wellbeing
|
Indicator |
Level of community wellbeing |
|
Description |
This indicator measures adults (aged 16+) average score on the Warwick-Edinburgh Mental Wellbeing Scale (WEMWBS). The WEMWBS scale comprises 14 positively worded statements designed to assess positive affect, satisfying interpersonal relationships and positive functioning. |
|
Data set holder |
Scottish Health Survey |
|
Unit |
Mean score on WEMWBS scale |
This indicator captures the extent of wellbeing within communities. Evidence shows that experience of the effects of climate change, for example a flooding event, and the capacity to adapt or react to it has a direct impact on mental health (Berry et al., 2018; Palinkas & Wong, 2020). Therefore, it is representative of communities and their health in relation to adaptation.
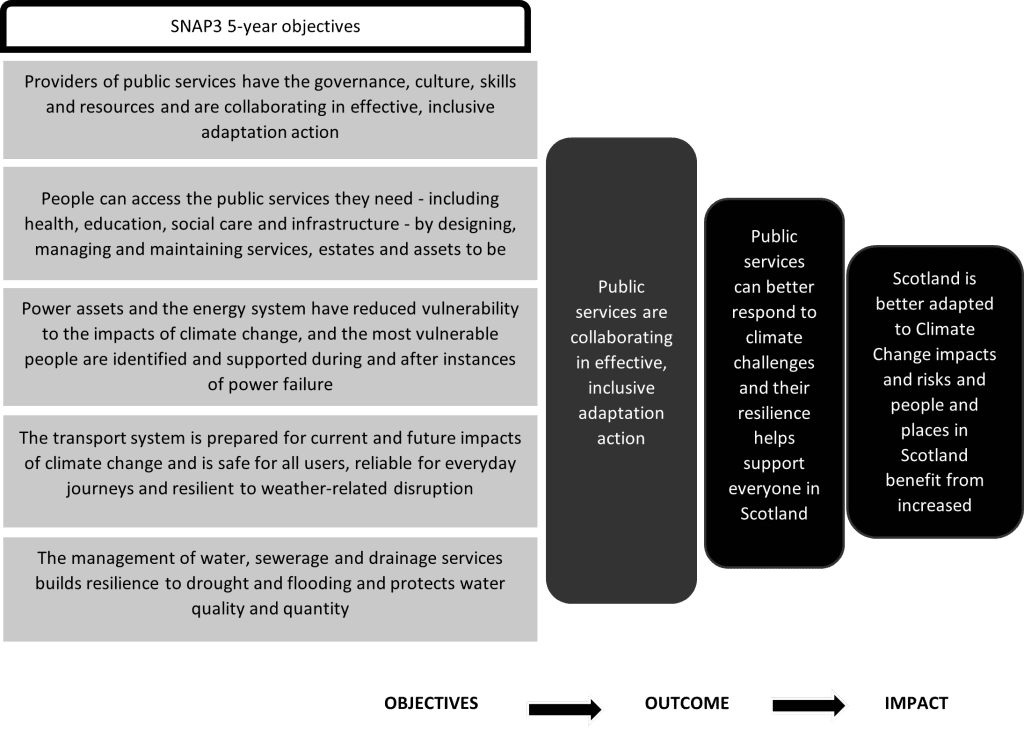
Public services are collaborating in effective and inclusive adaptation action
Overview
This outcome addresses the need for public services to collaborate effectively on adaptation. It aims to enhance governance, culture, skills and resources within public services to enable effective adaptation. Key actions include strengthening the Public Sector Climate Adaptation Network, modernising water industry adaptation and embedding adaptation across transport networks. This approach seeks to ensure continued delivery of essential services and infrastructure resilience amidst climate change. Figure 5 presents the SNAP3’s pathway from objectives to outcome and impact for Public Services.[5]
Considerations for indicator selection
Following the desk-based review and stakeholder engagement, several considerations emerged regarding indicator selection for the Public Services outcome:
- We determined that focusing on specific sectoral indicators related to the adaptation of critical infrastructure would result in numerous indicators. This would go against a core aim of our work to develop a concise and clear set of indicators. As discussed, the Scottish Government’s work developing indicators at an objective level has taken place alongside development of the outcome indicators presented in this report. Specific sectoral indicators have been determined at the objective level rather than being included in the high-level outcome indicators developed through this work.
- We explored the possibility of an indicator around participation levels at a recently established infrastructure adaptation forum. However, the objectives and the ambitions of this forum are still at an early stage and it was not possible to determine a baseline, so it was not included here.
- Collaboration is an important aspect of this outcome. The extent of collaboration of public service bodies is captured through the Sustainable Scotland Network annual report. The quality of collaboration is equally as important to capture. However, there is currently insufficient data available to incorporate this element within the outcome indicators.
Public services – proposed indicators
When setting out to develop a list of indicators for the Public Services outcome, we aimed to cover the extent of collaboration between public services, as well as the extent of effective and inclusive adaptation. These indicators use data available to capture high-level insights on the extent of public sector collaboration and adaptation actions that public bodies are taking. These indicators do not cover the extent to which these actions are effective or inclusive. Ultimately, this can only be captured at a sector-specific level, as no generalised metric for effectiveness or inclusiveness of public services and infrastructure exists. It was not possible to go to the level of sector-specific indicators for public services and infrastructure as this would result in numerous indicators.
The proposed indicators are:
- Level of collaboration across public services
- Level of adaptation actions across public services.
Below we present the baseline information for each of the two indicators proposed to monitor the Public Services outcome. For each indicator, we provide the baseline value, a description of the baseline, the recent trend and desired trend for each indicator to provide context. More information on baseline data is available in Annex 5. The is followed by a further detailed summary of each indicator and the rationale for their inclusion.
Public services – baseline
This section presents baseline information. For each indicator, we provide the baseline value, a description of the baseline, the desired trend for each indicator and recent trends for each baseline to provide context.
Number of public bodies members in the Public Sector Climate Adaptation Network
- Description: In 2024, the Public Sector Climate Adaptation Network counted 50 members.
- Recent trends: the Public Sector Climate Adaptation Network was launched in 2019 with 40 major organisations. 10 additional 10 organisations joined the Network in October 2023.
- Baseline: 50
- Desired trend: Increase
Number of public bodies citing the Work in partnership & collaborations as a priority for the year ahead in relation to climate change adaptation
- Description: In 2022-2023, 53.2% of the 188 listed public bodies (100 public bodies) submitting an annual compliance report cite “Work in Partnerships & Collaborations” in their top five priorities for the year ahead in relation to climate change adaptation.
- Recent trends: In 2021/22, 36.2% of public bodies declared that they prioritized “Work in Partnerships & Collaborations”.
- Baseline: 53.2%
- Desired trend: Increase
Level of risk assessment across the public sector
- Description: 70.2% of the public bodies submitting an annual compliance report have completed some form of risk assessment during or prior to the 2022/23 reporting period. 43.6% of bodies have carried out a limited risk assessment. 20.7% of bodies have carried out a comprehensive risk assessment. 5.8% have completed an advanced risk assessment, involving stakeholders and considering a range of climate or socioeconomic scenarios.
- Recent trends: In 2021/22 reporting, 66.0% of public bodies submitted some form of adaptation risk assessment.
- Baseline:
- Limited risk assessment: 43.6%
- Comprehensive risk assessment: 20.7%
- Advanced risk assessment: 5.8%
- Desired trend: Increase
Level of adaptation action taken across the public sector
- Description: 71.8% of all listed public bodies submitting an annual compliance report have taken adaptation action during or prior to the 2022/23 reporting period. 44% of bodies have taken some action, 21% of all bodies are taking good action. 6% of bodies are taking advanced action.
- Recent trends: In 2021/22 reporting, 67.0% of public bodies reported taking some form of action on adaptation.
- Baseline:
- Some actions taken: 44%
- Good action taken: 21%
- Advanced action taken: 6%
- Desired trend: Increase
Public Services – indicator summaries
Level of collaboration across public services
|
Indicator |
Level of collaboration across public services |
|
Description |
This indicator is a combination of:
and
|
|
Data set holder |
Adaptation Scotland and Sustainable Scotland Network on behalf of Scottish Government |
|
Unit |
This indicator is selected as a proxy to demonstrate the level of collaborative effort between different public bodies on shared outcomes and priorities. Collaboration is vital to tackling the complex challenges involved in strengthening climate resilience. Effective collaboration can enhance adaptive capacity, reduce vulnerability, and ensure a cohesive response to climate change (Runhaar et al., 2018).
Level of adaptation actions across public services
|
Indicator |
Level of adaptation actions across public services |
|
Description |
This indicator is measured by the following:
This indicator is a combination of two pieces of information reported by 188 public bodies according to Section 44 of the Climate Change (Scotland) Act 2009. The level of risk assessment (none, limited, comprehensive, advanced) and of adaptation action (none, some, good, advanced) taken across the public sector are assessed. The Sustainable Scotland Network manages the annual reporting process and analyses the returns on behalf of the Scottish Government. |
|
Data set holder |
Sustainable Scotland Network on behalf of the Scottish Government |
|
Unit |
% |
This indicator captures the level of climate adaptation actions undertaken by public bodies. The public sector must assess and address climate risks through adaptation planning and action to ensure the quality of its services to the population in a changing climate (Runhaar et al., 2018). By monitoring the level of risk assessment and adaptation actions, this indicator provides insights into the preparedness and resilience of public services.
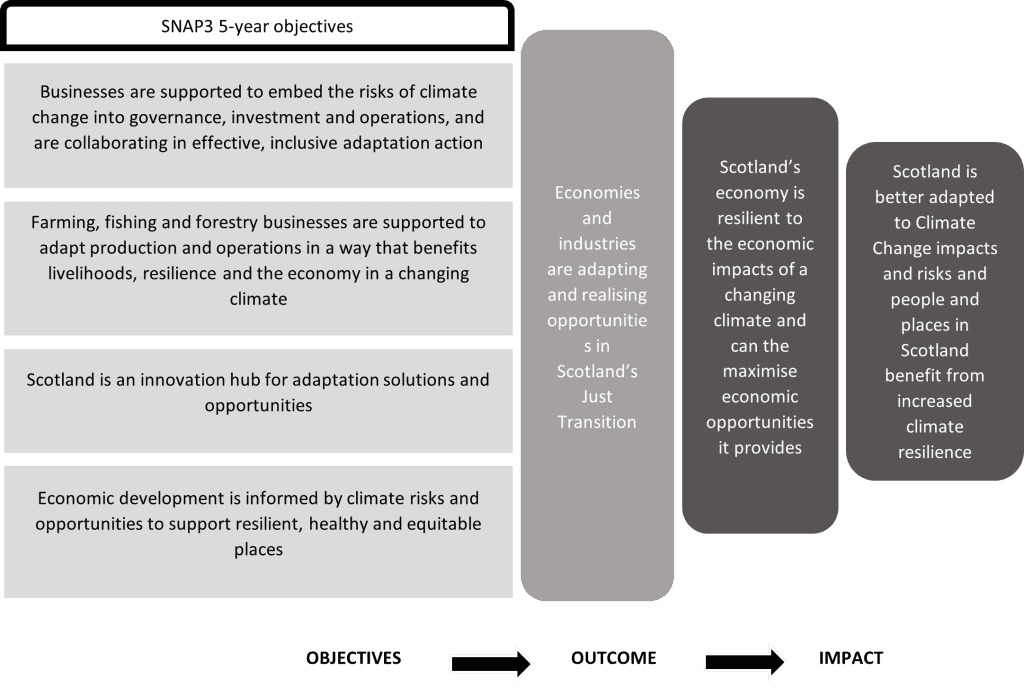
Economies and industries are adapting and realising opportunities in Scotland’s Just Transition.
Overview
This outcome focuses on adapting the economy and industries to realise opportunities in Scotland’s Just Transition. It aims to support businesses in understanding and responding to climate risks, whilst fostering innovation in adaptation solutions. Key actions include increasing business awareness of climate risks, supporting adaptation in sectors like farming and forestry, and promoting Scotland as an innovation hub for adaptation solutions. This approach seeks to ensure Scotland’s economy remains competitive and resilient whilst capitalising on emerging opportunities. Figure 6 presents SNAP3’s pathway from objectives to outcome and impact for Economy, Business and Industry.[6]
Considerations for indicator selection
Following the desk-based review and stakeholder engagement, several considerations emerged regarding indicator selection for the Economy, Business and Industry outcome:
- Investments in climate resilience, with a specific taxonomy for adaptation-related investment, was considered a potential indicator. Such a taxonomy would prove a useful indicator for how the economy is adapting to climate change. However, while initiatives are emerging, this has not been fully implemented at national level yet. It is something to consider for inclusion in the next SNAP.
- The direct economic loss associated with climate-related hazards, such as flooding was considered. Some stakeholders felt that many businesses could be reluctant to invest in resilient infrastructure because its benefits are not easily quantified. Capturing direct loss associated with climate-related hazards helps industries understand the value of investments in adaptation. Nevertheless, no viable dataset currently exists for such an indicator in the Scottish context.
- An indicator on green jobs is included in the indicator set. However, it does not capture the development of adaptation skills needed by existing Scottish businesses to address the challenges of climate change. Training employees to increase adaptation knowledge and skills specific to the needs of individuals or businesses is an important aspect that is not captured as no viable dataset currently exists.
- Sustainable practice in the agriculture sector is the focus of one indicator, given it accounts for 69% of Scotland’s total land use. Another area of the economy initially considered was the forestry sector. An indicator “percentage of certified woodland area in Scotland” was considered. However, considering that certification mostly applies to woodlands used for timber production and not woodlands more generally, the coverage of this indicator was considered too limited.
- The proportion of agricultural land categorised as High Nature Value (HNV) Farming has initially been chosen as a proxy of adaptation to climate change in agriculture in Scotland. High Nature Value (HNV) Farming is an indicator used to identify agricultural systems that support high levels of biodiversity through low-intensity, traditional farming practices. HNV farms are more likely to be resilient to climate variability and extreme weather events. However, this indicator was not selected because the latest baseline is from 2013 and has not been updated since then. Should new data become available this indicator could be reviewed in the future.
- Capturing innovation in Scotland’s economy was considered as an important aspect of this outcome. However, given the broad scope, complexity and subjectivity around what constitutes innovation, it is a difficult aspect to capture in a single quantitative indicator and is, therefore, not included.
Economy, Business and Industry – proposed indicators
It is important that the indicators cover the preparedness and adaptation of businesses and industries and the extent into which they take advantage of economic opportunities linked to climate change. The five indicators selected cover business preparedness and action using data periodically recorded by the Business Insights and Conditions Survey. The use of Office of National Statistics (ONS) data on green jobs provides an indicator for the transition towards a climate-smart economy and workforce skills development for the green economy. Another indicator focused specifically on adaptation action in the agricultural sector, which is a significant part of the Scottish economy. Taken together, this set of indicators uses available data to provide a broad indication of whether Scotland’s economy is adapting to climate change. Nevertheless, there are some key aspects that are not covered. These include levels of investment in climate adaptation initiatives and economic resilience (e.g., economic loss related to climate-related hazards) as well as the level of innovation from businesses in responding to climate risks.
The proposed indicators are:
- Proportion of businesses monitoring climate-related risks
- Proportion of businesses taking action to adapt to the effects of climate change
- Number of green jobs
- Uptake of grants for agriculture storage reservoirs and off-season storage lagoons.
Below we present the baseline information for each of the five indicators proposed to monitor the Economy, Business and Industry outcome. For each indicator, we provide the baseline value, a description of the baseline, the recent trend and desired trend for each indicator to provide context. More information on baseline data is available in Annex 5. This is followed by a further detailed summary of each indicator and the rationale for their inclusion.
Economy, Business and Industry – baseline
Proportion of businesses monitoring climate related risks
- Description: In 2023, 15.6% of Scotland businesses have assessed risks for supply chain disruption and distribution, 6.2% for increased flooding and 4.4% for temperature increase.
- Recent trends: August 2023 was the first time the question related to businesses monitoring climate related risks was asked.
- Baseline:
- Supply chain disruption: 15.6%
- Increased flooding: 6.2%
- Temperature increase 4.4%
- Desired trend: Increase
Proportion of businesses taking action to adapt to the effects of climate change
- Description: In 2023, 26.5% of Scotland businesses have taken action to adapt supply chain disruption and distribution, 11.5% to adapt to increased flooding and 4.4% to adapt to temperature increase.
- Recent trends: August 2023 was the first time the question related to businesses taking adaptation action was asked.
- Baseline:
- Supply chain disruption: 25.6%
- Increased flooding: 11.5%
- Temperature increase 5.7%
- Desired trend: Increase
Number of green jobs
- Description: In 2022, Scotland employment in green jobs in 2022 was estimated at 46,200 full-time equivalents (FTEs).
- Recent trends: This number has increased yearly since 2015 (32,800 FTE), except between 2021 and 2022.
- Baseline: 46,200
- Desired trend: Increase
Uptake of grants for agriculture irrigation lagoons
- Description: In 2024, 5 AECS applications for irrigation lagoons were successful. 14 applications were submitted.
- Recent trends: the number of applications submitted and successful are usually between 0 and 2 per year.
- Baseline: 5
- Desired trend: Increase
Economy, Business and Industry – indicator summaries
Business awareness of climate adaptation
|
Indicator |
Proportion of businesses monitoring climate related risks |
|
Description |
This indicator is a survey question from the Business Insights and Conditions Survey. |
|
Data holder |
Office for National Statistics |
|
Unit |
% |
This indicator captures the level of knowledge and awareness of climate-related risks by businesses. Ensuring businesses across Scotland are aware of the risks that climate change may pose to their operations, premises, staff, and supply chains is a crucial component of a climate resilient economy (Linnenluecke et al., 2013; Surminski, 2013).
Business preparedness in climate adaptation
|
Indicator |
Proportion of businesses taking action to adapt to the effects of climate change |
|
Description |
This indicator is a survey question from the Business Insights and Conditions Survey. |
|
Data holder |
Office for National Statistics |
|
Unit |
% |
This indicator captures businesses’ capacity to respond to the risks posed by climate change. Ensuring businesses across Scotland have a plan to face the risks climate change may pose to their operations, premises, staff and supply chains will be crucial to building a more climate resilient economy (Linnenluecke et al., 2013; Surminski, 2013).
Green jobs in the Scottish economy
|
Indicator |
Total Scotland employment in green jobs |
|
Description |
This indicator looks at green jobs, as defined as “employment in an activity that contributes to protecting or restoring the environment, including those that mitigate or adapt to climate change”; they can be estimated using industry, occupation, and firm approaches. This indicator follows an industry-based approach which includes all jobs in a green industry or sector and provides our headline estimate of employment in green jobs. |
|
Data holder |
Office for National Statistics |
|
Unit |
Number |
This indicator monitors the adaptation opportunity in Scotland’s Just Transition as it directly tracks employment in environmentally sustainable sectors. This indicator reflects the economic growth and industry shift towards sustainable practices, essential for climate adaptation and effective Just Transition (Martinez-Fernandez et al., 2010).
Agriculture water-use efficiency
|
Indicator |
Uptake of grants for agriculture irrigation lagoons |
|
Description |
This indicator follows the number of applied and approved agricultural projects (AECS) to improve water-use efficiency by collecting and storing water in an irrigation lagoon. |
|
Data set holder |
Scottish Government |
|
Unit |
Number of applications and approved grants |
This indicator represents proxy of adaptation by the agricultural sector. Improving water storage efficiency through irrigation lagoons is a strategic adaptation measure that addresses several challenges posed by climate change: it helps mitigate the variability of rainfall patterns and allow farmers to store water during periods of excess rainfall to ensure a steady water supply for crops. It will also contribute to reduce the stress on Scotland’s water resources and reduce flood risk at times by capturing and storing excess rainfall runoff (Schmitt et. al., 2022).
Discussion
Conclusions
Climate adaptation is complex and multifaceted, spanning across sectors and scales. Therefore, MEL of climate adaptation will always be challenging. Nevertheless, monitoring the extent to which an adaptation plan’s outcomes are achieved is essential to understand the effectiveness of its associated activities and policies. Ultimately, efforts to monitor adaptation plans, such as SNAP3, must navigate this complexity, seeking a balance of indicators that is relevant, robust, and practical to implement. We have sought to achieve this balance by taking a systematic approach to the selection of indicators through desk-based review and extensive engagement with stakeholder groups across Scottish governmental departments and associated organisations. The assessment has been grounded in the practical reality of what data is available rather than theoretically ideal indicators.
In relation to the relevance and robustness of indicators, we have developed outcome indicators that efficiently capture most of the core elements of four of SNAP3’s outcomes.
For the Nature Connects outcome, the indicators proposed cover ecological connectivity, ecological health, and urban-nature connection. Taken together, these indicators will provide useful insights on progress in securing the resilience of Scotland’s natural ecosystems to climate change. Lack of an indicator specifically for marine ecosystems, due to inadequate available data, is a key, is a key limitation.
For the Communities outcome, capturing health and equity in high-level, generalised indicators was challenging due to the complexity of these issues. Therefore, the proposed indicators focus on monitoring community action of relevance to climate adaptation.
For the Public Services outcome, the proposed indicators focus upon collaboration and adaptation actions at a high-level. It was impractical to address the effectiveness of actions, as the number of different sectors associated with this outcome would result in numerous indicators.
For the Economy, Business, and Industry outcome, the indicators proposed cover areas of business preparedness and action, the extent of the transition to green economy, and the extent to which an important sector of the economy (agriculture) is undertaking climate adaptation. While acknowledging that the level of investment in climate adaptation initiatives and economic losses resulting from climate-related hazards is not addressed, these indicators will still provide useful insights about the delivery of this outcome.
Regarding practical implementation, the proposed indicators redeploy established indicators that, crucially, are based on accessible data. Most are publicly reported, although some require correspondence with the relevant Scottish Government data holder. The proposed indicators allow for a baseline to be established at the start of SNAP3 and then reported against after a five-year period. There is variation on the extent of historic data available across the indicators; there; there is more extensive data on previous trends for some than others. Importantly, we believe the relevance of proposed indicators is clear and they are straightforward to apply. As such, they can be used at the end of the five-year period by those who have not been closely involved in their development.
The stakeholder engagement process was critical in the development of the outcome indicators. A wide range of relevant stakeholders across Scotland engaged in one-to-one calls, workshops or written feedback to provide insights both conceptually on what indicators might capture SNAP3 outcomes and practically on what data are available. This engagement provided sector- and topic-specific knowledge, as well as offering validation of the final proposed set of indicators. Several themes emerged from this process of engagement. First, there was an inherent tension between what is ideal and what is possible. Discussions sometimes veered more towards enthusiasm about theoretically ideal indicators that monitor outcomes rather than being grounded in the practical reality of what data is available. While this certainly did not negate the importance of discussing ideal indicators, it was important to ensure, insofar as possible, that an onus on what is practically possible influenced the discussion.
Second, often data limitations lay at the heart of challenges regarding identification of suitable indicators. The limitations took different forms: no data existed (e.g., economic loss from climate-related hazards); it was insufficiently captured (e.g., marine species’ abundance); or it was not easy to access or publicly available (e.g., data on Build Back Better grants). It is not uncommon for data limitations to be a significant obstacle to developing indicators for climate adaptation (Vallejo, 2017).
Third, the SNAP3 outcomes are structured in a clearly defined way, which was beneficial for developing the set of proposed indicators, these outcomes overlap in ways that should be acknowledged. One example relates to the Communities outcome and the Public Services outcome, as collaboration is of significance for both community resilience and for effective public services. Hence, community actors and public service actors cannot be clearly distinguished from each other. Another example is the emphasis of Nature Connects outcome on access to green space and associated health benefits that overlaps with the community health and wellbeing aspects of the Communities outcome. Such overlaps are not inherently problematic but did point to the need for the net to be cast as wide as possible when considering stakeholder engagement for when identifying indicators.
Recommendations
Several recommendations and next steps emerge from this work. It is important to finalise the outcome indicators for SNAP3 as soon as possible, as applying these indicators consistently will be crucial to enable meaningful comparisons against the baseline. Any changes made to individual indicators or the data that underpin them may compromise the ability to track progress consistently relative to the baseline. Furthermore, it is important to maintain continuity, quality and availability of data required by each indicator. It is vital to maintain the allocation of resources to the collection, maintenance and accessibility of datasets used by the indicators across all relevant Scottish Government departments.
Whilst the indicators represent a complete and operational indicator set, there should be a flexibility regarding potential for additional indicators. New indicators may be added in the immediate term if relevant data becomes available. For example, an ecosystem functions indicator for Nature Connects or a green finance investment indicator for Economy, Business, and Industry are anticipated in the near future. While the suite of indicators addresses the needs for monitoring the outcomes of SNAP3, it may be viewed as a foundation to build upon regarding monitoring of SNAP4.
Lastly, we recommend establishing a working group to sustain the functioning of the indicators. The working group could comprise key stakeholders and data providers who could meet annually to review the functioning of the indicators and address any issues regarding their deployment, e.g., continuity and availability of data and its quality. Furthermore, this working group would build on the strong interest evident across a wide range of stakeholders to engage in the topic of climate adaption MEL.
References
Agrawal, A. (2008). The role of local institutions in adaptation to climate change. In Social Dimensions of Climate Change: Equity and Vulnerability in a Warming World (pp. 173-198). World Bank.
Beauchamp, E. & Józefiak, I., 2023. Breaking the Glass Ceiling at COP 28: Four key elements to ensure a successful global goal on adaptation. International Institute for Sustainable Development. Available at: https://www.iisd.org/publications/report/global-goal-on-adaptation-monitoring-evaluation-learning-framework-cop-28 [Accessed 16 July 2024].
Beauchamp, E., Leiter, T., Pringle, P., Brooks, N., Masud, S., and Guerdat, P., 2024. Toolkit for Monitoring, Evaluation, and Learning for National Adaptation Plan Processes. NAP Global Network. Available at: https://www.adaptation-undp.org/sites/default/files/resources/internal_brief_transparency-mrv-me-april202249_adjusted_doc_revised.pdf [Accessed 16 July 2024].
Berry, H. L., Waite, T. D., Dear, K. B., Capon, A. G., & Murray, V. (2018). The case for systems thinking about climate change and mental health. Nature Climate Change, 8(4), 282-290.
Biden, A., 2022. 5 Smart Indicators in Monitoring and Evaluation. tools4dev. Available at: https://tools4dev.org/blog/smart-indicators-in-monitoring-and-evaluation/ [Accessed 16 July 2024].
Climate Change Committee (CCC), 2022, Is Scotland Ready? 2022 Report to Scottish Parliament. Available at: https://www.theccc.org.uk/publication/asc-writes-to-scottish-government-about-outcomes-based-approach-for-the-sccap/
Climate Change Committee, 32023. Adapting to climate change – Progress in Scotland. Climate Change Committee. Available at: https://www.theccc.org.uk/publication/adapting-to-climate-change-progress-in-scotland/ [Accessed 16 July 2024].
Demuzere, M., Orru, K., Heidrich, O., Olazabal, E., Geneletti, D., Orru, H., Bhave, A.G., Mittal, N., Feliu, E. & Faehnle, M. (2014) Mitigating and adapting to climate change: multi-functional and multi-scale assessment of green urban infrastructure, Journal of Environmental Management, 146, pp. 107–115.
Food and Agriculture Organization of the United Nations (FAO), 2017. Tracking adaptation in agricultural sectors. FAO. Available at: https://www.fao.org/policy-support/tools-and-publications/resources-details/en/c/1193260/ [Accessed 16 July 2024].
Global Environmental Facility (GEF), 2016. Monitoring and Evaluation of Climate Change Adaptation. Global Environment Facility. Available at: https://www.thegef.org/sites/default/files/council-meeting-documents/EN_GEF.STAP_.C.51.Inf_.03_M%26E_of_CCA.pdf [Accessed 16 July 2024].
Gabbatiss, J. & Lempriere, M., 2024. Bonn climate talks: Key outcomes from the June 2024 UN climate conference. Carbon Brief. Available at: https://www.carbonbrief.org/bonn-climate-talks-key-outcomes-from-the-june-2024-un-climate-conference/ [Accessed 16 July 2024].
Gill, S. E., Handley, J. F., Ennos, A. R., & Pauleit, S. (2007). Adapting cities for climate change: the role of the green infrastructure. Built Environment, 33(1), 115-133.
Haddad, N.M., Brudvig, L.A., Clobert, J., Davies, K.F., Gonzalez, A., Holt, R.D., Lovejoy, T.E., Sexton, J.O., Austin, M.P., Collins, C.D., Cook, W.M., Damschen, E.I., Ewers, R.M., Foster, B.L., Jenkins, C.N., King, A.J., Laurance, W.F., Levey, D.J., Margules, C.R., Melbourne, B.A., Nicholls, A.O., Orrock, J.L., Song, D.X. & Townshend, J.R. (2015) Habitat fragmentation and its lasting impact on Earth’s ecosystems, Science Advances, 1(2), e1500052
Krosby, M., Tewksbury, J., Haddad, N. M., & Hoekstra, J. (2010). Ecological connectivity for a changing climate. Conservation Biology, 24(6), 1686-1689.
Linnenluecke, M.K., Griffiths, A. & Winn, M.I. (2013) Firm and industry adaptation to climate change: a review of climate adaptation studies in the business and management field, Wiley Interdisciplinary Reviews: Climate Change, 4(5), pp. 397–416.
Maas, J., Verheij, R.A., Groenewegen, P.P., de Vries, S. & Spreeuwenberg, P. (2006) Green space, urbanity, and health: how strong is the relation?, Journal of Epidemiology & Community Health, vol. 60, no. 7, pp. 587–592.
Mäkinen, K., Prutsch, A., Karali, E., Leitner, M., Völler, S., Lyytimäki, J., Pringle, P., and Vanneuville, W., 2018. Indicators for adaptation to climate change at national level – Lessons from emerging practice in Europe. European Topic Centre on Climate Change impacts, Vulnerability and Adaptation (ETC/CCA) Technical paper 2018/3. DOI: 10.25424/CMCC/CLIMATE_CHANGE_ADAPTATION_INDICATORS_2018.
Marshall, N. A., Park, S. E., Howden, S. M., Dowd, A. B., & Jakku, E. S. (2013). Climate change awareness is associated with enhanced adaptive capacity. Agricultural Systems, 117, 30-34.
Martinez-Fernandez, C., Hinojosa, C. & Miranda, G. (2010) Green jobs and skills: The local labour market implications of addressing climate change, OECD Local Economic and Employment Development (LEED) Working Papers, 2010/02, OECD Publishing, Paris.
McEwen, L., Jones, O. & Robertson, I. (2014), ‘A glorious time?’ Some reflections on flooding in the Somerset Levels, The Geographical Journal, 180(4), pp. 326-337.
McGranahan, G., Balk, D., & Anderson, B. (2007). The rising tide: assessing the risks of climate change and human settlements in low elevation coastal zones. Environment and Urbanization, 19(1), 17-37.
Moss, A., 2019. A monitoring and evaluation framework for the second SCCAP. ClimateXChange. Available at: https://www.climatexchange.org.uk/publications/a-monitoring-and-evaluation-framework-for-the-second-sccap/ [Accessed 16 July 2024].
New, M., Reckien, D., Viner, D., Adler, C., Cheong, S.-M., Conde, C., Constable, A., Coughlan de Perez, E., Lammel, A., Mechler, R., Orlove, B., and Solecki, W., 2022. Decision-Making Options for Managing Risk. In: Pörtner, H.-O., Roberts, D.C., Tignor, M., Poloczanska, E.S., Mintenbeck, K., Alegría, A., Craig, M., Langsdorf, S., Löschke, S., Möller, V., Okem, A., and Rama, B. (eds.) Climate Change 2022: Impacts, Adaptation and Vulnerability. Contribution of Working Group II to the Sixth Assessment Report of the Intergovernmental Panel on Climate Change. Cambridge University Press, Cambridge, UK and New York, NY, USA, pp. 2539–2654, doi:10.1017/9781009325844.026.
Organisation for Economic Co-operation and Development (OECD), 2015. National Climate Change Adaptation: Emerging Practices in Monitoring and Evaluation. OECD Publishing, Paris. Available at: http://dx.doi.org/10.1787/9789264229679-en [Accessed 16 July 2024].
Peter, S., & Peter, F., 2009. Evaluation of Indicators for EU Policy Objectives. Ecologic Institute. Available at: https://www.ecologic.eu/sites/default/files/publication/2016/1901-research_note-d2-1-evaluation-of_indicators-for-eu-policy-objectives-2009.pdf [Accessed 16 July 2024].
Palinkas, L. A., & Wong, M. (2020). Global climate change and mental health. Current Opinion in Psychology, 32, 12-16
Palmer, M. A., Lettenmaier, D. P., Poff, N. L., Postel, S. L., Richter, B., & Warner, R. (2009). Climate change and river ecosystems: protection and adaptation options. Environmental Management, 44(6), 1053-1068.
Runhaar, H., Wilk, B., Persson, Å., Uittenbroek, C., & Wamsler, C. (2018). Mainstreaming climate adaptation: taking stock about ‘what works’ from empirical research worldwide. Regional Environmental Change, 18, 1201-1210.
Sayers, PB., Lindley. S, Carr, S and Figueroa-Alfaro, R. W, 2021. The impacts of climate change on population groups in Scotland. Research undertaken by Sayers and Partners in association with the University of Manchester for ClimateXChange.
Schmitt, R.J. P., Rosa, L., Daily, G. (2022), ‘Global expansion of sustainable irrigation limited by water storage’, Proceedings of the National Academy of Sciences, 119 (47), https://doi.org/10.1073/pnas.2214291119.
Shi, J., Visschers, V.H.M., Siegrist, M. & Arvai, J. (2016) Knowledge as a driver of public perceptions about climate change reassessed, Nature Climate Change, 6, pp. 759–762.
Surminski, S. (2013) Private-sector adaptation to climate risk, Nature Climate Change, 3(11), pp. 943–945.
United Nations Development Programme (UNDP), 2022. Transparency, MRV, and M&E. United Nations Development Programme. Available at: https://www.adaptation-undp.org/sites/default/files/resources/internal_brief_transparency-mrv-me-april202249_adjusted_doc_revised.pdf [Accessed 16 July 2024].
United Nations Framework Convention on Climate Change (UNFCCC), 2024. Synthesis of submissions on the UAE – Belém work programme on indicators, Advance Unedited Version. UNFCCC. Available at: https://unfccc.int/documents/638384 [Accessed 16 July 2024].
United Nations Framework Convention on Climate Change (UNFCCC), 2023. Draft technical paper on monitoring and evaluation of adaptation at the national and subnational level (AC22). UNFCCC. Available at: https://unfccc.int/sites/default/files/resource/ac22_7c_monitoring_evaluation.pdf [Accessed 16 July 2024].
United States Environmental Protection Agency (EPA), 2017, . Development of a Climate Resilience Screening Index (CRSI): An Assessment of Resilience to Acute Meteorological Events and Selected Natural Hazards. EPA. Available at: https://cfpub.epa.gov/si/si_public_record_report.cfm?dirEntryId=335758 [Accessed 16 July 2024].
Vallejo, L. (2015). Insights from national adaptation monitoring and evaluation systems. In Mullan, M., Kingsmill, N., Agrawala, S. & Kramer, A.M. (eds) National Adaptation Planning: Lessons from OECD Countries. Springer, Cham. Available at: https://www.oecd.org/en/publications/2017/06/insights-from-national-adaptation-monitoring-and-evaluation-systems_d2e677fe.html [Accessed 16 July 2024].
Watson, J. E. M., Dudley, N., Segan, D. B., & Hockings, M. (2014). The performance and potential of protected areas. Nature, 515, 67-73.
Annexes
Annex 1 – Policies reviewed
The following policies were reviewed for sectorial indicators that could be relevant for the SNAP3 outcome indicators.
Scottish policies listed in the draft SNAP3 for the outcome area “Nature connects across our lands, settlements, coasts and seas”:
|
|
Scottish policies listed in the draft SNAP3 for the outcome area “Communities creating climate-resilient, healthy and equitable places”:
Scottish policies listed in the draft SNAP3 for the outcome area “Public services are collaborating in effective, inclusive adaptation action”:
Scottish policies listed in the draft SNAP3 for the outcome area “Economies and industries are adapting and realising opportunities in Scotland’s Just Transition”:
Annex 2 – Initial longlist of indicators
The initial longlist of indicators is listed below. This longlist was shared with stakeholders and revised through engagement as described in section 2.
Initial longlist of indicators for the outcome area “Nature connects across our lands, settlements, coasts and seas”:
|
|
|
|
|
|
|
|
|
|
|
|
Initial longlist of indicators for the outcome area “Communities creating climate-resilient, healthy and equitable places”:
|
|
|
|
|
|
|
|
|
|
|
Initial longlist of indicators for the outcome area “Public services are collaborating in effective, inclusive adaptation action”:
|
|
|
|
|
|
|
|
|
|
|
|
|
|
Initial longlist of indicators for the outcome area “Economies and industries are adapting and realising opportunities in Scotland’s Just Transition”:
|
|
|
|
|
|
|
|
|
|
Annex 3 – Workshop participation
The following organisations participated in the workshops.
Organisations represented in the workshop “Nature connects across our lands, settlements, coasts and seas”:
- Centre of Expertise for Waters
- Edinburgh Council
- Forestry and Land
- Glasgow City Council
- Highlands and Islands Airports
- James Hutton Institute
- Marine Directorate of Scottish Government
- National Centre for Resilience
- Nature Scot
- Public Health Scotland
- SEPA
- Scottish Government
- Scottish Water
- Sniffer
Organisations represented in the workshop “Communities creating climate-resilient, healthy and equitable places”:
- FloodRe
- Glasgow City Council
- National Centre for Resilience
- National Resilience Scotland
- Nature Scot
- Public Health Scotland
- Scottish Dynamic Coast
- Scottish Flood Forum
- Scottish Government
- Scottish Land Commission
- Scottish Waters
- Sniffer
- Strathclyde University
Organisations represented in the workshop “Public services are collaborating in effective, inclusive adaptation action”:
- Climate Change Committee
- Glasgow City Council
- MET Office
- Nature Scot
- Network Rail
- Public Health Scotland
- SEPA
- Scottish Flood Forum
- Scottish Government
- Scottish Water
- Sniffer
- Transport Scotland
- University of Strathclyde
Organisations represented in the workshop “Economies and industries are adapting and realising opportunities in Scotland’s Just Transition”:
- Climate Change Committee
- Forestry and Land Scotland
- Glasgow City Council
- Marine Directorate of Scottish Government
- Scottish Government
- SEPA
- Scottish Water
- Sniffer
Annex 4 – Indicator criteria
OUTCOME: Nature connects across our lands, settlements, coasts, and seas
ECOSYSTEM HEALTH AND CONNECTIVITY
Habitat Connectivity Index
|
Criterion |
Rating |
Assessment |
|
Adaptation Relevance |
Green |
This indicator addresses habitat connectivity and quality, which are important aspect for assessing the vulnerability of ecosystems to climate change. By evaluating how well species can move and adapt to changing conditions, the indicator provides valuable insights into the adaptive capacity of habitats. |
|
Representativeness |
Amber |
The indicator covers four key types of habitats: Woodland, Heathland, Grassland, and Fen/Marsh/Swamp – habitats that are representative of the broader landscape and crucial for maintaining ecological functions and services. However, the indicator does not cover freshwater, marine and coastal environments, and therefore has some limitations in its representativeness of indicating ecological health and connectivity. |
|
Data Availability |
Amber |
Data is collected by NatureScot. Data for CSGN area is publicly available on NatureScot’s website. However, data for the whole Scotland is provided directly by NatureScot and is not published online. |
|
Sensitivity |
Amber |
Updating this indicator every five years is considered a sensible frequency to observe meaningful changes in habitat connectivity. There may be a lag in reporting years, with data being published on average 2 years after. The up-to-date data may therefore not be available immediately at the end of the Plan. |
|
Understanding |
Green |
This indicator on habitat connectivity can be widely understood by a broad range of stakeholders in relation to improved ecological health and associated resilience. |
|
Baseline |
Green |
The indicator was last updated in 2022 for semi-natural grassland, heathland, and semi-natural woodland. Baseline maps are available on the Nature Scot website, providing a reference point for measuring changes over time. These baselines are crucial for assessing the progress and effectiveness of adaptation measures. The metric uses to calculate the habitat connectivity it is the Equivalent Connected Area (Probability of Connectivity), the ECA (PC). |
|
Practicality |
Green |
The data is publicly available and detailed by catchment area, making it practical for use in planning and decision-making processes. This accessibility ensures that stakeholders can utilize the information to enhance habitat connectivity and support climate adaptation strategies. The practical application of this data supports localized adaptation efforts and helps to mitigate the impacts of climate change on biodiversity and ecosystem services. |
Proportion of surface water bodies classified in good or better condition
|
Criterion |
Rating |
Assessment |
|
Adaptation relevance |
Green |
This indicator is relevant for climate adaptation as it addresses the quality and health of water ecosystems, which are critical for reducing vulnerability and enhancing adaptive capacity. By tracking the proportion of water bodies in good or high condition, this indicator provides insights into the resilience of water ecosystems and their capacity to adapt to changing climatic conditions. |
|
Representativeness |
Amber |
The indicator is broadly effective for monitoring ecological health as it encompasses key aspects of ecosystem quality. Although it has limitations due to its primary focus on surface water bodies, it can be used as a useful proxy for the status of broader ecological and biodiversity conditions. |
|
Data availability |
Green |
Full GIS data for this indicator is available on the SEPA website, ensuring that data is current and reliable. The data is updated every year by SEPA. |
|
Sensitivity |
Green |
Changes in water quality and ecosystem health can be noted over a five-year timescale interventions. |
|
Understanding |
Green |
This indicator on water quality can be widely understood by a broad range of stakeholders in relation to improved ecological health and associated resilience. |
|
Baseline |
Green |
The indicator is publicly available on SEPA’s website has an established baseline from 2007 to 2022. |
|
Practicality |
Green |
Statistical and mapping data for this indicator is already being collected and publicly accessible, making it practical to monitor as an indicator. |
Proportion of Scotland’s protected sites in favourable condition
|
Criterion |
Rating |
Assessment |
|---|---|---|
|
Adaptation relevance |
Green |
Protected sites play a role in improving the adaptive capacity of vulnerable species by providing safe havens with the functional network that species can migrate from or too. This indicator is relevant for climate adaptation as it directly relates to the resilience of ecosystems and their ability to adapt to changing environmental conditions. |
|
Representativeness |
Amber |
While the indicator is a useful proxy for ecological health and connectivity, its limitation should be noted. The indicator does not include offshore marine sites and features in Scotland beyond 12 nautical miles, and primarily focuses on protected sites and not all natural sites, which may limit its representativeness of the broader ecological health and connectivity. |
|
Data availability |
Green | |
|
Sensitivity |
Amber |
The indicator has shown longer-term changes, though it may not reflect notable changes within shorter periods, such as from 2023 to 2024. While a five-year timescale may be too short to observe long-term trends, the indicator is suitable to detect significant changes over longer periods. |
|
Understanding |
Green |
This indicator on condition of protected sites can be widely understood by a broad range of stakeholders in relation to improved ecological health and associated resilience. |
|
Baseline |
Green |
The indicator has an established baseline from 2005 to 2024, with historical data available for comparison. |
|
Practicality |
Green |
Statistical and mapping data for this indicator is already being collected and publicly accessible, making it practical to monitor as an indicator. |
Proportion of soft shorelines affected by coastal erosion
|
Criterion |
Rating |
Assessment |
|
Adaptation relevance |
Green |
Monitoring the extent of coastal erosion is relevant to climate adaptation as it reflects the efficacy of implemented adaptation measures in enhancing coastal resilience. |
|
Representativeness |
Green |
This indicator represents the coastal component of the Nature Connects outcome of the SNAP3. |
|
Data availability |
Amber |
Data is publicly available, however, it is not specifically stated how long the programme hosting the data is running for. |
|
Sensitivity |
Green |
Changes in this indicator are sufficient sensitive to the time-period of SNAP3. |
|
Understanding |
Green |
The connection between the extent of coastal erosion as a proxy for coastal adaptation to climate change is generally recognised. |
|
Baseline |
Green |
Baseline data available from 2017 and 2021. |
|
Practicality |
Green |
The indicator is publicly available on the Center of Expertise for Waters (CREW) website. It has been developed under the Dynamic Coast project. |
URBAN GREEN INFRASTRUCTURE
Extent of green-blue land cover in urban areas
|
Criterion |
Rating |
Assessment |
|---|---|---|
|
Adaptation relevance |
Green |
Green-blue land cover in urban areas reflects the extent of natural spaces in cities that provide crucial ecosystem services. It is relevant for climate adaptation as it captures how well cities are prepared to adapt to the challenges posed by climate change, making urban environments more sustainable and liveable. |
|
Representativeness |
Amber |
This indicator offers a good coverage of Scotland, with urban areas defined as those with a population more than 500. It covers public and private greenspaces, including woodland, open semi-natural, inland water, beach or foreshore, and manmade surface. It also distinguishes the different functions of greenspaces, such as public park or garden, school grounds, private garden, allotments, playing fields, etc. However, it does not cover the tree canopy over hard surfacing or green roofs, which are also relevant in terms of adaptation. |
|
Data availability |
Amber |
This dataset “OS MasterMap Greenspace Layer” is updated every 6 months by Ordnance Survey, but requires a licence to access it. |
|
Sensitivity |
Green |
Land use modification in urban areas can be noted over a five-year timescale. |
|
Understanding |
Green |
This indicator on green-blue land cover in urban areas can be widely understood by a broad range of stakeholders in relation to the extent of natural spaces in cities associated with resilience. |
|
Baseline |
Green |
This dataset “OS MasterMap Greenspace Layer” can be purchased on the Ordnance Survey website |
|
Practicality |
Amber |
Data is available in ESRI Shapefile, GML 3.2.1, GeoPackage and Vector Tiles format. The GIS map has to be purchased and analysed to be transformed to actual percentage. |
Proportion of adults who live within a five-minute walk of their nearest green or blue space
|
Criterion |
Rating |
Assessment |
|---|---|---|
|
Adaptation relevance |
Amber |
The indicator captures the distance to the nearest public or open space, but does not reflect the level of accessibility, the perception of safety people have toward the green and blue spaces nor the frequency of access. |
|
Representativeness |
Green |
The figures for this indicator come from the Scottish Household Survey (SHS). It covers the whole Scottish territory and includes people resident in Scotland aged 16 and over. The SHS sample has been designed to allow annual publication of results at Scotland level and for local authorities. To meet these requirements, the target sample size for Scotland was 10,450 household interviews with a minimum local authority target of 250. |
|
Data availability |
Green |
The data is published annually in the Scottish Household Survey Annual Report. |
|
Sensitivity |
Amber |
Changes in the proportion of adults who live within a five-minute walk of their local green or blue space can be noted over a five-year timescale. There is a lag in reporting years up to a maximum of one year (e.g. 2024 fieldwork ending in January 2025 with publication of results later in 2025) The up-to-date data will therefore not be available immediately at the end of the Plan. |
|
Understanding |
Green |
This indicator can be widely understood by a broad range of stakeholders. |
|
Baseline |
Green |
The figures for this indicator come from the Scottish Household Survey (SHS) which is a National Statistics product produced by the Scottish Government. This indicator is also part of the National Performance Framework. |
|
Practicality |
Green |
Statistical data for this indicator is already being collected and publicly accessible, making it practical to monitor as an indicator. |
OUTCOME: Communities are creating climate-resilient, healthy and equitable places.
Community awareness around climate change
|
Criterion |
Rating |
Assessment |
|
Adaptation relevance |
Amber |
This indicator is relevant for climate adaptation as it improves community adaptive capacity through knowledge enhancement. By understanding what actions are necessary to tackle climate change and recognizing the urgency of these actions, communities can better prepare for and respond to climate impacts. This knowledge reduces vulnerability and increases resilience. However, the question asked does not specifically address the impacts of climate change, the criteria is therefore orange. |
|
Representativeness |
Green |
The survey provides useful snapshot on the awareness and knowledge of communities around climate change. The SHS sample has been designed to allow annual publication of results at Scotland level and for local authorities. To meet these requirements, the target sample size for Scotland was 10,450 household interviews with a minimum local authority target of 250. |
|
Data availability |
Green |
The Scottish Household Survey climate awareness and action questions are asked biennially on odd years. The results are publicly available. |
|
Sensitivity |
Amber |
This indicator is sensitive to changes for the purposes of SNAP3 monitoring, as observed the marked changes that occurred in public perception and knowledge between 2019-2022. There is a lag in reporting years up to a maximum of one year (e.g. 2024 fieldwork ending in January 2025 with publication of results later in 2025)The up-to-date data will therefore not be available immediately at the end of the Plan. |
|
Understanding |
Green |
There is a clear connection on how understanding climate actions and the urgency of these actions relate to progress in climate adaptation. |
|
Baseline |
Green |
The baseline data for this indicator is available since 2019, providing a reference point for measuring changes in community awareness and perception over time. |
|
Practicality |
Amber |
The Scottish Household Survey has been collecting data since 1999, making it a practical, cost-effective, and well-established method for gathering information. |
Community action on climate change
|
Criterion |
Rating |
Assessment |
|
Adaptation relevance |
Green |
Community climate action hubs will improve knowledge of communities and enhances the preparedness of communities. |
|
Representativeness |
Amber |
This indicator does not capture the quality of action and may therefore not be fully representative of the effectiveness of climate actions. While it shows the presence of CCAHs and LPPs, it does not measure the depth or impact of the actions taken through these hubs/plans. |
|
Data availability |
Green |
Data is held by the Scottish Government, and is publicly accessible on the Scottish Government website: Community climate action hubs: contact details – gov.scot (www.gov.scot) . |
|
Sensitivity |
Amber |
This indicator is sensitive to changes for the purposes of SNAP3 monitoring, as observed by marked changes that between 2019-2022. |
|
Understanding |
Green |
It is easy to see the connection between the existence and maintenance of CCAHs and LLPs as metrics for climate action, although it might not be clear what specific actions arise from these. |
|
Baseline |
Amber |
20 CCAHs as of June 2024 (81% of the council areas covered). |
|
Practicality |
Amber |
Information on LPPs is not located in one centralised place, so requires time and resource to obtain. |
Community flood resilience
|
Criterion |
Rating |
Assessment |
|
Adaptation relevance |
Green |
This indicator is relevant to climate adaptation progress as it indicates the implementation effectiveness of strategies to mitigate flood risks and enhance community resilience. |
|
Representativeness |
Green |
Flooding is considered a significant climate hazard, as outlined in the SNAP3, therefore an indicator that captures action for this is representative of climate-resilient communities. |
|
Data availability |
Green |
Updated data on progress will be publicly available in 2025 and 2028. Data will be published by the 14 lead local authorities in charge of local Flood Risk Management Plans, and information will be centralised by SEPA. |
|
Sensitivity |
Green |
Changes in this indicator are sufficiently sensitive to the time-period of SNAP3 monitoring. However, reports are not published annually so the up-to-date data will therefore not be available immediately at the end of the Plan. |
|
Understanding |
Green |
The extent that actions are taking place to manage the impacts of flooding are clear to understand for a wide audience. |
|
Baseline |
Amber |
Actions to reduce or avoid flood are collated by the 14 lead local authorities in charge of Local Flood management Plans in their Flood Management Plan assessment report. The latest report was published in 2021, and the next one is expected in December 2025. |
|
Practicality |
Green |
Data is easy to obtain and easy to use to understand progress. |
Community wellbeing
|
Criterion |
Rating |
Assessment |
|
Adaptation relevance |
Amber |
Not directly related to climate change adaptation, but the experience of the effects of climate change, for example a flooding event, and the capacity to adapt or react to it has a direct impact on mental health. This indicator highlights the intersection between mental wellbeing and climate resilience, showing how adaptive capacity influences community health. |
|
Representativeness |
Amber |
Wellbeing metrics are useful indicators of community health, however, health and its impacts from climate change are wide-ranging in scope. Therefore, there is ultimately limitations that must be acknowledged with this indicator when representing overall community health. |
|
Data availability |
Green |
Data is publicly available from Scottish Government. |
|
Sensitivity |
Amber |
Whilst minor changes have been observed since 2006, this does not necessarily point to a lack of sensitivity in relation to the information this indicator provides. There is a lag in reporting years, with data being published on average one year later. The up-to-date data will therefore not be available immediately at the end of the Plan. |
|
Understanding |
Amber |
Whilst the concept of mental wellbeing and its importance as a metric of community resilience is easy to understand, how this indicator relates to climate adaptation is not clear. |
|
Baseline |
Green |
The baseline data from 2022 shows a mean score of 47.0 on the WEMWBS scale. |
|
Practicality |
Green |
Data has been monitored since 2006, the established data collection processes ensure that this indicator can be consistently and reliably monitored. |
OUTCOME: Public services are collaborating in effective and inclusive adaptation action
Level of collaboration across public services
|
Criterion |
Rating |
Assessment |
|---|---|---|
|
Adaptation relevance |
Green |
Collaboration is vital component of climate adaptation planning. Effective collaboration can enhance adaptive capacity, reduce vulnerability, and ensure a cohesive, equitable response to climate change. |
|
Representativeness |
Amber |
While this indicator shows the level of participation and collaboration, it does not capture the quality or depth of progress in terms of collaboration. It measures quantity rather than the effectiveness of the collaborative actions being taken. |
|
Data availability |
Green |
Data on the participation of public bodies in the Public Climate Adaptation Network is publicly available from Adaptation Scotland and the Sustainable Scotland Network. |
|
Sensitivity |
Amber |
While the indicator data is sensitive enough for the purposes of SNAP3 monitoring, the number of public bodies participating to the Public Climate Adaptation Network is not expected to rise significantly because Adaptation Scotland’s strategy is to integrate few members at a time to insure their good and lasting integration into the network. For the Public bodies climate change duties reporting, there is a lag in reporting years, with data being published on average 1 year after. The up-to-date data will therefore not be available immediately at the end of the Plan. |
|
Understanding |
Green |
This indicator is widely understood with the importance of collaboration in climate adaptation is broadly recognised and easily communicated. |
|
Baseline |
Green |
The baseline data is from 2024 for the Public Climate Adaptation Network and from 2022/23 for the SSN report. |
|
Practicality |
Green |
Data is easy to obtain and utilise to monitor progress over the SNAP3 monitoring period. |
Level of adaptation actions across public services
|
Criterion |
Rating |
Assessment |
|
Adaptation relevance |
Green |
This indicator is highly relevant to adaptation, providing information on levels of risk assessments undertaken by public sector and the extent that adaptation action is taking place. |
|
Representativeness |
Green |
The indicator is representative insights on the extent public services are engaging in adaptation action. However, it only captures the level of risk assessment and action of public bodies subject to mandatory reporting. |
|
Data availability |
Green |
Data is collected annually, providing a regular update on the level of adaptation action across public services. Data is publicly available. |
|
Sensitivity |
Amber |
Changes in collaboration will likely be observed over a five-year time period. There is a lag in reporting years, with data being published on average 1 year after. The up-to-date data will therefore not be available immediately at the end of the Plan. |
|
Understanding |
Amber |
This indicator requires some understanding of SSN’s analytical framework (and subjective nature of assessment) but the concept of risk assessment is widely understood. |
|
Baseline |
Green |
The baseline for this indicator is established from data collected in 22022-3. |
|
Practicality |
Green |
Data is easy to obtain and utilise to monitor progress over the SNAP3 monitoring period. |
OUTCOME: Economies and industries are adapting and realising opportunities in Scotland’s Just Transition.
Business awareness of climate adaptation
|
Criterion |
Rating |
Assessment |
|
Adaptation relevance |
Green |
Business action in relation to adaptation can make them more resilient and prepared for climate hazards, thereby reducing vulnerability. |
|
Representativeness |
Amber |
This indicator represents well the business adaptation component of the Economy, Business and Industry outcome area. It should be noted that it represents businesses with 10 or more employees. |
|
Data availability |
Green |
Data is publicly available and reported on annually. |
|
Sensitivity |
Amber |
Notable changes in the number of business monitoring climate risks is observable in the five-year period. This question was asked in August 2023. There exists potential for it to be asked soon after the end of the plan and therefore no lag in reporting. |
|
Understanding |
Green |
There is a clear connection between the extent in which businesses are monitoring climate risks and how this relates to adapting economy, business and industry. |
|
Baseline |
Green |
Baseline data available from August 2023. |
|
Practicality |
Green |
Data is being captured by BICS already, and practical to use. |
Business preparedness in climate adaptation
|
Criterion |
Rating |
Assessment | |
|---|---|---|---|
|
Adaptation relevance |
Green |
Business action in relation to adaptation can make them more resilient and prepared for climate hazards, thereby reducing vulnerability. | |
|
Representativeness |
Amber |
This indicator represents well the business adaptation component of the Economy, Business and Industry outcome area. It should be noted that it represents businesses with 10 or more employees. | |
|
Data availability |
Green |
Data is publicly available and reported on annually. | |
|
Sensitivity |
Amber |
Notable changes in the number of business monitoring climate risks is observable in the five-year period. This question was asked in August 2023. There exists potential for it to be asked soon after the end of the plan and therefore no lag in reporting. | |
|
Understanding |
Green |
There is a clear connection between the extent in which businesses are monitoring climate risks and how this relates to adapting economy, business and industry. | |
|
Baseline |
Green |
Baseline data available from August 2023. | |
|
Practicality |
Green |
Data is being captured by BICS already, and practical to use. |
Green jobs in the Scottish economy
|
Criterion |
Rating |
Assessment |
|
Adaptation relevance |
Amber |
The green jobs definition signifies its relevance to adaptation. However, important to realise limitations around green jobs, for example – adaptation considered as thinking embedded into all businesses, and not just new jobs created. |
|
Representativeness |
Amber |
In its focus on employment/skills in relation to climate adaptation, this indicator represents well the business adaptation component of the Economy, Business and Industry outcome area. |
|
Data availability |
Green |
Data is publicly available and captured annually. It should be noted that this data is currently categorised as ‘official statistics in development’. This means the data is potentially subject to revision. However, as stated by the Office of National Statistics, this data, even when in development, is considered sufficient quality to be used.[7] |
|
Sensitivity |
Amber |
Changes in this indicator are sufficiently sensitive to the time-period of SNAP3 monitoring. There is a lag in reporting years, with data being published on average 2 years after (e.g. 2022 data was published in March 2024). The up-to-date data will therefore not be available immediately at the end of the Plan. |
|
Understanding |
Amber |
The connection between a ‘green job’ and its relevance to climate adaptation is potentially unclear, therefore terminology and definitions used must be clearly stated. |
|
Baseline |
Green |
Baseline data available between 2015-2022. |
|
Practicality |
Green |
Statistical data for this indicator is already being collected and publicly accessible, making it practical to monitor as an indicator. |
SUSTAINABLE PRACTICE IN THE AGRICULTURE SECTOR
Agriculture water-use efficiency
|
Criterion |
Rating |
Assessment |
|---|---|---|
|
Adaptation relevance |
Green |
Improve water use efficiency in agriculture increases the resilience of farms against several effects of climate change. |
|
Representativeness |
Amber |
The east of Scotland is more concerned by drought risk than the west of the country. Moreover, irrigation lagoons are large-scale projects, but other ways to increase water-use efficiency can also be implemented on farms and will not be captured by this indicator. |
|
Data availability |
Amber |
Data is captured annually by Scottish governmentGovernment but is not publicly available. |
|
Sensitivity |
Green |
Changes in this indicator are sufficiently sensitive to the time-period of SNAP3 monitoring. |
|
Understanding |
Green |
There is a clear connection between water use efficiency and adaptation in the agricultural sector. |
|
Baseline |
Green |
Data has been collated annually since 2015. |
|
Practicality |
Amber |
This information is not publicly available. |
Annex 5 – Baseline information for each indicator
|
Indicator |
Year |
Baseline |
Data source |
|
Nature Connects Nature connects across our lands, settlements, coasts, and seas | |||
|
Habitat Connectivity Index |
2020 |
Equivalent Connected Area (Probability of Connectivity) (ECA (PC)) values from 2020 are available for Scotland for semi-grassland, woodlands and heathland. The data used was the 2020 EUNIS Level 2 landcover map produced by Space Intelligence. To get an overall ECA (PC) value from the local authorities data, each value needs to be squared, the totals summed and then the square root taken. The total Equivalent Connected Area (Probability of Connectivity) (ECA (PC) value for Scotland was 35,570 ha for semi-grassland (2.9%), 5,655 ha for woodland (1.4%) and 214,277 ha for heathland (8.3%). The overall national percentage figure is always going to be lower for each habitat than the individual local authority figures. This is because in a larger area you have more individual habitat patches which results in a lower connectivity measurement. |
For CSGN data visualisation: Habitat Connectivity Indicator – CSGN (arcgis.com) The data for whole Scotland was provided directly by NatureScot. |
|
Proportion of surface water bodies classified in good or better condition |
2022 |
445 (13.7%) surface water bodies in high condition, 1664 surface water bodies in good condition (51.2%) on a total of 3 249 surface water bodies monitored. | |
|
Proportion of Scotland’s Protected Sites in Favourable Condition |
2024 |
65.1% of natural features in favourable condition ‘Site condition monitoring assessment). If we include the sites where monitoring has detected signs of recovery, but favourable condition has not been reached (6.1%) and the sites with positive management is in place that is expected to improve the condition of the site (4.4%), the overall number reaches 75.6%. For woodlands (the least favourable habitat type), the proportion of sites in favourable condition is 56.8%. |
The Proportion of Scotland’s Protected Sites in Favourable Condition 2024 | NatureScot |
|
Proportion of soft shorelines affected by coastal erosion |
2021 |
46% of the soft coast is affected by coastal erosion. The average rate of erosion is 0.43 m/year. | |
|
Extent of green-blue landcover in urban areas |
2024 |
As of April 2024, the total area of urban greenspace in Scotland, as defined by Ordnance Survey, is 3,166 km². | |
|
Proportion of adults who live within a 5-minute walk of their nearest green or blue space |
2022 |
70% of adults reported living within a 5-minute walk of their nearest green or blue space. |
Supporting documents – Scottish Household Survey 2022: Key Findings – gov.scot (www.gov.scot) |
|
Communities creating climate-resilient, healthy and equitable places | |||
|
Proportion of adults viewing climate change as an immediate and urgent problem |
2022 |
74% of adults viewing climate change as an immediate and urgent problem. “Adult” refers to those aged 16 and over. | |
|
Proportion of the population declaring that they understand what actions they should take to help tackle climate change |
2022 |
80% of adults agreed that they understood what actions they should take to help tackle climate change. “Adult” refers to those aged 16 and over. | |
|
Number of Community Climate Action Hubs |
2024 |
There are currently 20 hubs across Scotland supporting community-led climate action. It covers 81% of the Scottish council areas (26 council areas covered by the 20 hubs). | |
|
Number of Local Place Plans |
2024 |
No local place plans have been adopted yet. Many councils have recently invited communities to prepare Local Place Plans so that they can play a proactive role in defining the future of their places. |
This information has not been centralised and published in one place by the Scottish government. |
|
Progress of actions in local flood risk management plans |
2019/21 |
90% of the actions set out in the strategies to avoid an increase in flood risk are green. 10% of the actions are amber. By 2021, 100% of the actions are expected to be complete. 84% of the actions described in the strategies to reduce flood risk are green, 12% of the actions are amber and 4% are red. With 96% of the actions completed or underway by 2021, the actions developed to meet the reduce objectives will mostly be achieved. | |
|
Mental wellbeing score (WEMWBS) |
2022 |
In 2022, the mean WEMWBS score for all adults was 47.0. |
Scottish Health Survey 2022 Main Report Volume 1 (www.gov.scot) |
|
Public services are collaborating in effective, inclusive adaptation | |||
|
Number of public bodies members in the Public Sector Climate Adaptation Network |
2024 |
50 organisations are currently members of the Public Sector Climate Adaptation Network. |
Adaptation Scotland :: Public Sector Climate Adaptation Network |
|
Number of public bodies citing the Work in partnership & collaborations as a priority s for the year ahead in relation to climate change adaptation |
2022/23 |
53.2% of the 188 listed public bodies (100 public bodies) submitting an annual compliance report cite “Work in Partnerships & Collaborations” in their top 5 priorities for the year ahead in relation to climate change adaptation. |
Public Bodies Climate Change Reporting – Analysis Report 2022/23 (sustainablescotlandnetwork.org) |
|
Level of risk assessment across the public sector |
2022/23 |
70.2% of all listed public bodies submitting an annual compliance report have completed some form of risk assessment during or prior to the 2022/23 reporting period. 43.6% of bodies have carried out a limited assessment which does not provide an in-depth risk assessment addressing a range of climate hazards or risks. 20.7% of bodies have carried out a comprehensive risk assessment. 5.8% have completed an advanced risk assessment involving stakeholders and considering a range of climate or socioeconomic scenarios. |
Public Bodies Climate Change Reporting – Analysis Report 2022/23 (sustainablescotlandnetwork.org) |
|
Level of adaptation action taken across the public sector |
2022/23 |
71.8% of all listed public bodies submitting an annual compliance report have taken adaptation action during or prior to the 2022/23 reporting period. 44% of bodies have taken some action where a range of actions or policies exist but it is unclear how the actions are contributing to addressing specific climate risks or hazards. 21% of all bodies are taking good action, meaning the bodies are taking action to reduce specific risks and/or taking significant sector-specific adaptation actions. 6% of bodies are taking advanced action where a comprehensive set of actions are in place to address specific climate risks and plans are in place to measure progress against the management of these risks. |
Public Bodies Climate Change Reporting – Analysis Report 2022/23 (sustainablescotlandnetwork.org) |
|
Economies and industries are adapting and realising opportunities in Scotland’s Just Transition | |||
|
Proportion of businesses monitoring climate related risks (flooding, temperature increase, supply chain disruptions) |
2023 |
15.6% of Scotland businesses have assessed risks for supply chain disruption and distribution. 6.2% of Scotland businesses have assessed risks for increased flooding. 4.4% of Scotland businesses have assessed risks for temperature increase. 60.6% of Scotland businesses have not assessed any risks related to climate change. The scope of “businesses” taken into account by this survey are businesses which have not permanently stopped trading, with 10+ employees and with a presence in Scotland (n=1,061). |
Climate Change – BICS weighted Scotland estimates: data to wave 88 – gov.scot (www.gov.scot) |
|
Proportion of businesses taking action to adapt to the effects of climate change |
2023 |
26.5% of Scotland businesses declare they have already taken action to adapt to supply chain disruption and distribution. 11.5% of Scotland businesses declare they have already taken action to adapt to increased flooding. 5.7% of Scotland businesses declare they have already taken action to adapt to temperature increase. 21.2% of Scotland businesses have not assessed any risks related to climate change. 18.1% of businesses reported that they do not expect to be impacted by these climate change effects. The scope of “businesses” taken into account by this survey are businesses which have not permanently stopped trading, with 10+ employees and with a presence in Scotland (n=521). |
Climate Change – BICS weighted Scotland estimates: data to wave 88 – gov.scot (www.gov.scot) |
|
Number of green jobs |
2022 |
Using the industry approach, Scotland employment in green jobs in 2022 was estimated at 46,200 full-time equivalents (FTEs). |
Experimental estimates of green jobs, UK: 2015 to 2022 – Office for National Statistics (ons.gov.uk) |
|
Uptake of grants for agriculture storage reservoirs/ off season storage lagoons |
2024 |
5 AECS applications for irrigation lagoons were successful in 2024. 14 applications were submitted. |
Scottish government – unpublished data |
© The University of Edinburgh, 2024
Prepared by Ricardo on behalf of ClimateXChange, The University of Edinburgh. All rights reserved.
While every effort is made to ensure the information in this report is accurate, no legal responsibility is accepted for any errors, omissions or misleading statements. The views expressed represent those of the author(s), and do not necessarily represent those of the host institutions or funders.
ClimateXChange
Edinburgh Climate Change Institute
High School Yards
Edinburgh EH1 1LZ
+44 (0) 131 651 4783
If you require the report in an alternative format such as a Word document, please contact info@climatexchange.org.uk or 0131 651 4783.
https://www.gov.scot/isbn/9781836017264 ↑
Meeting notes from the four workshops are provided as supplementary materials to this report. ↑
Note: the objectives used here are taken from the draft SNAP3. The wording in the final SNAP3 differs slightly. ↑
Note: the objectives used here are taken from the draft SNAP3. The wording in the final SNAP differs slightly. ↑
Note: the objectives used here are taken from the draft SNAP3. The wording in the final SNAP differs slightly. ↑
Note: the objectives used here are taken from the draft SNAP3. The wording in the final SNAP differs slightly. ↑
See Office of National Statistics – https://www.ons.gov.uk/economy/environmentalaccounts/bulletins/experimentalestimatesofgreenjobsuk/2024#measuring-the-data ↑