

Impacts of high-volume solar deployment
Work completed: December 2023
DOI: http://dx.doi.org/10.7488/era/3666
This research was carried out in 2022/23 and was based on the market conditions at that time. Policy related to and emphasis on electricity networks has changed significantly since this research was conducted and therefore not all aspects of the report reflect the current landscape.
Executive summary
Solar panels can help decarbonise Scotland’s energy supply and there are plans to reduce barriers to enable greater deployment in Scotland. The Scottish Government recently consulted on the potential for a solar ambition and a Solar Vision is in development.
The solar industry has been calling for a 4-6 GW solar photovoltaic (PV) ambition by 2030, to put Scotland in line with the UK target of 70 GW by 2035. This can be broken down as 2.5 GW rooftop solar (1.5 GW domestic and 1 GW commercial), with the remaining capacity made up of large-scale grounded mounted solar.
Our work investigates the benefits and impacts of deploying 2.5 GW of rooftop solar PV installation onto the electricity network in Scotland by 2030. The distribution network operators are forecasting lower levels of solar PV uptake in their future energy scenarios.
We consider the benefits, high-level estimate of reinforcement investments needed to accommodate it and the potential impact on consumer bills. We also consider wider costs to the transmission network.
Benefits and opportunities
The rise of electricity generation connected to a distribution network, known as embedded generation, offers new opportunities to the distribution network for managing the future growth of demand. Potential network benefits include:
- Reduction in electricity infrastructure investments due to generation meeting demand
- Reduced line losses from transmitting electricity across the transmission network due to more demand being met by onsite generation.
- Supporting demand in other areas by selling excess power
Financial benefits for consumers adopting solar PV arise from lower electricity bills. Benefits could be increased if demand could be shifted to times of excess generation. Stakeholders from the distribution networks considered that increased solar PV deployment would provide greatest opportunities for commercial consumers whose peak demand during the day would be most likely to match peak solar generation.
We also found that the co-location of commercial or domestic scale battery storage alongside solar PV would provide the greatest economic opportunities by extending the duration throughout the day when demand is met by on-site generation. This could also reduce network impacts by delaying the need for network upgrades.
Impacts and costs
We estimate that 27% (209) primary substations in Scotland might become overloaded with an increased deployment of rooftop solar. The impact is additional to that from other low-carbon technologies (e.g. wind, ground mounted solar, battery storage) as forecast by Distribution Network Operators. The majority (84%) of these substations are located in Scottish Power Energy Networks region, with 16% in Scottish & Southern Electricity Networks region.
Our high-level estimates of total costs for all forecasted network interventions are:
- Scottish Power Energy Networks (SPEN): £130 million worth of work to upgrade high-voltage substations and low-voltage networks and £120 million to upgrade transmission infrastructure.
- Scottish & Southern Electricity Networks (SSEN): £20 million worth of work to upgrade high-voltage substations and low-voltage networks, and £30 million to upgrade transmission infrastructure.
These are based on network reinforcement costs for a mix of areas representative of Scotland and key information on network location and capacity, and magnitude of solar PV in the area, with the results scaled up to represent all of Scotland. The cost of traditional network reinforcement involves replacing substations and overloaded equipment with that of a higher capacity rated equipment.
The distribution costs will be paid by all consumers in Scotland through their energy bills. The estimated average annual increase in domestic consumer energy bills is £0.53 in the SSEN area and £1.81 in the SPEN area. The estimated average annual increase in non-domestic consumer energy bills is £7.17 in SSEN’s area and £24.46 in SPEN’s area.
Alternative ways to release additional capacity from existing assets that could reduce costs include:
- Flexibility services, which contracts consumers/aggregators to generate power or shift load at times of congestion to support constraint management.
- Reconfiguring networks to release capacity from feeders that are close to operational limits.
- Smart solutions and approaches to release capacity, for instance low-voltage monitoring for better informed design and operation, dynamic variable ratings to factor in seasonality and electronic control of power flows.
These have the potential of decreasing or delaying the need for reinforcement but will not entirely negate this need.
Overall, it is difficult to quantify whether the benefits outweigh the impacts on the grid and on consumer bills, but steps can be taken to reduce the potential impacts and enable greater benefits to be realised. Examples include investing in on-site battery storage and continued deployment of network flexibility and innovation solutions.
Recommendations
- Network interventions are triggered because Distribution Network Operators are required to use a conservative assumption that less generation will be consumed onsite with more exported to the network. This could be an area to explore.
- Incentivising the requirement to have domestic and non-domestic battery storage in conjunction with solar PV to absorb any excess solar, thus preventing exports, may reduce the scale of network interventions needed. Battery storage can provide greater network flexibility by charging and discharging as required.
- A co-ordinated approach is needed between key stakeholders including the Distribution Network Operators, transmission operators, local authorities and the solar industry to ensure that a significant increase in solar PV can be accommodated. Improved evidence of large quantities of solar being proposed is needed to allow the network operators to plan accordingly and justify their decisions to Ofgem.
Glossary of terms
|
AC |
Alternating current |
|
ANM |
Active network management |
|
BSPs |
Bulk supply points |
|
DC |
Direct current |
|
DFES |
Distribution future energy scenarios |
|
FIT |
Feed in Tariff |
|
DGCG |
The distributed generation connection guides |
|
DNOs |
Distribution network operators |
|
DUoS |
Distribution Use of System |
|
EHV |
Extra high voltage |
|
EREC |
Engineering recommendation |
|
EV |
Electric vehicle |
|
GSPs |
Grid supply points |
|
GW |
Giga watt |
|
GB |
Great Britain |
|
G98 |
Distributed Generation Connection Guides: G98 |
|
G99 |
Distributed Generation Connection Guides: G99 |
|
HV |
High voltage |
|
kW |
kilo Watt |
|
LCTs |
Low-carbon technologies |
|
LV |
Low voltage |
|
MW |
Mega watt |
|
Ofgem |
Office of Gas and Electricity Markets |
|
PS |
Primary substation |
|
PV |
Photovoltaic |
|
RIIO-ED2 |
RIIO’ stands for ‘Revenue = Innovation + Incentives + Outputs’ and ‘ED’ stands for Electricity Distribution |
|
SEG |
Smart export guarantee |
|
SPEN |
Scottish Power Electricity Network |
|
SPT |
Scottish Power Transmission |
|
SS |
Secondary substation |
|
SSEN |
Scottish & Southern Electricity Networks |
|
SSET |
Scottish & Southern Electricity Transmission |
|
T&D |
Transmission and distribution |
|
TOs |
Transmission operators |
|
UoS |
Use of System |
Introduction
Background
Scotland has made significant progress in decarbonising its energy sector through the growth of renewable electricity generation technology. The Scottish Government has a statutory target legislated in the Climate Change (Scotland) Act 2019 to reach net zero emissions by 2045. This will require further decarbonisation across the entire energy sector in Scotland. The draft Energy Strategy and Just Transition Plan and the Climate Change Monitoring report set out targets for the transformation of Scotland’s energy sector from 2030 and beyond. There is an ambition to deliver at least 20 GW of additional low-cost renewable capacity by 2030, and for at least the equivalent of 50% of Scotland’s energy across heat, transport, and electricity demand to come from renewable sources.
Over recent years, domestic, non-domestic and commercial buildings have been encouraged to become more energy efficient and reduce electricity consumption from the grid. As well as the use of energy efficiency measures, there has been an increase in the adoption of low carbon technologies (LCT), such as rooftop solar PV. Schemes such as Feed in Tariff (FIT) and Smart Export Guarantee (SEG) have further contributed to the rise in solar PV installations. The SEG scheme provides a payment to renewable energy generators for every kilowatt-hour (kWh) of energy that is exported to the grid via a p/kWh tariff agreement.
The Scottish Government recently consulted on the potential for a solar ambition. The solar industry has been calling for a 4-6 GW solar photovoltaic (PV) ambition by 2030, which would align Scotland with the UK Governments target for solar [1]. This can be broken down into the following:
- 1.5 GW domestic rooftop solar
- 1 GW commercial rooftop solar
- Remaining capacity made up of large-scale grounded mounted solar
This level of solar ambition will require additional electricity network capacity, with cost implications in the form of necessary distribution and transmission network interventions. The distribution network costs will, in part, be passed onto electricity consumers across Scotland while transmission costs are levied on consumers at GB level. If distribution network intervention costs are higher in specific network regions, then consumers who sit in this region will pay more towards distribution costs through their energy bills than those in other network regions.
Aims and approach
This report focuses on 2.5 GW of rooftop solar PV installations, spread across domestic and non-domestic premises, and provides an assessment into the impacts on the electricity network and the resulting costs and benefits of greater solar PV deployment in Scotland.
The level of investment needed to accommodate the additional solar installations and potential impact on consumers energy bills is estimated using credible assumptions but is not definitive. The assessment also considers wider costs to the transmission network. Our work was informed through desktop research, stakeholder engagement and analysis using data obtained from DNOs and reports in the public domain.
Electricity network overview
The electrical infrastructure in Scotland is made of two key parts: the transmission network and the distribution network. The transmission network includes the 400 kV, 275 kV and 132 kV network and operated by Transmission Owners (TOs), and the distribution network which includes lower voltage networks and is operated by the Distribution Network Operators (DNOs).
The transmission and distribution networks in Scotland are operated by the following organisations (see Figure 1):
- Scottish Power Energy Networks (SPEN), made up of 2 key parts:
- Scottish Power (SP) Distribution are the DNO of the distribution network in Central & Southern Scotland
- SP Transmission are the TO for Central & Southern Scotland
- Scottish & Southern Electricity Networks (SSEN), made up of 2 key parts:
- SSEN Distribution, who are the DNO for the North of Scotland
- SSEN Transmission are the TO for the North of Scotland
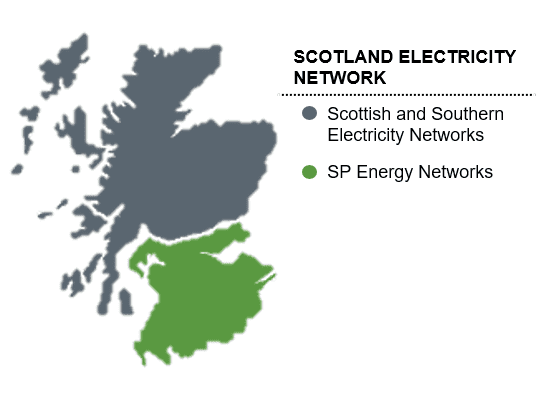
Figure 1 Electricity network operator map for Scotland
At the distribution level, there are four types of electrical substations used to distribute electrical power from the transmission network to consumers:
- Grid Supply Points (GSPs): Provide the connection between the transmission system and the distribution network. GSPs step the voltage down from the transmission network voltage of either 400 kV, 275 kV or 132 kV to the highest distribution network voltage known as the sub-transmission network or EHV network.
- Bulk Supply Points (BSPs): Step the incoming 132 kV voltage down to 33 kV, which is then distributed to different primary substations in the region. Some very large industrial and commercial loads may be directly fed at this level.
- Primary Substations: Take the incoming 33 kV feeder and steps the voltage down to 11 kV which directly supplies some larger commercial loads, as well as the secondary substations.
- Secondary Substations: Take the incoming 11 kV feeder and steps the voltage down to Low Voltage (LV), which will typically supply residential areas.
Solar PV connection types
All solar PV installations (and other generation types) connecting to the distribution network must comply with the Distribution Code and either Engineering Recommendation (EREC) G98 or G99 as applicable [2] [3]. The Distributed Generation Connection Guides (DGCG) outline the steps to be carried out to obtain a connection agreement and gain approval to connect solar PV assets to the network [4].
The DGCG considers both EREC G98 and EREC G99:
- G98 for small-scale installations: This is applicable for small-scale installations with a total capacity of no more than 16 amps per phase connected at low voltage (230 V). This equates to a maximum peak power of 3.68 kW single phase or 11.04 kW three-phase. An example of a G98 application is domestic rooftop solar PV.
- G99 for large-scale installations: This is applicable for installations with a total installed capacity greater than 16 amps per phase connected at either low voltage (Type A only) or high voltage levels. G99 includes four types:
- Type A: From 0.8 MW to < 1 MW
- Type B: From 1 MW to < 10 MW
- Type C: From 10 MW to < 50 MW
- Type D: greater than or equal to 50 MW
Depending on available roof space, a commercial rooftop solar installation may fall into the G99 Type A category. Larger G99 types are likely to be ground-mounted.
Project findings
Potential opportunities for distribution networks from increased solar PV deployment
Distribution network equipment has traditionally been sized to supply the peak load, which is the maximum demand that an area is expected to draw from the wider electricity network. This is to ensure that consumers do not pay for network infrastructure that is not used, known as stranded assets. The electrification of heat and transport through the introduction of heat pumps and electric vehicle charging points will add to the peak demand, potentially resulting in greater network constraints and triggering necessary interventions as a result. There are new ways to manage the impacts, including using the techniques described in Section 4.3.3. The rise of embedded connected generation will offer new opportunities to the distribution network when it comes to managing the future growth of demand.
Benefits include the following:
- Reduction in electricity infrastructure: Connecting distributed generation close to the point of use (e.g., rooftop solar PV behind the meter) could result in a reduced need for distribution infrastructure as the demand is being offset by generation. Increased distributed generation can reduce the average load on network assets and can defer the immediate need for asset replacement and when replacement is required. For example, charging of EVs could be timed to match the generation profile of the solar, reducing the need to supply power from elsewhere in the grid. However, the scale of 2.5 GW of additional solar will need to be investigated further to understand this opportunity in more detail.
- Reduced line losses: Generation can supply loads within the distribution network, reducing the distance between where supply and demand are located, which reduces energy losses.
- Supporting demand in other areas: Generators can sell excess power that cannot be consumed locally to the network to support other demand users. This can have the benefit of reducing network demand during periods of high demand, thus enabling more capacity to be made available for supporting more connections in wider network.
Leveraging these benefits requires active support for flexibility technologies and accounting for these benefits in network design.
Due to its inherent nature, solar PV generates in a finite window which is not generally at times of peak demand. This makes solar less directly beneficial than other renewable energy technologies that have some part of their energy generation window overlapping with the peak demand window. Engagement with DNO stakeholders resulted in the following conclusions on solar opportunities to the network:
- A greater deployment of solar PV in the future will provide only small opportunities to reduce peak demand on the wider network. This is because solar generation is greatest in the summer on sunny days, and the demand peaks in the winter evenings when solar generation is usually at its lowest.
- Domestic consumers who deploy rooftop solar PV are unlikely to present opportunities to the network as it is unlikely that generation will coincide with peak domestic demand.
- There may be greater opportunities to the network from commercial consumers whose demand will peak during the day with a greater chance of matching the peak in solar PV generation. This would especially be the case for commercial buildings with flexible demand, or who provide EV charging points to their employees.
However, it is the view of the stakeholders that co-locating domestic and commercial scale battery storage within the premise along with solar PV can provide greater economic opportunities. It will enable greater benefits to the distribution network to be realised as it will allow consumers to offset their peak demand and extend the duration during which electricity stored from solar PV can meet their own energy requirements [5]. This could provide a valuable flexibility service to the network and delay the need for expensive network upgrades, which can reduce network costs and consumers’ energy bills. Overall, battery storage should be encouraged alongside solar to enable greater opportunities for both the network and technology to be realised going forward.
Potential benefits to consumers from increased solar PV deployment in Scotland
Connecting solar consumers
For an individual connecting solar consumer, the main benefits of installing solar PV include a reduction in electricity costs and direct access to zero carbon renewable electricity.
The Carbon Trust publishes information online to advise businesses on the potential of renewable energy and to assess whether using renewable technologies is a viable option for a business [6]. According to the Carbon Trust, typical small-scale installations are around 15 to 25 square metres, with a 3 kW system comprising of around 15 panels taking up an area of 20 square meters and can generate roughly 2,500 kWh per annum [7]. Maintenance costs are low and estimated payback time varies significantly and will depend on the circumstances of each site. Some domestic installations report a payback period of just 4 years, reduced from previous years due to higher electricity prices in the UK [8].
The potential benefit to individual connecting solar consumers will be on a case-by-case basis and depends on how much solar can be generated and the times of day the consumer is at home to maximise the benefits. For example, an average assumption for domestic solar panels is that 30% of generation is consumed at home and 70% is exported when the owners are out at work from 9-5pm [9]. If the consumer is at home during the day, then self-consumption will increase, while a commercial building is likely to use over 80% onsite. In summer, this offset might be significant, though this will be lower in winter when generation will be lower, and demand is often higher. Installing solar PV can bring financial incentives where a payment can be received from a supplier for a proportion of solar that is sold directly to the grid through securing Smart Export Guarantees [10].
Stakeholders agreed that installing energy storage alongside solar PV can be used to extend the duration when power from solar can offset consumer demand, enabling further reduction in energy bills. Using energy storage can provide benefits by storing the excess solar energy that cannot be consumed at the time of generation, which reduces the level of exports onto the distribution network. This could help to reduce the need for network interventions if the design methods adopted by the DNOs allow for this.
All consumers across Scotland
The scale of solar PV installations in a 2.5 GW ambition will trigger network interventions because the DNOs are required to make conservative assumptions that less generation will be consumed onsite with more exported onto the network. This will have an impact on all consumers electricity bills in Scotland (not only those consumers with solar PV); however, consumers with solar installations will be less impacted compared to consumers without solar installations. Adopting flexibility measures such as domestic and commercial scale battery storage to absorb and reduce the excess solar generation exporting onto the grid will reduce network interventions, and thus reduce overall consumer costs. This should be encouraged alongside the installation of solar PV to maximise the potential of the technology and extend the duration at which demand can be met by on-site generation.
Potential for distribution connected solar PV deployment in Scotland’s energy network
DNO forecasts of rooftop solar PV connections
The decarbonisation of a wide range of economic sectors, including the electrification of transport and heating, is expected to result in high adoption of low-carbon technologies (such as heat pumps and EV chargers) on the electricity distribution grid. As a result, greater network capacity will be required to facilitate supplying these additional loads, and the network load profiles will become less predictable. This could raise new operational and management challenges to the DNOs. In order to plan in advance of future network pinch points, the DNOs carry out studies to identify where network intervention is required between now and 2050 to enable informed investment priority decisions to be made.
As part of their licence, DNOs are responsible for facilitating and creating the network infrastructure to meet electricity demand. To accomplish this, the DNOs forecast and understand consumers changing electricity needs under varying levels of consumer ambition, government policy support, economic growth, and technological development. The DNOs present these results in form of their DFES data, which provide a breakdown of different demand and generation technologies across each scenario up to 2050 and is updated every year after the DNOs have revised their modelling data. Both SP Distribution [11] and SSEN Distributions latest DFES data was assessed as part of this project. SSEN Distribution DFES results is not published in the public domain, this information was obtained directly.
Using the latest DFES data on Scotland’s energy network, the Figure 2 shows both SP Distribution and SSEN Distributions forecasts of new small-scale solar installation until 2030 using 2020 as the baseline.
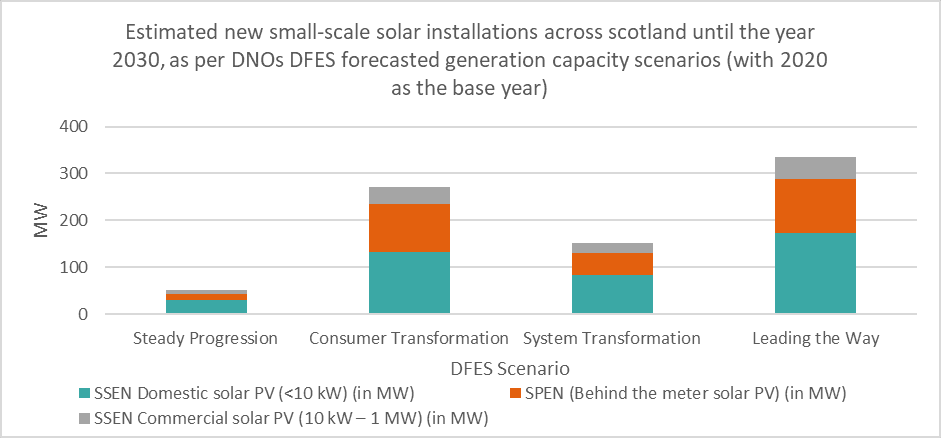
Figure 2: Estimated new solar rooftop installations across Scotland in 2030 (2020 base year) Source: DFES forecasted generation capacity scenarios
Figure 2 shows that projected small-scale solar PV uptake in 2030 is significantly less than the 2.5 GW number suggested by the solar industry. Even the scenario with the highest projected numbers (Leading the Way) forecasts only 13% (c.325 MW) of the 2.5 GW solar industry ambition. This indicates that the evidence collected by DNOs from stakeholder meetings with Local Authorities (LA) and generation developers is for a lower level of solar deployment.
Accommodating a significant number of small-scale solar installations
From our engagement with DNO stakeholders, we understand that individual small-scale (G98) applications are of less concern due to their small export capacity; however, a large cluster within a specific network area will pose greater network challenges. The impact will be location dependent as network topology and capacity will vary. In some cases, depending on the makeup of the LV feeder, the cross-sectional area of the cable, the number of consumers supplied on that feeder and the size of the houses, there may be no problems connecting a significant amount of PV in an area. However, in other cases, network reinforcement may be required with the addition of even a modest amount of PV generation.
DNO stakeholders informed us that major network interventions needed to accommodate a significant amount of G98 applications are designed based on ‘worst case’ principles, where minimum consumer demand and maximum generation output are witnessed on the DNOs network. This approach has been used by DNOs over many years to establish if the network can still operate safely and reliably when there is an excess of generation exports due to low consumer site demand.
Network impact assessments allow the DNO to understand the impacts as a result of accommodating more generation connections. Areas of investigation for the DNOs include:
- Thermal overload
- Voltage rises
- Increased harmonic and fault level contributions
If EREC standards of compliance are not meet through utilisation of the existing network, network interventions are required, and the scale of the work needed is proportional to the resulting network impact.
Larger rooftop solar PV installations (G99 connections) require approval from the DNO before connection is granted. In contrast, G98 connections are ‘fit and inform’, where the connection can proceed without DNO approval. The connections are managed by the DNOs on a first come first serve basis by placing G99 applicants into a managed queue. A network impact assessment is carried out and any reinforcement costs incurred by the DNO are included in the final connection offer. The timescales for accommodating G99 solar PV connections (mainly commercial buildings) depends on the scale of the upgrades needed; however, DNOs are licenced by Ofgem and are obligated to make a final connection offer within the set timescales.
Innovative methods of accommodating new connections
Historically, the connection agreements for generators and load connected at low voltage allowed import or export of the full rated power with no restriction to time or duration. Connections and the network had to be reinforced to allow this. This would involve replacing cables, overhead wires, transformers, and switchgears. Broadly speaking, the more reinforcement works needed at high voltage levels results in greater the reinforcement costs.
However, in recent years DNOs have introduced new methods that enable smarter use of the network equipment and reduce the amount of traditional reinforcement that is needed to accommodate the significant uptake of generation.
The type of interventions used by DNOs include:
- Network flexibility though flexible connection agreements: Flexible connection agreements allow the DNO to manage the load and generation connected to the network to some extent, providing a lever to alleviate overload on equipment or voltage issues. Examples include requiring the generation or load to operate differently if there is an outage of equipment on the network, at certain times during the year, or in response to signals from the DNO. This means that less reinforcement is needed to connect the new load or generation, potentially reducing the cost and time to connection. This does mean though that some developments would not be able to export power at certain times if they signed up to flexible connection agreement.
- Network reconfiguration: This involves using remote controlled switches (mostly manual switching is done at LV level) to reconfigure the network and shift generation output from network equipment that is heavily loaded to another area of the network that is lightly loaded. This helps to release capacity on the network, reduce network constraints and avoid network upgrade investment.
- Other innovative solutions: Both SP Distribution and SSEN Distribution are actively deploying new smart network management tools to manage the network more efficiently to allow a transition away from traditional ways of operating. For example, collection of network data to make more informed decisions on network operation or control systems to manage the network better during peak operation periods which will help reduce network constraints and maintain voltage tolerance limits.
It is important to note that innovative solutions will not alleviate all traditional reinforcement requirements. If the options above fail to provide the necessary network capacity needed to accommodate more generation then infrastructure will need to be upgraded.
Connecting a significant volume of rooftop solar generation
A significant rise in solar PV connections could be accommodated in an efficient manner if the DNOs and policymakers work in collaboration to understand the policy signals, increase data transparency, understand the role different parties need to play and investment required to make this happen in a timely manner.
In order to maintain a smooth transition to greater solar PV uptake, improved intelligence is needed, particularly at LA level, to understand where solar PV is likely to be located. More local information could provide more accurate data to update DNO modelling tools. This will give the DNOs a better picture of where networks will likely require intervention and inform their investment priority decisions ahead of time. This will also provide evidence to justify DNO decisions to Ofgem.
DNOs have an obligation to provide an option to connect, but the timescales for making connections will vary depending on how much network intervention is needed. The cost of providing such interventions is, in part (depending on the particular situation) borne by the developer seeking the ability to export. The scale of investment needed in specific locations could affect connection timescales.
Innovative approaches should continue to be used where possible to reduce the cost and time to connect. This will minimise the barriers to develop new renewable generation projects while maintaining a secure and reliable power supply. Innovative approaches are also a more efficient and cost-effective approach to asset management.
Impacts of increased solar PV deployment on electricity networks
Potential network challenges of increased rooftop PV
The changing nature of the electricity distribution network as a result of dynamic power flows and increased unpredictability in load profile behaviour requires a transition away from traditional ways of operating. For example, electricity networks in Scotland are traditionally managed to meet the maximum demand throughout the day and year by sizing assets accordingly. However, the rise of generation at distribution level creates new challenges, such as demand reduction, increased thermal constraints, reverse power flows, greater voltage constraints, greater fault level contributions and harmonic contributions. These are detailed in Section 7.1.
The impacts depend greatly on the size, design and local network condition of each individual connection. Additional PV generation would also be connected within the context of other LCTs such as heat pumps, batteries, electric vehicles, wind and larger solar generation. It is difficult to predict the specific challenges and impacts which will be experienced with accuracy.
DNO stakeholders informed us that they are most concerned about voltage rises which must be maintained within the correct limits. This will be a big challenge in summer when there is excess generation flowing in the opposite direction onto the network, which increases network voltages. The exact scale is unknown and even a small deviation from voltage limits can damage network infrastructure and appliances because all electrical equipment is designed to handle voltages within specified tolerances.
Estimated scale of network impact
We conducted an analysis to determine how many primary substations are likely to require intervention in 2030 as a result of greater solar PV deployment in Scotland. The analysis used 1.5 GW domestic rooftop solar and 1 GW commercial rooftop solar by 2030, information provided by the DNOs and data from the DNOs DFES. The DFES provides generation forecasts up to 2050, including the distribution of that forecast across primary transformers. It was assumed that the additional solar generation was spread across the network in accordance with the forecasted distribution pattern. The uplifted generation forecast numbers for rooftop solar PV were then used to understand where substations were likely to be overloaded and may require interventions in 2030 by using the DNO headroom report on capacity availability [12] [13]. The methodology behind the analysis is discussed further in the Appendix Section 7.2.
The projected percentage of primary substations that may require intervention in 2030 due to the 2.5 GW solar rooftop are shown in Table 1.
Table 1: Primary substations that may require interventions by network area (Source: DFES data)
|
Scottish Power Energy Networks |
Scottish & Southern Electricity Networks |
Total | |
|
Number of substations that may require intervention in 2030 due to greater rooftop solar PV deployment |
176 |
33 |
209 |
|
Total number of primary substations (down to 11 kV level) |
385 |
384 |
769 |
|
% of primary substations that may require intervention |
46% |
9% |
27% |
We found that 46% of total primary substation equipment in SP Distribution and approximately 9% of total primary substation in SSEN Distribution could be overloaded as a result of increased solar PV generation. This represents 176 primaries out of 385 in SP Distribution’s area and 33 out of 384 in SSEN Distributions area. The analysis can be broken down further into low, medium and highly constrained sites:
Table 2: Extent of site constraints for overloaded sites
|
Lightly constrained (less than 10% overloaded) |
98% of sites |
|
Moderately constrained (10-20% overloaded) |
approximately 1% of sites |
|
Highly constrained (more than 20% overloaded) |
approximately 1% of sites |
The majority of these network interventions are projected to take place in SPENs distribution network area, which is likely to be linked to the fact that it is located in busier urban areas, whereas SSEN Distribution area is more rural.
We carried out a high-level analysis to estimate the cost of interventions for upgrading distribution network infrastructure to accommodate the 2.5GW solar rooftop in 2030. The estimated cost of reinforcement provided by DNOs for selected study areas was scaled up to estimate the reinforcement cost for the entire network.
The methodology used to estimate this cost is described in Section 7.3.
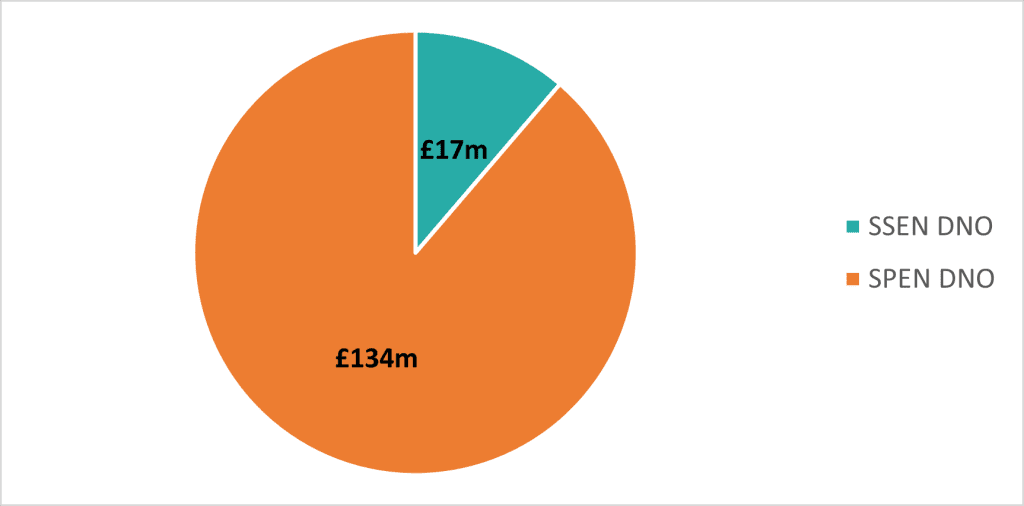
Figure 3: Estimated cost of interventions in 2030 in both SPEN and SSENs distribution boundaries (£ millions)
It can be seen that the cost of intervention is higher in the SP Distribution area (£134m compared to £17m in SSEN Distribution area). This can be attributed to a greater number of interventions being forecast as required in the SP Distribution area.
Impacts on consumers’ bills and potential mitigations
Rules for connection charges and Use of System charges
The DNOs are licenced by the energy regulator, Ofgem, who sets rules regarding the amount of revenue DNOs can recover from consumers, this includes connection charges.
Connection charges for rooftop solar covers the cost of replacing or upgrading equipment to facilitate new generation connections. The DNO determines the extent of network reinforcement required, and the subsequent cost, by studying the impact of the additional generation on the network.
G98 connections, which are likely to include all domestic-scale and smaller commercial rooftops, do not incur connection charge. Larger generation installations under G99 may trigger an upfront connection charge depending on the capacity of the local network. Multiple generation installations in close proximity installed by the same party, for example a housing association fitting solar panels across many properties in one area, may also result in a connection charge.
For all cases, additional costs not covered by the connection charge are recovered through Use of System (UoS) charges. UoS charges are charged to all consumers through their electricity bills. The DNOs are required to calculate these UoS charges annually utilising the Common Distribution Charging Methodology (CDCM) [14]. Each DNO is required to publish their statement of charges in advance of application [15]. These statements provide detail of how the charges are determined for demand or generation customers, and these are further split by domestic and non-domestic categories. The charging statements also contain worked examples of how any reinforcement costs are calculated.
There are a number of steps used to calculate the Distribution Use of System (DUoS) charges which will be impacted by increased solar PV installation. For example, for each category of demand users the DNO estimates the following load characteristics:
- A load factor, defined as the average load of a user group over the year, relative to the maximum load level of that user group; and
- A coincidence factor, defined as the expectation value of the load of a user group at the time of system simultaneous maximum load, relative to the maximum load level of that user group.
In determining the load characteristics of each category of demand user, the DNO will analyse meter and profiling data for the most recent 3 year period for use in the calculation of charges. Load factors and coincidence factors are calculated individually for each of the 3 years and a simple arithmetic average is then used in tariff setting. Large scale PV deployment would impact these calculations but without detailed data it is not possible to accurately determine what the resultant potential impact might be.
The DNO determines a set of different distribution time bands, based on the underlying demand profiles and associated costs – these could be expected to change given large scale PV deployment in some areas. These time bands can only be revised annually on 1 April. It is likely that the large-scale rollout of solar PV for domestic customers will reduce their consumption during daylight hours (co-incident with system peak times) thus leading to a lower DUoS cost over those periods.
The DNO also forecasts the volume chargeable to each tariff component under each tariff for the charging year, which are separately determined for the Domestic Aggregated and Non-Domestic Aggregated tariffs. These volumes would be impacted by PV deployment relating to the two different categories, thus impacting the relevant tariffs differently.
The Significant Code review undertaken by Ofgem “Network Access and Forward-Looking Charges” [16] came into effect from 1 April 2023. This resulted in a reduction in the contribution to network reinforcement made by G99 connections. This improves the business model for many generators, who would otherwise have had to pay larger upfront costs. A summary of the previous and new rules for connection charging is provided below with some key terms.
- Onsite works: This is works needed onsite to accommodate the installation and includes facilitating a connection to the distribution network.
- Reinforcement works: This involves replacing equipment on the existing network to accommodate new connections. This usually involves replacing cables, transformers and switchgears etc.
- Connecting solar consumers: This refers to domestic and commercial entities who have rooftop solar installations. A G98 installation is typically relevant to connecting consumers who are domestic, while G99 is more relevant to connecting consumers who are commercial entities.
Table 3: The new Ofgem Significant Code Review rules for recovering network upgrade costs from generation connections that trigger the need for reinforcement (Source: Ofgem [16])
|
Onsite works |
Reinforcement at connection voltage |
Reinforcement at one voltage level above the connection voltage | |
|
G98 single installation Likely to include all domestic and smaller commercial properties |
Unlikely to be needed, as the property should already be connected to the grid |
Fully funded by the DNO via UoS charges |
Fully funded by the DNO via UoS charges |
|
Multiple G98 or G99 installations |
Connecting solar consumers pay 100%. Bigger installation would likely trigger the needed more bigger fuses onsite. |
Connecting solar consumers pay a proportion of the reinforcement costs (likely to be a small fee or nothing) |
Old arrangement Connecting solar consumer pays a proportion of the reinforcement costs |
|
New arrangement Fully funded by the DNO via UoS charges, up to a High Cost Cap |
Potential impact on consumer bills
Large-scale solar PV adoption will impact the DUoS calculations for consumers. In order to assess the cost impact of the large scale roll out of rooftop solar on all consumer bills (not only consumers with solar installations) we assumed that all network interventions required to accommodate 2.5 GW of solar would be socialised. This is a simplified assumption that provides an estimate of the maximum impact UoS charges has as a result of the modelled interventions. A more accurate assessment would require more data regarding locations of commercial and domestic properties and the scale of solar to be adopted at the premises. This is because larger commercial buildings adopting solar PV will likely make a direct contribution to network intervention costs, thus reducing the UoS spread across all remaining consumers.
According to Scottish Government energy data, non-domestic consumers account for 60% of Scotland’s total electricity consumption. As a result, non-domestic consumers will pay more towards DUoS directly due to their higher energy consumption [17]. We applied a non-domestic to domestic electricity consumption ratio of 60:40 in both DNO licence areas in Scotland. This allocated 60% of the intervention costs in each DNO area to non-domestic, with the remaining 40% of the costs going to domestic consumers.
We then spread the costs using the ratio of number of non-domestic to domestic premises to obtain an indication of the increase in non-domestic and domestic energy bills which could be realised following large-scale solar deployment. SSEN provided this split, where out of total consumers in their licenced area that have electricity meters, 90% are non-domestic premises while 10% are domestic. The Department of Energy Security and Net Zero (DESNZ) has published information on GB electricity meters, and a similar ratio was observed [18]. SPEN did not provide the split in their region, so we have assumed the same ratio will apply.
Table 4 shows the annual impact of socialising the reinforcement investment required at distribution level to accommodate 2.5 GW rooftop solar. Costs per consumer bill split between domestic and non-domestic consumers in Scotland irrespective if they have solar or not have been estimated. Section 7.4 explains the methodology used to calculate this estimate.
Table 4: Annual impact of socialising the reinforcement cost at distribution level on consumers in Scotland (£/year/customer bill)
|
DNO |
Estimated annual impact per domestic customer bill (£) for reinforcement costs in 2030 |
Estimated annual impact per non-domestic customer bill (£) for reinforcement costs in 2030 |
|
SSEN |
£0.53 per year for 45 years |
£7.17 per year for 45 years |
|
SPEN |
£1.81 per year for 45 years |
£24.46 per year for 45 years |
Non-domestic consumers will pay a bigger contribution towards reinforcements triggered by solar PV uptake due to their higher energy consumptions, while domestic consumers pay less towards DUoS. These costs are based on assumptions applied due to lack of available data during the research and should therefore be treated as indicators of what the additional costs over and above baseline energy bills could be but they are not definitive.
The DNOs did not validate or confirm the methodology we used to derive these numbers. These provide a highest cost estimate due to the assumption that all Scottish consumers will pay 100% of reinforcement costs through their electricity bills. However, it is likely that some commercial solar connecting consumers will pay a proportion of the reinforcement costs they triggered upfront directly. This would reduce the impact on all consumer bills but is unlikely to have a large impact. It was not possible to separate the reinforcement cost triggered by commercial consumers due to data limitations.
Potential impacts on the transmission network
A proposed ambition 2.5 GW of small-scale rooftop solar PV by 2030 is likely to trigger the need for network reinforcement across the transmission network in Scotland and the rest of GB. The exact nature and scale of the upgrades required is difficult to predict as there is uncertainty as to where the clusters of solar will be located and the nature of impacts are locationally dependent. Different areas of the transmission network have varying levels of headroom and different amounts of generation could be accepted before voltage and fault levels are triggered.
The nature of transmission network impacts and the intervention design works needed to accommodate future connections (including solar PV and other generation technologies) are determined from the Security and Quality of Supply Standard (SQSS) [19]. This sets the criteria for electricity transmission network planning.
- Network Assessment Approach: The TOs take a deterministic snapshot methodology approach to reduce the risk of transmission assets being overloaded and generators being constrained on their respective networks. In this deterministic methodology, the TOs study the summer minimum demand against the maximum generation output on a given local area network for the assessment of any new generation connecting.
- The results of network impact assessments: The TOs assess thermal, voltage and fault level constraints on the network and conclude if greater solar PV embedded in the distribution network could trigger non-compliance with grid code procedures if reverse power was realised.
The timelines to resolve transmission constraint issues can be significant and are longer than the timescales needed for distribution upgrades.
A high-level analysis was carried out to estimate the transmission network costs incurred by the TOs to upgrade the network. Figure 4 shows the estimated cost on the transmission network in Scotland is over £150 million with £122 million (81%) of this in the SPEN transmission network and £30 million (19%) in the SSEN transmission network.
Section 7.3 explains the methodology used to estimate these costs in more detail. In brief, the estimated cost of reinforcement provided by TOs for our selected study areas was scaled up to estimate the reinforcement cost for the entire network. SPEN transmission reinforcement costs were estimated using cost of reinforcement shared by SSEN transmission for the study area.
There will also be an incremental impact on the transmission network in England which will trigger additional transmission costs due to greater transmission capacity required to accommodate greater solar exports. These have not been considered in this study and the numbers provided below are for transmission assets that are located only in Scotland.
Figure 4: Estimated cost of interventions in 2030 in both SP and SSENs transmission boundaries (£ millions)
The investments made by the TO will be recovered through the price control mechanism with the cost being socialised across all GB energy consumers. Our estimated costs are provided to give insight into the scale of the challenge to reinforce the transmission network but are not definitive. Further, more detailed analysis would be required to reliably quantify the estimated costs associated with interventions in the transmission network.
Conclusions
We assessed the likely benefits and impacts of a proposed ambition for an additional 2.5 GW solar PV at distribution level in Scotland by 2030. In conclusion:
- An additional 2.5 GW solar ambition would enable progress towards net zero targets. The Scottish Government has set a target to reach net zero carbon emission by 2045 and increased rooftop solar could contribute to the ambition to deliver at least 20 GW of additional low-cost renewable capacity by 2030.
- Individual financial benefits are based on the reduction in electricity bills for consumers adopting solar PV. Benefits could be increased if demand could be shifted to times of excess generation.
- Network benefits could be realised by pairing solar PV with battery storage as this will improve flexibility. Solar PV is an intermittent energy source and unlikely to reduce peak demand significantly.
- DNOs would be obliged to make a firm or flexible connection offer to facilitate the extra solar PV in a cost-effective manner. Advance visibility of where large quantities or clusters of rooftop solar PV connections would be located would help DNOs understand the scale of intervention needed and in what timescale it can be delivered.
- We estimate that 30% of primary transformers will require intervention to accommodate a 2.5 GW solar ambition. Most of these will be lightly constrained sites that are less than 10% overloaded. The impact is highly uncertain and depends on specific location of large quantities of solar PV and the status of the local electricity network.
- The cost of this impact is uncertain; we estimate £150m in the distribution networks, and over £150m in transmission networks. These are based on highest-cost assumptions that traditional methods are used for capacity release eg that overloaded equipment is replaced with higher rated equipment.
- The required intervention will be largely paid for by consumers. The network intervention costs associated with implementing the additional rooftop PV will be socialised to all consumers through electricity bills. A proportion of larger installations may be payable through connection charges by the connecting consumer.
- The estimated average annual increase in energy bills for domestic consumers is £0.53 and £1.81 in SSEN and SPEN areas respectively. The average annual increase in non-domestic consumers energy bills is estimated at £7.17 in SSENs area and £24.46 in SPENs area. These are indicators based on assumptions but are not definitive, and the approach has not been validated or confirmed by the DNOs.
- Adopting flexibility measures such as domestic and commercial scale battery storage will reduce the excess solar generation exporting onto the grid. This will reduce network interventions and thus reduce consumer costs. This should be encouraged alongside the installation of solar PV to maximise the potential of the technology and extend the duration at which demand can be met by on-site generation.
- Network interventions are triggered in part because DNOs are required to use the conservative assumption that less generation will be consumed onsite with more exported onto the network.
- Incentivising the requirement to have domestic and non-domestic battery storage in conjunction with solar PV to absorb any excess solar, thus preventing exports, may reduce the scale of network interventions needed. Battery storage can provide greater network flexibility by charging and discharging as required.
- Network operators are developing innovative ways of managing networks which could reduce the costs. Solutions including flexibility, reconfiguring the network, improved network visibility and active network approaches are increasingly being used. These approaches could also speed up the time taken to offer new connections. While these approaches could decrease the need for reinforcement, they are unlikely to entirely mitigate the need to be consistent with relevant technical requirements.
- A co-ordinated approach is needed between key stakeholders including the DNOs, TOs, LAs and the solar industry to ensure that a significant increase in solar PV can be accommodated. Improved evidence of large quantities of solar being proposed is needed to allow the DNOs to plan accordingly and justify their decisions to Ofgem.
- Overall, it is difficult to quantity whether the benefits outweigh the impacts on the grid and on consumer bills, but steps can be taken to reduce the impact and enable greater benefits to be realised. Examples include investing in on-site battery storage and continued deployment of network flexibility and innovation solutions.
References
|
[1] |
Solar Energy UK, “‘Significant appetite’ for more solar power, says Scotland’s new energy plan,” January 2023. [Online]. Available: https://solarenergyuk.org/news/significant-appetite-for-more-solar-power-says-scotlands-new-energy-plan/. |
|
[2] |
Energy Network Association, “G98 Distributed Generation Connection Guide,” 2022. [Online]. Available: https://www.energynetworks.org/search-results?sitesearch=G98&id=113. |
|
[3] |
Energy Networks Association, “G99 Connecting Type,” [Online]. Available: https://www.energynetworks.org/search-results?sitesearch=G99&id=113. |
|
[4] |
Energy Networks Association, “The Distribution Code of Licensed Distribution Network Operators of Great Britain: DG Connection Guides,” 2021 Revision. [Online]. Available: https://dcode.org.uk/current-areas-of-work/dg-connection-guides.html. |
|
[5] |
E.On Energy, “Solar battery storage,” [Online]. Available: https://www.eonenergy.com/solar-battery-storage.html. |
|
[6] |
Carbon Trust, “Renewable energy guide,” Jan 2018. [Online]. Available: https://www.carbontrust.com/our-work-and-impact/guides-reports-and-tools/renewable-energy-guide. |
|
[7] |
Carbon Trust, “Renewable Energy Sources,” [Online]. Available: https://ctprodstorageaccountp.blob.core.windows.net/prod-drupal-files/documents/resource/public/Renewable-energy-guide.pdf. |
|
[8] |
All Seasons Energy, “Solar panel payback period is now 4 years,” 31 August 2022. [Online]. Available: https://allseasonsenergy.co.uk/news-and-blogs/solar-panel-payback-period-4-years/. |
|
[9] |
Spirit Energy, “Solar PV Knowledge Bank: Solar PV Export Tariffs,” 2023. [Online]. Available: https://www.spiritenergy.co.uk/kb-solar-pv-export-tariff. |
|
[10] |
Ecosphere renewables, “Benefits of solar PV,” [Online]. Available: https://www.theecosphere.co.uk/our-services/solar-pv/benefits-of-solar-pv/. |
|
[11] |
Scottish Power Energy Networks, “Distribution Future Energy Scenarios,” 2022. [Online]. Available: https://www.spenergynetworks.co.uk/pages/distribution_future_energy_scenarios.aspx. |
|
[12] |
Scottish Power Energy Networks, “Network Development Plan,” 2022. [Online]. Available: https://www.spenergynetworks.co.uk/pages/network_development_plan.aspx. |
|
[13] |
Scottish and Southern Electricity Networks, “Network Capacity Information,” 2022. [Online]. Available: https://www.ssen.co.uk/our-services/network-capacity-information/. |
|
[14] |
DCUSA, “Section 16: Common Distribution Charging Methodology,” 2022. [Online]. Available: https://dcusa-viewer-staging.electralink.co.uk/dcusa-document/117/423464. |
|
[15] |
Scottish and Southern Electricity Networks, “Scottish Hydro Electric Power Distribution charging statements,” [Online]. Available: https://www.ssen.co.uk/about-ssen/library/charging-statements-and-information/scottish-hydro-electric-power-distribution/. |
|
[16] |
Ofgem, “Access and Forward-Looking Charges Significant Code Review: Decision and Direction,” 3 May 2022. [Online]. Available: https://www.ofgem.gov.uk/publications/access-and-forward-looking-charges-significant-code-review-decision-and-direction. |
|
[17] |
Scottish Government, “Energy Statistics for Scotland – Q3 2022,” December 2022. [Online]. Available: https://www.gov.scot/publications/energy-statistics-for-scotland-q3-2022/pages/energy-consumption/#:~:text=This%20document%20is%20part%20of%20a%20collection&text=Consumption%20of%20electricity%20between%202021,with%20decreased%20in%20both%20sectors.. |
|
[18] |
Department for Energy Security and Net Zero, “Smart Meter Statistics in Great Britain: Quarterly Report to end June 2023: data tables,” August 2023. [Online]. Available: https://www.gov.uk/government/statistics/smart-meters-in-great-britain-quarterly-update-june-2023. |
|
[19] |
National Grid ESO, “Security and Quality of Supply Standard (SQSS),” [Online]. Available: https://www.nationalgrideso.com/industry-information/codes/security-and-quality-supply-standard-sqss. |
|
[20] |
“Distribution Future Energy Scenarios 2022: Results and methodology report – North of Scotland licence area,” April 2023. [Online]. Available: https://www.ssen.co.uk/globalassets/about-us/dso/smart-and-local-benefits/ssen-dfes-2022-north-of-scotland-report.pdf. |
Appendices
Network challenges
Demand Reduction through the use of onsite generation will change the daily domestic and commercial load profiles and make them more unpredictable and more difficult to plan the network. Network operators strive to balance demand and generation in order to maintain grid stability and reliability. An increase in solar PV connections will lead to greater network challenges around grid stability. As distributed generation grows it will remove a significant portion of demand from the network during certain time periods, while higher up in the grid, greater numbers of renewable energy plants (offshore and onshore wind) will be connected leading to greater network imbalance. This will exacerbate the situation and pose additional challenges to grid operation. The National Grid may seek to reduce the imbalance by asking large-scale wind operators to reduce energy output or switch off which leads to constraint payments being made. The deployment of greater network demand through large-scale battery storage and hydrogen production is being actively encouraged to reduce the network imbalances.
Examples of network challenges are as follows:
Increased thermal constraints, where significant generated power is fed into the network, for example if there are clusters of PV generation in one area, and there is a mismatch between onsite solar generation and demand on a sunny day. This can overload equipment causing them to heat up beyond their rated temperatures, causing damage or aging. This will be common in summer where there is mismatch between solar generation and onsite demand.
Reverse power flows, where power is fed into the network from generation resulting in power flowing in the opposite direction than designed. Some substations with new equipment will be able to handle greater reverse power flows, however, older equipment or that with a particular design may have less or no reverse power capability and may require maintenance or replacement.
Greater voltage constraints, where voltage rises due to the reduction in load or the increase in generation across an area of network. All networks are designed to operate at voltages within acceptable tolerances and DNOs have a frequent task to maintain voltages within the correct limits. If voltages go outside their limits, this poses risk to asset health which could be damaged as a result. Greater solar connections runs the risk of exceeding voltage limits as laid out in the DNO licences. Voltage constraints are the biggest concern to the DNOs as they have the biggest impact.
Greater fault level contributions, where the solar PV installations contribute towards greater network fault currents, which are triggered due to disturbances on the network. Faults on the network can cause inrushes of current which can damage critical infrastructure. The network and its protection equipment must be designed to accommodate the fault level for a short time in order to keep equipment and people safe. PV generation contributes to fault level (large inrush of current when there is a fault on the network), and so connection designs must accommodate it. If the fault level rating of equipment is exceeded the DNO will replace the assets. As a result, a significant cluster of generation will increase fault level contributions right up to transmission level.
Harmonic contribution, where PV generation creates distortions in the Alternating Current (AC) signal resulting in a reduction in power quality being delivered to consumers and some consumer equipment might flicker or not operate properly. PV generation contributes to harmonic issues as a result of the inverter equipment, but this contribution is limited by regulation.
Methodology for estimating proportion of interventions needed
The DNOs forecast and understand consumers changing electricity needs under varying levels of consumer ambition, government policy support, economic growth, and technological development. The DNOs create forecasts for multiple scenarios through their DFES data (Leading the Way, Consumer Transformation, System Transformation, Steady Progression) [11] [20]. DFES data from both SPEN and SSEN using the Consumer Transformation Scenario was used in our analysis. This scenario assumes greater consumer engagement, which leads to greater deployment of low-carbon technologies, such as solar PV, to offset network demand. We consider that this assumption would be consistent with increased solar deployment.
Primary substations which are likely to require intervention in 2030 were determined by spreading the 2.5 GW of solar PV across all primary substation assets in Scotland. We used the DNOs modelling assumptions to determine where they believe the high clusters of future solar installations will be located and spread the extra the 2.5 GW using the same pattern of distribution. The detailed approach is described below:
- We used DNOs DFES modelling tools to determine how much rooftop solar PV is estimated between now and 2030 across all primary substation assets. This was clear from SPEN modelling, but SSEN did not provide a degree of granularity and we estimated as the solar PV numbers.
- The DNOs own estimates of rooftop solar PV were removed from the analysis to leave an indication into forecast individual large-scale solar PV (ground-mounted). This was to avoid including the 2.5 GW over and above the DNOs rooftop solar PV forecast as this would duplicate the number of households that has solar PV.
- We calculated the proportion of rooftop solar to total solar using DFES data. The DFES data only provided total rooftop solar numbers across each year rather than across each individual substation per year which reduces the level of granularity. However, the combined solar PV numbers (rooftop + ground mounted) was provided for each substation across every year. We expressed the total rooftop solar PV numbers to the combined solar PV numbers in 2030 as a percentage. This allowed us to estimate the proportion ratio of rooftop solar in 2030, which was then used to separate the rooftop component from the overall total solar PV numbers across all primary substation data. This provided an estimate of rooftop solar PV across each primary substation.
- 2.5 GW of solar capacity was then spread in a similar proportion to the original DNO forecast of rooftop solar across all primary substations to provide an uplifted forecast. For example, if the DNO was estimating that 2 MW of rooftop solar PV would be located in an area in Glasgow, we estimated that 15 MW would be realised in that area in 2030 using the following calculation:
- Uplifted forecast = (2MW / total forecasted rooftop solar PV in 2030 from DNOs modelling tools) * 2.5GW
- The proportion of primary substations that will require interventions was estimated by subtracting the uplifted forecast from the DNOs published headroom report figures.
Methodology for estimating cost of intervention
We used four study areas in order to assess the cost of interventions needed. The study areas covered four categories:
- Rural
- Domestic properties in urban areas
- Mixed domestic & commercial in urban areas
- Commercial properties in urban areas
A primary substation was selected for each study area that was close to being overloaded by using the DNOs published heat map data.
Table 5 Study areas used to assess cost of intervention
|
Rural |
Domestic properties in urban areas |
Mixed domestic & commercial in urban areas |
Commercial properties in urban areas | |
|
DNO |
SSEN Distribution |
SP Distribution |
SP Distribution |
SP Distribution |
|
Location |
Aberdeenshire |
Larbert, Falkirk |
Livingston |
Edinburgh |
|
Primary Substation |
FYVIE |
LARBERT |
DEANS |
KINGS BUILDINGS |
|
Primary S/S generation capacity |
Red (heavily constrained) |
Amber (approaching operational limits) |
Amber (approaching operational limits) |
Amber (approaching operational limits) |
|
GSP |
KINTORE |
Bonnybridge |
DRUMCROSS |
KAIMES |
|
GSP generation capacity |
Red (heavily constrained) |
Red (heavily constrained) |
Red (heavily constrained) |
Red (heavily constrained) |
|
Headroom after adding in 2.5 GW target (MW) |
-2.95 |
-4.74 |
-1.51 |
-3.50 |
|
Uplifted forecast (MW) |
4.51 |
5.47 |
1.73 |
4.03 |
The study areas were submitted to both the DNOs and TOs to gain high level estimates of the type of interventions deployed and the cost of interventions.
Due to time constraints, the DNOs and TOs could not commit to undertaking a detailed analysis, which involves undertaking detailed power flow analysis. The results provided are estimates of interventions from previous assessments carried out by the DNOs. The results of the DNOs and TOs analysis are detailed below.
Table 6 Cost of interventions and assumptions provided by the DNOs for each study area
|
Study area type |
DNO |
Cost of interventions |
Assumptions |
|
Rural |
SSEN Distribution |
£844k for replacing primary substation |
Replacing a 33/11 kV primary substation. The rules used to estimate costs in other parts of the network are for every £1 spent reinforcing the primary network, SSEN will spend:
|
|
Domestic Properties in Urban areas |
SP Distribution |
£0.5m – £1.25m |
This takes into account all reinforcement work from primary down to LV level. |
|
Mixed domestic & commercial properties in urban areas |
SP Distribution |
£0.1m – £0.25m |
This takes into account all reinforcement work from primary down to LV level. |
|
Commercial properties in urban areas |
SP Distribution |
£0.5m – £1.0m |
This takes into account all reinforcement work from primary down to LV level. |
The estimated cost of reinforcement provided by DNOs for the selected study areas was scaled up to estimate the reinforcement cost for the entire network. The headroom capacity numbers across all primary substations that may require intervention was used to scale up the costs.
The results of the investigation with the TOs are provided in Table 7.
Table 7 Cost of interventions and assumptions provided by TO for study area
|
Study area type |
TO |
Cost of interventions |
Assumptions |
|
Rural |
SSEN Transmission |
£5 to £6 million |
|
SPEN transmission reinforcement costs were estimated using the cost of reinforcement shared by SSEN transmission for the study area.
Methodology for estimating the impact on consumer bills
The steps below explain the methodology to estimate the impact of socialised costs on consumer bills split between domestic and non-domestic.
- Allocated 60% of the estimated interventions costs directly to non-domestic consumers with the remaining 40% going to domestic through the DUoS mechanism, which allocates socialised costs to the higher energy consumer. 60% of Scotland’s total electricity consumptions comes from non-domestic.
- Socialised costs were treated as standard network capex and so were added to the DNOs Regulatory Asset Base (RAB).
- The total socialised cost to be recovered through deprecation over a period of 45 years (assumption shared by SSEN DNO).
- The DNOs regulated rate of return was applied to the investment.
- SSENs split of non-domestic and domestic consumers in their licences area (90:10) was provided for the investigation. SPEN did not provide a similar split; however, it is assumed that the same ratio split applies.
- Using the total costs allocated to non-domestic and domestic based on their energy consumptions, and using the quantity of customers split between domestic and non-domestic, an annual impact per customer split between domestic and non-domestic could be obtained.
The numbers are reflective of 2030 prices as this is when 2.5 GW could be realised. The year 2030 was used in isolation throughout this analysis rather than assessing the impact each year up to 2030 as we could not be sure how much solar would be added each year. It was therefore assumed that the grid would see 2.5GW in 2030.
Stakeholder engagement findings
This section presents areas of discussion in a series of stakeholder engagement meetings with DNOs and TOs. The meetings aimed to understand the following:
- The potential for greater solar PV deployment in Scotland and how existing distribution and transmission networks will accommodate them in additional to other generation technologies
- The impacts on the networks as a result of greater solar PV connections and the resulting interventions deployed by the network operators to manage the increase in connection requests
- Establish the intervention assumptions and resulting cost to deploy these interventions when solar PV connections trigger the need when capacity headroom is no longer available
- Explore the opportunities that solar PV can bring to future distribution network
- Explore gathering data on the cost of interventions to support with the analysis
SSEN Transmission
A meeting was held between Ricardo and SSEN Transmission on 20 February 2023 to establish the implications on the North of Scotland transmission network because of greater solar PV connections and how this would be accommodated. A summary of the meeting with the questions relevant for the discussion are summarised below.
Area of discussion: The process that transmission networks use to accommodate a significant increase in PV connections across Scotland’s energy network
The meeting focused on the following topics:
- SSEN TOs view of the 2.5 GW solar PV target by 2030.
- How transmission network impacts are assessed, and the rules adopted for network reinforcement designs.
- The ability of the transmission network to accommodate 100% reverse power flow and identify what needs to happen to accommodate this in the future.
- Establish the impacts on the network from greater generation connections that are off most concern to the transmission network.
- What type of interventions are being deployed to mitigate the impact on consumers.
SSEN DNO
Two meetings were held between Ricardo and SSEN Distribution on 24 January and 10 February 2023 to establish the implications on the North of Scotland distribution network because of greater solar PV connections and how this would be accommodated. A summary of the meeting with the questions relevant for the discussion are summarised below.
Area of discussion: How will existing networks will accommodate a significant increase in solar PV connections across Scotland’s energy network?
Areas explored:
- How are G98 (‘fit and inform’) connections accommodated? How can this be done at a large-scale?
- How are G99 (large-scale) connections accommodated, and how can they be accommodated at large-scale?
- What is the timeframe for a G99 application to be granted approval by SSEN? How is this impacted by a large proportion of consumers requesting connections to the same part of the network?
- What type of interventions are being considered? Any smart grid solutions?
- Do you think it will be technically feasible to accommodate 2.5GW of additional small-scale rooftop solar across Scotland’s energy network by 2030?
SPEN DNO
A meeting was held between Ricardo and SPEN Distribution on 15 February 2023 to establish the implications on the Central and Southern distribution network in Scotland because of greater solar PV connections and how this would be accommodated.
Area of discussion: How will existing networks accommodate a significant increase in solar PV installations between now and 2030?
Areas explored:
- How are G98 (‘fit and inform’) connections accommodated? How can this be done at a large-scale?
- How are G99 (large-scale) connections accommodated, and how can they be accommodated at large-scale?
- What is the timeframe for a G99 application to be granted approval by SPEN? How is this impacted by a large proportion of consumers requesting connections to the same part of the network?
- What type of interventions are being considered? Any smart grid solutions?
- Do you think it will be technically feasible to accommodate 2.5GW of additional small-scale rooftop solar across Scotland’s energy network by 2030?
Solar Energy Scotland
A meeting was held between Ricardo and Solar Energy Scotland (SES) on 28 July 2023 to discuss the solar industry view on the solar ambition, benefits of solar and areas of concern for how new connections are currently assessed by DNOs.
© The University of Edinburgh, 2024
Prepared by Ricardo Energy & Environment on behalf of ClimateXChange, The University of Edinburgh. All rights reserved.
While every effort is made to ensure the information in this report is accurate, no legal responsibility is accepted for any errors, omissions or misleading statements. The views expressed represent those of the author(s), and do not necessarily represent those of the host institutions or funders.