Emissions from Scottish hydrogen – international standards and export competitiveness
Research completed: October 2024
DOI: http://dx.doi.org/10.7488/era/5354
Executive summary
Scotland has set ambitions in its Hydrogen Action Plan to install at least 5 gigawatts of renewable and low-carbon hydrogen production capacity by 2030, and 25 gigawatts by 2045. Given Scotland’s hydrogen export ambitions, it is critical to understand any barriers to compliance with standards in potential markets, as well as Scotland’s international competitiveness as a hydrogen exporter.
Aims of the project
The main objectives of this study are to compare existing and developing hydrogen sustainability standards globally; and to compare the greenhouse gas (GHG) emissions of hydrogen and derivatives exported from Scotland to the EU market with those from other regions in meeting EU requirements.
Findings and recommendations
Key hydrogen standards globally already set out different GHG calculation methodologies and compliance requirements for producers. Hydrogen imported to the EU market currently must comply with rules set by the EU Renewable Energy Directive (RED) and the EU Gas Directive, if they are to contribute towards targets set under these policies. While an international standard is being developed (ISO 19870), it is unclear if the UK or EU will align with it in the future.
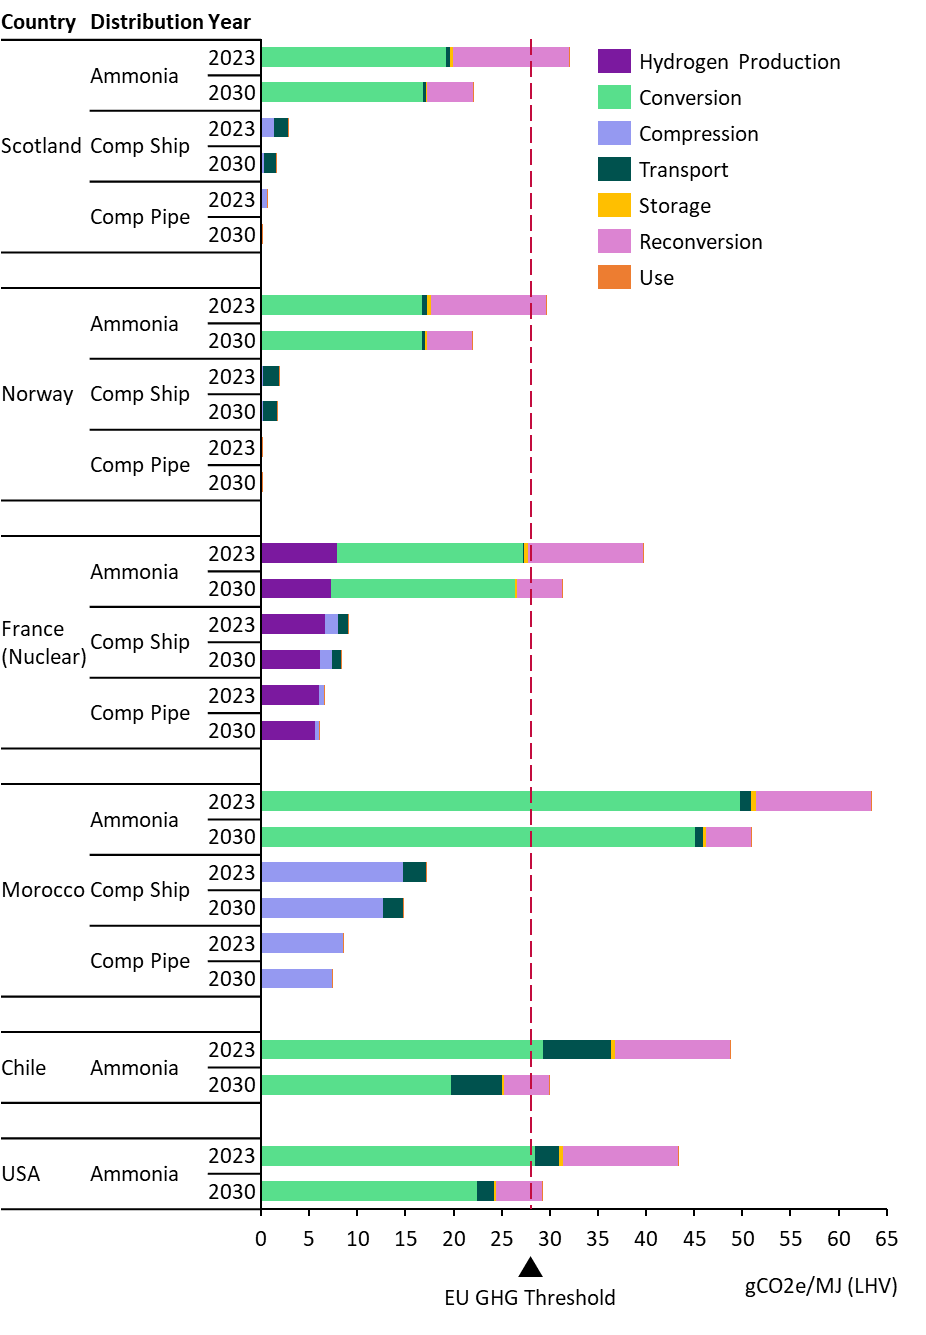
With regard to GHG emissions, electrolytic hydrogen produced in Scotland and exported to the EU market could be one of the most competitive from the countries we studied. Today, electrolytic hydrogen produced from renewable electricity in Scotland can already meet the EU RED GHG emission threshold (Figure 1). We refer to the GHG intensity of electricity used for Scotland pathways as the “Scottish grid” and use the National Grid country GHG intensity for Scotland rather than the GB grid electricity average GHG intensity. Of the other countries we considered, only Norway, with a grid that uses mainly hydro-electric power, can deliver electrolytic hydrogen to the EU with lower GHG emissions than Scotland. Further grid decarbonisation would increase the likelihood of compliance for hydrogen made from grid power, known as grid-connected electrolysis, by 2030. This would be the case even if, under EU rules, the Great Britain (GB) grid average factor has to be used instead of the (much lower) Scottish grid average.
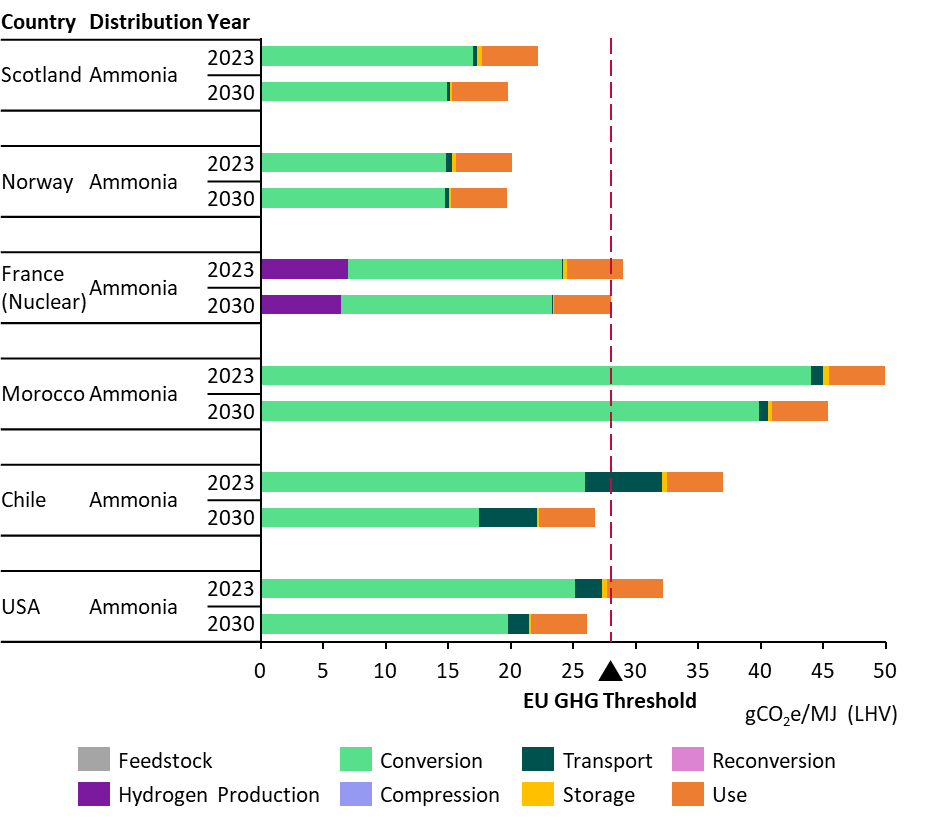
When transported over short distances as compressed hydrogen via pipelines or ships, electrolytic hydrogen produced using low-carbon electricity is expected to meet the EU GHG threshold. This is applicable in both 2023 and 2030 to renewable hydrogen produced in Scotland, Norway and Morocco, and to hydrogen produced from nuclear power in France (Figure 1).
Transporting hydrogen as ammonia leads to significantly higher GHG emissions. Producers who rely on ammonia for long-distance transport from countries such as Chile and the USA may need to reduce emissions further to comply with EU policies, particularly if ammonia is reconverted to hydrogen for final use. Over shorter distances, hydrogen produced in Scotland or Norway using renewable electricity and transported as ammonia is likely to comply with the EU GHG emission threshold by 2030 (Figure 1). France will only meet the EU threshold if ammonia is used as the end-product in 2030 due to additional emissions from nuclear electricity inputs. Meeting the threshold requires further emission reduction measures such as using renewable electricity for hydrogen distribution.
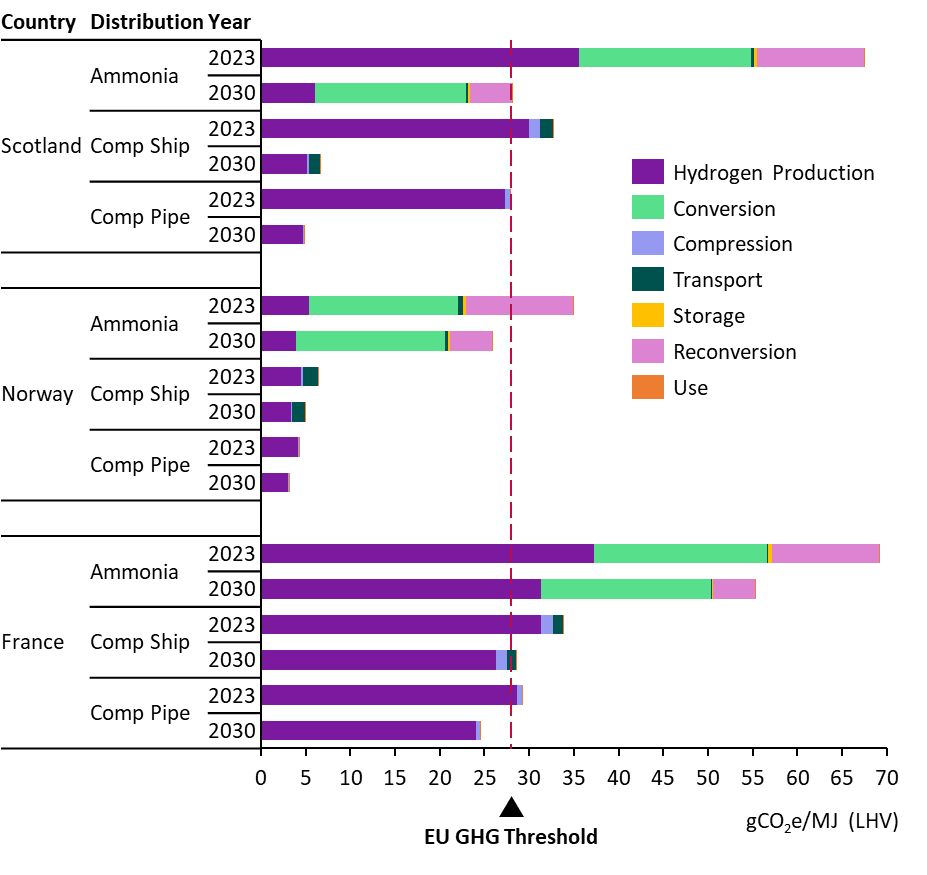
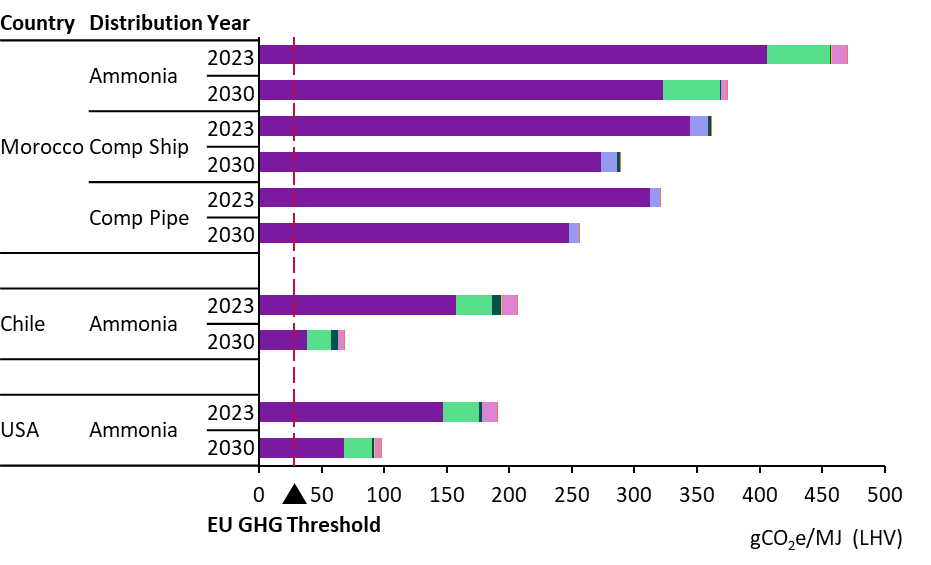
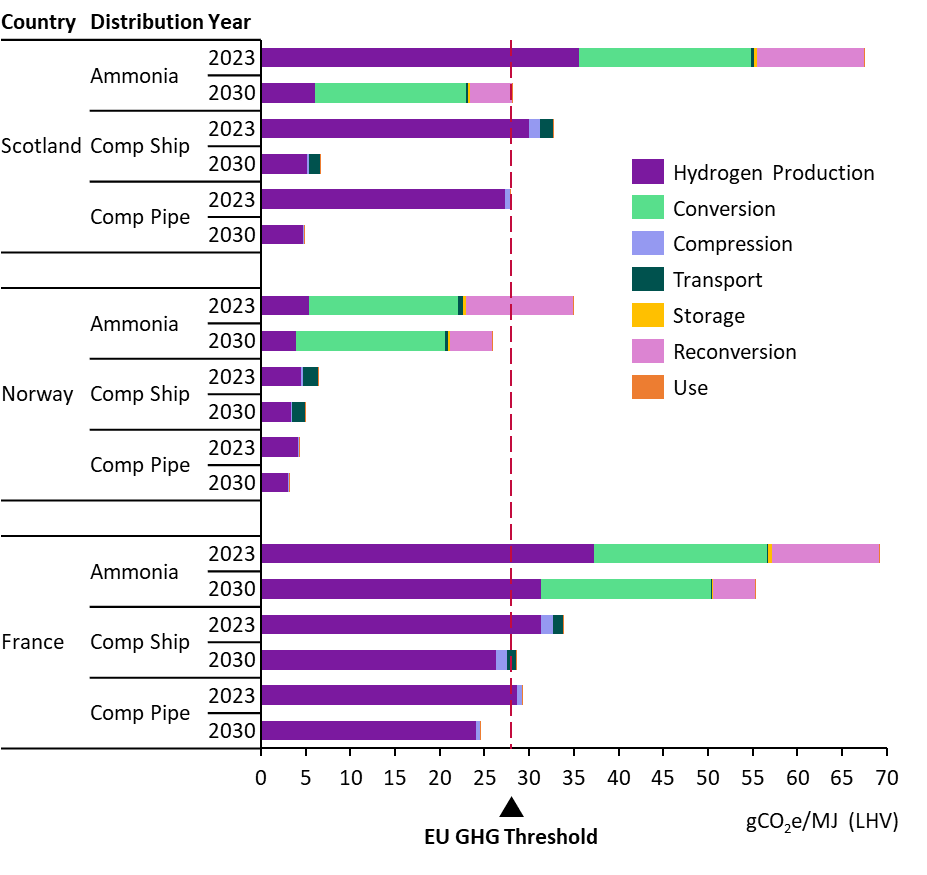
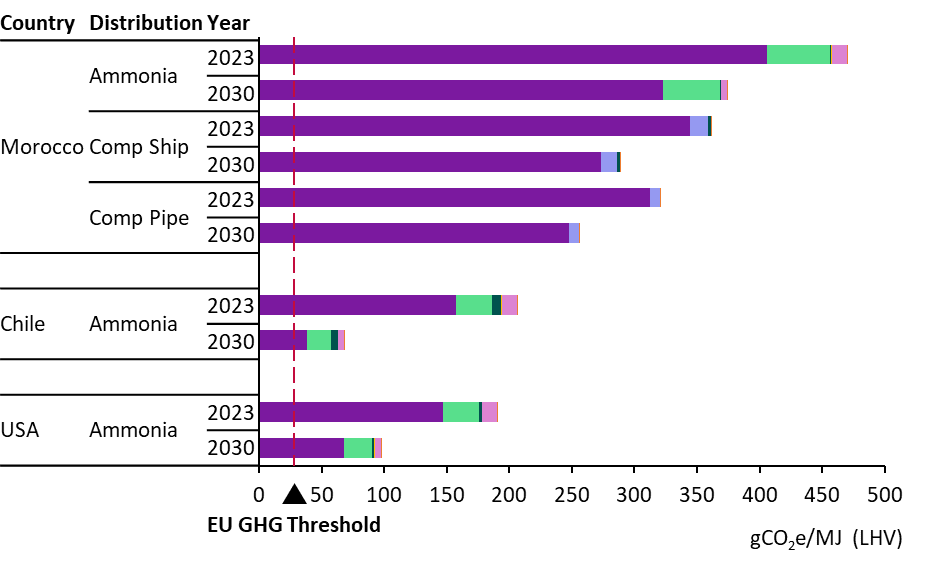
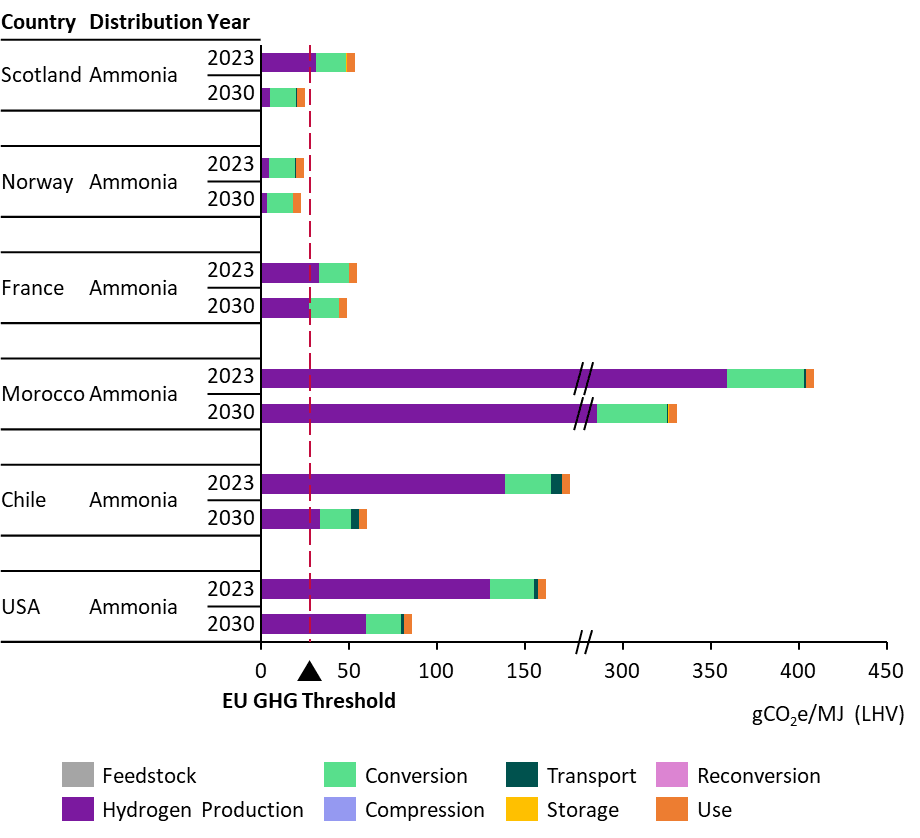
Only countries with a high share of low-carbon electricity on their grid can meet the EU GHG emission threshold for hydrogen produced from grid electricity. In 2023, hydrogen produced from grid electricity in Norway could already meet the EU threshold when transported as compressed hydrogen. This could also be achieved in Scotland if compressed hydrogen is transported via pipelines. In 2030, all production pathways in Scotland can meet the EU threshold if the GHG emission intensity of grid electricity (emissions per kilowatt-hour of electricity generated) specific to Scotland decreases in line with policy aspirations. If using the GB grid emission intensity, only the pipeline transport pathway could meet the threshold by 2030, with grid decarbonisation in line with policy ambitions. Hydrogen produced from grids heavily reliant on fossil fuels such as those in Morocco, Chile and the USA will not be compliant (Figure 2).
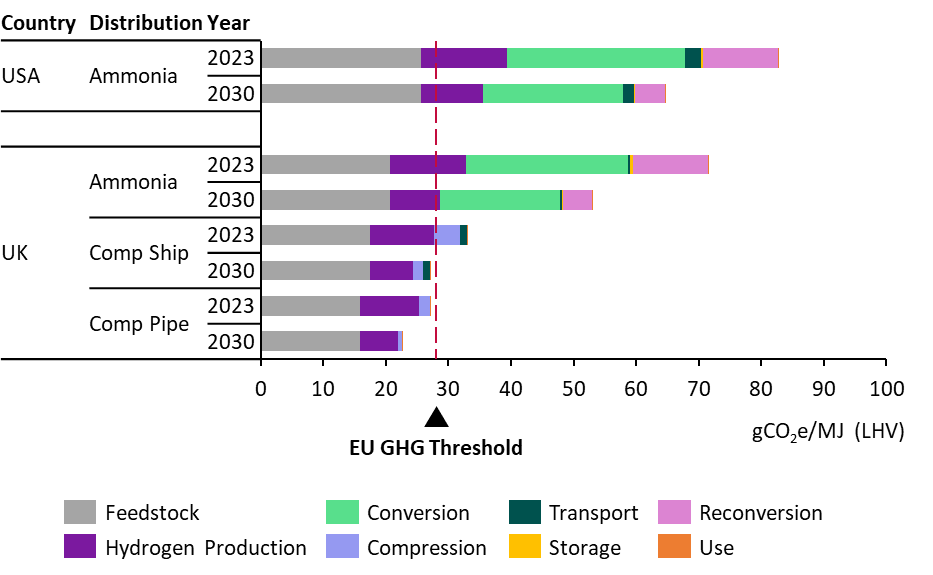
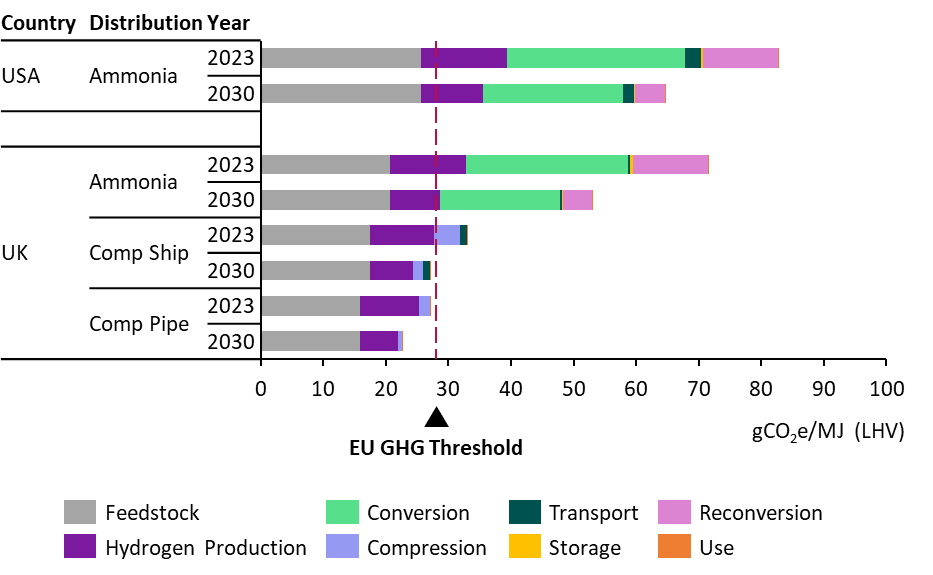
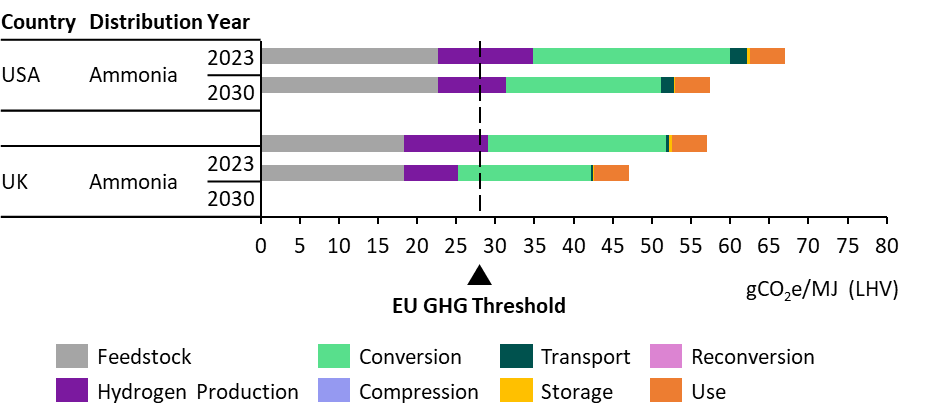
Many natural gas pathways modelled will not comply with the EU Gas Directive threshold. These pathways are highly sensitive to the GHG intensity of upstream natural gas production, which is uncertain and can be highly variable depending on the source (e.g. imported LNG with high intensities). Based on the default upstream natural gas intensity published in the EU RED Delegated Act 2023/1185 (as the EU Gas Directive Delegated Act is not yet finalised), hydrogen produced from natural gas in the UK could be compliant when piped or shipped as compressed hydrogen (Figure 3). This would give it an emissions advantage over US natural gas-derived hydrogen, which is transported via ammonia.
GB’s electricity grid as a whole has a significantly higher GHG intensity than Scotland, so further clarity on the definition of bidding zones in the EU RED Delegated Act is critical. Using the GB grid GHG intensity average for grid-electrolysis projects in Scotland results in high risk of non-compliance with the EU GHG threshold whereas using data specific to Scotland would confer significant advantages on grid electrolysis projects, including exemptions from some EU requirements.
This GHG emission analysis could be combined with the previous ClimateXChange cost analysis to evaluate the overall competitiveness of these hydrogen pathways. Further work could provide a view on the costs of adopting renewable electricity across all the post-production supply chain steps, alternative renewable heat for the ammonia cracking step of relevant pathways and/or switching in 2030 to using only zero emission marine fuels for shipping pathways. Implementing the hydrogen and ammonia pathways modelled in this study may require significant investment in new infrastructure for some countries, and these infrastructure needs and any first-mover advantages could be investigated further.
Abbreviations table
|
ATR |
Autothermal Reforming |
|
CCR |
Carbon Capture and Replacement |
|
CCS |
Carbon Capture and Storage |
|
CCU |
Carbon Capture and Utilisation |
|
CfD |
Contract for Difference |
|
CO2 |
Carbon Dioxide |
|
DA |
Delegated Act |
|
DESNZ |
Department for Energy Security and Net Zero |
|
EU RED |
European Union Renewable Energy Directive |
|
H2 |
Hydrogen |
|
GB |
Great Britain |
|
GH2 |
Green Hydrogen Standard |
|
GHG |
Greenhouse Gas |
|
GO |
Guarantee of Origin |
|
GREET |
Greenhouse gases, Regulated Emissions and Energy use in Transportation model |
|
GTP |
Global Temperature Potential |
|
GWP |
Global Warming Potential |
|
IPHE |
International Partnership for Hydrogen and Fuel Cells in the Economy |
|
IRA |
Inflation Reduction Act |
|
ISO |
International Organization for Standardization |
|
LCHS |
Low Carbon Hydrogen Standard |
|
LHV |
Lower Heating Value |
|
MJ |
Megajoule |
|
MPa |
Megapascal |
|
PPA |
Power Purchase Agreement |
|
PTC |
Production Tax Credit |
|
RCF |
Recycled Carbon Fuel |
|
REC |
Renewable Energy Certificate |
|
RES |
Renewable Energy Source |
|
RFNBO |
Renewable Fuel of Non-Biological Origin |
Introduction
In the 2022 Hydrogen Action Plan, Scotland set ambitions to install at least 5 gigawatts of renewable and low-carbon hydrogen production capacity by 2030, and 25 gigawatts by 2045 (Scottish Government, 2022). Given Scotland’s significant potential for hydrogen production using renewable electricity, the government has also published its Hydrogen Sector Export Plan (HSEP).
Low-carbon hydrogen is a nascent market, as most hydrogen used today is derived from fossil sources. As such, regulations, standards and schemes are being put in place globally to promote the use of low-carbon hydrogen, as well as to ensure that its production and use are sustainable. For example, in the UK, the Low Carbon Hydrogen Standard (DESNZ, 2023) has been established and continues to evolve. EU rules exist for renewable hydrogen pathways and are being developed for non-renewable pathways. Additionally, a global standard for hydrogen lifecycle GHG emissions is under development.
The main objective of this study is to compare existing and developing hydrogen lifecycle GHG standards globally and quantify how the GHG emissions (including not only carbon dioxide but other GHGs such as methane and nitrous oxide) of Scottish exports to the EU, in various forms, would compare against those from other regions in meeting EU requirements. Results from this report supported the development of the Hydrogen Sector Export Plan (HSEP) by identifying potential barriers to compliance with standards in potential markets, as well as Scotland’s international competitiveness as a hydrogen exporting country.
This report is a follow-up to a previous CXC project: “Cost reduction pathways of green hydrogen production in Scotland – total costs and international comparisons” (Arup, 2024).
International hydrogen standards
Several hydrogen standards, sustainability schemes and policies have recently been developed to support the implementation of national hydrogen strategies around the world. These standards typically set out a GHG emission calculation methodology and (where applicable) a maximum GHG emission intensity, as well as broader sustainability criteria and evidence requirements for eligible hydrogen pathways to comply with.
This section provides summary tables of those standards/schemes/relevant policies (referred to as standards thereafter when referenced collectively) listed in Table 1 and provides a snapshot of the key criteria. A detailed review of each standard can be found in Appendix B which focuses the discussion on key differences, along with key uncertainties and potential changes. The UK Low Carbon Hydrogen Standard (LCHS) is used as a benchmark for this comparison, as it sets the requirements for producers in Scotland receiving UK Government support. This review includes:
The scope of each standard, including:
- The type of standard (mandatory, voluntary), and who it was developed by.
- Geographies covered.
- Implementation status.
Eligibility criteria:
- Conversion technology or feedstock restrictions, including any biomass feedstock sustainability rules.
- Any GHG emission intensity thresholds.
- Any categories of hydrogen labelled by the standard.
GHG calculation methodology, including:
- System boundary – which parts of the supply chain are in or out of scope of the GHG emissions calculations. This can vary between standards, thereby potentially omitting or including significant emissions, and making comparison of results challenging between different standards.
- Splitting of emissions across co-products. When systems produce multiple outputs (product, co-products, wastes, residues, etc.), GHG emissions must be assigned between them. This can be done through various approaches, including through an allocation of emissions based on the relative masses, energy contents or economic value of the (co-)products. This can also be done by looking at the products these co-products would replace in the market (via system expansion) to assign substitution credits. Typically, wastes and residues are not assigned emissions. A full discussion of the various methods is provided in Appendix A.
- Reference flow – a set pressure and/or purity for the hydrogen product. Hydrogen produced at a lower pressure or purity may be required to account for the emissions for theoretical compression and/or purification to reach the reference flow, and in some standards, hydrogen produced at a higher pressure and/or purity than the reference may be given an emissions credit.
Other relevant requirements, such as:
- Chain of custody. This is the process of following and evidencing materials through steps of the supply chain, which provides insights into the product’s origin, components, processes, and handlers. As illustrated in Appendix A, there are different chain of custody models, and while some standards are explicit and prescriptive in their requirements on how to trace feedstocks and hydrogen products, others are not; and
- Renewable electricity sourcing. Some standards may impose requirements to ensure the use of renewable electricity for hydrogen production does not negatively impact the wider grid. These can include temporal correlation (matching generation with consumption over defined time periods), geographical correlation (rules about locations and grid connections) and “additionality” (hydrogen production contracting with new, rather than existing, renewable electricity generation).
In addition to national or regional standards and policies, and several voluntary schemes[1], a global hydrogen lifecycle GHG standard is also currently being developed by the International Organization for Standardization (ISO). This could enable greater harmonisation of GHG emission calculation methodologies across the globe. The implications of this scenario will be explored further in Chapter 3.
|
Region |
Relevant hydrogen standards[2] |
|---|---|
|
UK |
|
|
EU |
|
|
US |
|
|
International |
|
Summary of hydrogen standards
|
Standard |
Geographic scope |
Type of standard |
Status |
System boundary |
|---|---|---|---|---|
|
UK LCHS |
UK producers |
Mandatory government standard for accessing subsidy schemes |
Implemented. V3 is live (Dec 2023) |
Cradle to production gate |
|
EU RED |
Hydrogen consumed in the EU |
Directive (with Delegated Acts) |
REDII (Dec 2018) is fully transposed into Member State legislation and Delegated Acts (Feb 2023) are live. REDIII implemented (Oct 2023) but still being transposed |
Cradle to use |
|
EU Gas Directive |
Hydrogen consumed in the EU |
Directive (with draft Delegated Act) |
Implemented (July 2024), but still being transposed into Member State legislation. Delegated Act is pending, due by July 2025 |
Cradle to use |
|
CertifHy |
Hydrogen producers in EU, EEA and CH |
Voluntary standard, industry developed |
Implemented. V2 is live (April 2022) |
Cradle to production gate |
|
France Energy Code L. 811-1 |
Hydrogen consumed in France |
Mandatory standard for accessing subsidies, Government developed |
Implemented. V1 is live (July 2024) |
Cradle to use |
|
US IRA 45V |
US producers |
Tax credit |
Implemented. March 2024 revision is live |
Cradle to production gate |
|
IPHE |
Global producers and consumers |
Voluntary transnational effort on GHG methodology harmonisation |
Implemented. V3 is live (July 2023) |
Cradle to use |
|
ISO 19870 |
Global producers |
Voluntary standard, ISO developed |
Technical Specification published in Dec 2023, full standard 19870-1 under revision during 2024, due to be finalised in 2025 |
Cradle to production gate. ISO 19870 series will next look at downstream hydrogen vectors |
|
TÜV SÜD |
Global producers |
Voluntary standard, industry developed |
Implemented. V 11/2021 is live (Nov 2021) |
Cradle to production gate (GreenHydrogen), or to point of use (GreenHydrogen+) |
|
TÜV Rheinland |
Global producers |
Voluntary standard, industry developed |
Implemented. V2.1 is live (March 2023) |
Cradle to production gate or to point of use |
|
GH2 |
Global producers |
Voluntary standard, industry developed |
Implemented. V2 is live (Dec 2023) |
Cradle to production gate |
|
Scheme |
GHG threshold |
Category |
Eligible pathways |
Eligible main inputs |
Biomass sustainability |
|---|---|---|---|---|---|
|
UK LCHS |
20 gCO₂e/MJLHV |
“Low carbon” |
Electrolysis, Fossil/Biogenic gas reforming with CCS, Biomass/Waste gasification, Gas splitting producing Solid Carbon. Pathways can be added |
Electricity (all types), Fossil fuels, Biomass, Bio/fossil wastes & residues |
Biomass inputs must meet relevant Forestry, Land and/or Soil Carbon criteria, and report indirect land use change GHGs |
|
EU RED |
28.2 gCO₂e/MJLHV |
“Biofuel”, “RFNBO”, “RCF” |
All production pathways eligible but feedstock dependent |
Renewable electricity, Biomass & Fossil wastes |
Biomass feedstocks must meet relevant Forestry, Land and/or Soil Carbon criteria |
|
EU Gas Directive |
28.2 gCO₂e/MJLHV |
“Low carbon fuel” |
All pathways eligible |
Non-renewable energy sources |
Follows RED, where applicable |
|
CertifHy |
36.4 gCO₂e/MJLHV |
“Green” |
All pathways eligible |
Renewable energy sources |
Not specified |
|
“Low-carbon” |
Non-renewable sources | ||||
|
France Energy Code L. 811-1 |
28.2 gCO₂e/MJLHV |
“Renewable”, |
RFNBOs, RCF, nuclear-based |
Follows EU RED and adds nuclear electricity |
Follows EU RED |
|
US IRA 45V |
Increasing tax credits at 33.3, 20.6, 12.5 or 3.75 gCO₂e/MJLHV |
“Clean” |
All pathways eligible. Those not in 45V-GREET can apply for a “provisional emissions rate” |
Electricity (all types), Fossil fuels, Biomass |
None |
|
IPHE |
None, only a method |
No categories |
Electrolysis, steam cracking, fossil gas reforming + CCS, coal or biomass gasification + CCS, biomass digestion + CCS. More will be added |
Fossil fuel, Biomass, Bio/fossil wastes & residues |
Not specified |
|
ISO 19870 |
None, only a method |
No categories |
All pathways eligible |
Feedstock neutral |
None |
|
TÜV SÜD |
28.2 gCO₂e/MJLHV |
“Green” |
Electrolysis, Biomethane steam reforming, Glycerine pyro-reforming |
Renewable electricity, Bio waste/residue, Biomass |
Biomass feedstocks must meet EU RED criteria |
|
TÜV Rheinland |
28.2 gCO₂e/MJLHV |
“Renewable” |
Renewable electrolysis |
Renewable electricity |
Not specified |
|
“Low-carbon” |
All production pathways |
Feedstock neutral | |||
|
GH2 |
8.33 gCO₂e/MJLHV |
“Green” |
Electrolysis |
Renewable electricity |
Low iLUC risk, non-biodiverse land |
|
Scheme |
Chain of Custody |
Co-product allocation |
Reference flow |
Renewable power evidence |
|---|---|---|---|---|
|
UK LCHS |
Mass balance used, but cannot blend biomethane with nat gas (upstream) |
LHV energy allocation (Carnot efficiency for heat), plus system expansion for waste fossil feedstock counterfactual |
3 MPa, 99.9 vol% purity. If below, adjustment required |
Additionality not required. PPA with 30-minute temporal correlation from UK generator needed, or avoided curtailment proof |
|
EU RED |
Mass balance (H2 + upstream) |
LHV energy allocation (Carnot efficiency for heat). If co-product ratio can change, physical causality used. If co-product has zero LHV, economic allocation used |
None |
Renewable PPAs complying with additionality, temporal and geographic correlation rules |
|
EU Gas Directive |
Mass balance (H2 + upstream) |
Assumed to follow EU RED |
None |
In line with EU RED Delegated Act for RFNBOs |
|
CertifHy |
Book & Claim as GOs allowed (upstream) |
Defined approach for each pathway broadly follows EU RED. O2 method TBC |
Same as UK LCHS |
GOs are allowed. No additional requirements. |
|
France |
Follows EU RED |
Follows EU RED |
None |
Follows EU RED |
|
US IRA 45V |
None specified, but proposed mass balance for biomethane (upstream) |
System expansion. Restrictions placed on the size of steam co-product credit |
2 MPa, 100% purity. Adjustment required for higher/lower |
PPAs complying with additionality, temporal and geographic correlation |
|
IPHE |
None specified but GOs allowed (upstream) |
Follows hierarchy but recommended approach for each pathway differs |
Not specified |
GOs are allowed. Additionality not required. |
|
ISO 19870 |
None specified but GOs allowed (upstream) |
Can be system expansion or attributional. Approach defined for pathways differ |
None. GHG increase to reflect impurities and their release |
Grid GOs are allowed if ISO 14064-1 “proper quality criteria” are met |
|
TÜV SÜD |
Mass balance (H2 + upstream) |
Follows EU RED, but chlor-alkali has choice of energy allocation, economic allocation or system expansion |
Same as UK LCHS |
GreenHydrogen must follow EU RED. GreenHydrogen + must meet more stringent additionality rules. |
|
TÜV Rheinland |
None specified but assumed to follow EU RED & Gas Directive |
Assumed to follow EU RED & Gas Directive |
None |
PPAs to have temporal correlation (up to yearly) and geographic correlation within the same country. Additionality not required. |
|
GH2 |
Follows IPHE |
System expansion recommended, as oxygen nil LHV |
Same as UK LCHS |
Additionality, temporal and geographical correlations are allowed but not required |
Lifecycle GHG emission intensity of hydrogen pathways for import to the EU market
The GHG emission intensity of various hydrogen pathways from Scotland and other exporting countries were calculated using ERM’s in-house GHG assessment model. The hydrogen pathways modelled used a combination of the production, distribution, and use steps, set out in Table 5 below. For a comprehensive list of the GHG pathways modelled, refer to Appendix D, and see Table 8 for the assumptions and references used in the modelling process.
|
Production location |
Hydrogen production types |
Hydrogen transport |
Final use |
|---|---|---|---|
|
Scotland Norway France Morocco USA Chile UK |
Electrolysis using grid electricity Electrolysis using renewable electricity (excluding France) Electrolysis using nuclear electricity (only in France) Natural gas autothermal reforming with carbon capture & sequestration (ATR + CCS) |
Ammonia shipping Ammonia shipping with reconversion to hydrogen Compressed hydrogen shipping Compressed hydrogen pipeline |
Hydrogen in refinery boiler Ammonia in marine vessel |
Methodologies used to model lifecycle GHG emission intensity of imported hydrogen pathways
Section 2 detailed the various GHG calculation methodologies and compliance requirements set by key hydrogen standards that are currently active globally. In the EU market, EU RED and the EU Gas Directive currently set the eligibility criteria and the methodology for calculating the GHG emission intensity for imported hydrogen. As the hydrogen market becomes more established and globalised, there could be growing interest globally in harmonising approaches for GHG accounting (e.g. through alignment with ISO 19870). However, the EU has not yet expressed any intentions to do so. As such, two scenarios can be envisioned regarding possible evolutions of the EU’s approach for calculating life-cycle GHG emissions of hydrogen:
- Business-as-usual: The EU RED and EU Gas Directive will continue to apply for hydrogen imported in the EU, regardless of global methodologies such as ISO 19870.
- International alignment: The EU aligns with ISO 19870 at some future point in time, after publication.
The components of calculating the GHG emissions under these scenarios can be found in Appendix C. The key methodological differences considered during modelling include:
- System boundary: The system boundary for EU policies is ‘cradle-to-use’, whereas ISO/TS 19870 uses ‘cradle-to-production gate’. Results under scenario 2 therefore exclude potentially significant emissions from distribution of hydrogen to the EU.
- GHG threshold: EU sets a GHG threshold of 28.2 gCO2eq/MJLHV hydrogen, whereas ISO does not set a GHG threshold. As such, compliance with GHG thresholds were only carried out for results using the EU methodology.
- Reference flow: EU RED and the EU Gas Directive do not set a reference flow. The reference flow under ISO 19870 is set by the end-user but the GHG intensity is adjusted upwards for (project specific) impurities and their release.
- Co-product emission assignment: For electrolysis with co-product oxygen sales, economic allocation is required by EU RED, whereas ISO/TS 19870 currently recommends economic allocation or system expansion. For fossil gas reforming, the EU Gas Directive DA currently uses LHV energy allocation (with steam Carnot efficiencies), whereas ISO/TS 19870 has sub-division then LHV energy allocation (using steam enthalpy changes) or else system expansion. However, as no co-products are modelled for either electrolysis or reforming pathways in this study (it is assumed for simplicity there are no oxygen or steam customers), 100% of emissions in both scenarios are assigned to the hydrogen product.
At the time of writing this report, a draft version of the EU Gas Directive DA had been released for consultation and is still therefore subject to revision. This report follows the draft DA methodology to assess the GHG emissions of fossil natural gas hydrogen pathways under the BAU scenario (as outlined in Appendix C). However, due to uncertainty about the timings of reporting under the EU Methane Regulations, this report does not apply conservative default values for upstream natural gas emissions from the draft DA, and instead relies on the upstream natural gas GHG intensity given in the final published RED DA.
GHG emission intensity results
This section presents GHG emission results for various hydrogen production pathways under EU and ISO methodologies, including hydrogen used in refinery boilers and ammonia for marine vessels. Modelling have been carried out for production in 2023 and 2030 to reflect potential impacts from decarbonisation projections (e.g. grid decarbonisation, increased use of renewable fuels in transport), and technology improvements.
Specifically for the modelling of hydrogen production in Scotland, the National Grid country GHG intensity for Scotland is used, rather than the GB grid electricity average GHG intensity. From this point forward, the GHG intensity of electricity used for Scotland pathways is referred to as the “Scottish grid”.
In addition, a sensitivity analysis was conducted on the following parameters:
- Using renewable electricity across the entire pathway
- Using renewable heat for the ammonia cracking step of relevant pathways
- Using low-carbon marine fuel for shipping pathways
- Using the UK vs Scottish grid average intensity
Further details and results of this sensitivity analysis are given in Appendix F. These results are used in the GHG emission compliance scoring matrix to assess whether a previously non-compliant production pathway can adopt mitigation measures to meet the EU GHG threshold. This matrix can be found in Appendix G.
GHG emission results for pathways producing hydrogen for use in a refinery boiler under EU methodologies
A breakdown of the GHG emissions at each stage of the hydrogen production life-cycle is provided in Figure 1, Figure 2 and Figure 4. The value chain steps included in each stage include:
Feedstock emissions: this is only relevant to natural gas pathways (Figure 3), and accounts for the upstream emissions of natural gas inputs (e.g. extraction, transport, pre-processing, including methane leakage).
Hydrogen production emissions: these arise from the electrolysis or natural gas autothermal reforming with carbon capture (ATR+CCS) processes. Sources of emissions include electricity consumption, uncaptured fossil CO2 and chemical inputs.
Distribution emissions: these include compression, transport, storage, reconversion and downstream emissions. The emissions depend significantly on the hydrogen transport pathways.
- Ammonia pathways include conversion of hydrogen to ammonia, transport via truck to a port, port storage, shipping to Rotterdam, port storage, reconversion/cracking ammonia to hydrogen (requiring heating and catalysts), transport via pipeline to a refinery, and end use of hydrogen in a refinery combustion boiler.
- A separate end use case is modelled where instead of cracking and hydrogen transport, ammonia stored in Rotterdam is loaded onto a maritime vessel for combustion in the propulsion engines.
- The compressed hydrogen shipping pathways include compression of hydrogen for trucking, transport of hydrogen via truck to a port, port storage, shipping to Rotterdam, port storage, transport via pipeline to a refinery, and use of hydrogen in refinery combustion boiler.
- The compressed hydrogen pipeline pathways include compression of hydrogen, piping to Rotterdam, transport via pipeline to a refinery, and end use of hydrogen in a refinery combustion boiler.
- Transport to the EU via pipeline or via compressed hydrogen shipping were not modelled for the USA and Chile due to the long transport distance making these options unviable, following the previous ClimateXChange report.
The input values and assumptions used in the GHG modelling are detailed in Appendix E.
Figure 1 represents the GHG intensity of pathways that use renewable electricity for electrolytic hydrogen production, followed by distribution to the EU (using grid electricity and gas), before use of gaseous hydrogen in a refinery boiler. The exception is nuclear electricity with an emission factor of 3.64 gCO2e/MJ elec[3] being assumed to be used for electrolysis in France, which leads to higher production emissions compared to other regions using renewable electrolysis (0 gCO2e/MJ elec).
These results show that hydrogen produced from renewable electricity-based electrolysis is likely to meet the EU GHG threshold when transported as compressed hydrogen. However, transporting compressed hydrogen via ships generates higher emissions compared to transport via pipeline due to the fuel used for trucking and shipping, plus additional electricity requirements for storage at the shipping ports.
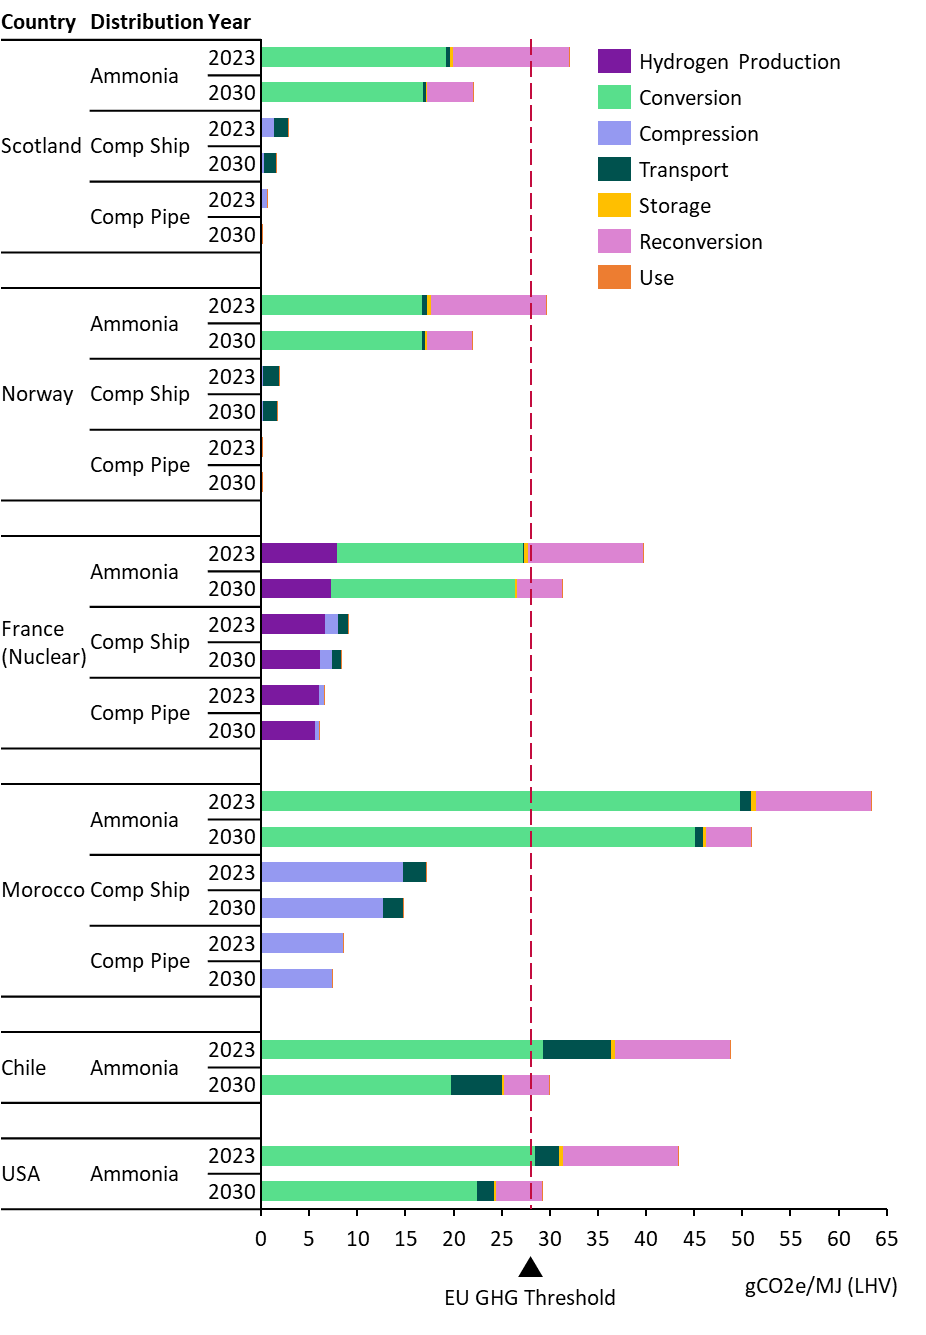
Emission intensities of hydrogen using ammonia as an intermediary vector are significantly higher than those of gaseous hydrogen pathways and may not meet the EU threshold in 2030. This is primarily due to the use of grid electricity in distribution steps, the efficiency losses in the (re)-conversion steps, and the release of nitrous oxide during ammonia production. Only Norway and Scotland might comply by 2030, due to low enough emission grid electricity in these countries. Emissions from the conversion step (ammonia production) remain significant in 2030 due to the release of nitrous oxide emissions, and the ammonia cracking step uses Netherlands grid electricity which has a high GHG intensity (although this improves significantly by 2030).
Figure 2 below shows the GHG intensity results if grid electricity is used for electrolysis instead of renewable electricity. Note the change in x-axis scale between the two graphs.
In these pathways, the emissions factor of the grid is the most important contributor to overall GHG emissions intensity of delivered hydrogen. Decarbonisation of electricity grids in some countries (i.e. Scotland and France) may enable some of the pathways to achieve the EU GHG threshold in 2030. However, gaseous pathways from Norway are expected to already comply.
For Scottish pathways, the average grid factor for Scotland was used in the GHG modelling (see Appendix E for details). This assumes that the Scottish grid intensity could be used under EU rules instead of the GB grid average, however, it remains unclear how EU rules on bidding zones apply to Scotland. A sensitivity analysis in Appendix F explores the GHG impact of using the GB grid average compared to the Scottish grid average. The results in Figure 2 show that using the Scottish grid factor in electrolysis results in the GHG emission intensity of piped and shipped compressed hydrogen pathways close to the EU GHG threshold in 2023 but easily achieving it by 2030 as the Scottish grid decarbonises. Ammonia pathways from Scotland may just meet the threshold in 2030 as electricity grids in Scotland and the Netherlands decarbonise.
Pipeline hydrogen pathways are all expected to fall below the EU GHG threshold in 2030 as electricity grids decarbonise, except for Morocco, which has a significantly higher grid GHG intensity compared with other countries. Hydrogen production in countries with high shares of fossil fuel power generation in their grid mix will have to rely on renewable electricity (Figure 1 results) to export to EU markets. For example, neither of the grid electrolysis pathways from Chile or the USA are expected to be able to meet the EU threshold, due to both high grid GHG intensities and additional emission arising from ammonia supply chains.
It is important to note that hydrogen produced from grid electricity is likely to have both renewable and non-renewable consignments. Both consignments will have the same GHG intensity under EU rules, and if this is low enough to meet the EU GHG threshold, the renewable fraction may be eligible as a RFNBO under EU RED, and the non-renewable fraction may be eligible under the EU Gas Directive.
As shown in Figure 3, natural gas reforming with CCS pathways may struggle to meet the EU Gas Directive’s GHG emission threshold (same as the EU RED threshold). The emissions of hydrogen produced from these pathways are very sensitive to upstream natural gas intensities, which are highly uncertain and can be highly variable depending on the source of natural gas (e.g. imported LNG can have much higher intensities than domestic gas supplies used for hydrogen production).
The European Commission is expected to establish a methodology for calculating the methane emissions of fossil feedstocks (including natural gas) at a producer level by 2027. In the absence of this more accurate data, an upstream natural gas intensity of 12.7 gCO2e/MJLHV natural gas was used to model both USA and UK reforming pathways, based on the published generic value in the EU RED DA. However, individual producers or countries could have intensities significantly above this value. This value will likely need to be updated as more accurate, audited data is reported by the fossil gas industry.
In the UK, pathways with compressed shipping or pipeline could meet the EU GHG emission threshold. In contrast, long transport distances from the USA to the EU means that it is not feasible to transport hydrogen via compressed shipping or pipeline (requiring large additional emissions from ammonia distribution), leading to the UK natural gas pathways via compressed hydrogen distribution having a significant GHG advantage compared with ammonia pathways from the USA.
GHG emission results for pathways producing ammonia for use in a marine vessel under EU methodologies
Ammonia was also modelled as the end-product for use in a marine vessel in Rotterdam. As shown below in Figure 4, Figure 5 and Figure 6, GHG emissions of these ammonia use pathways are lower than pathways with hydrogen as the end-product because ammonia reconversion back to hydrogen is not required. As in the previous analysis, grid electricity is assumed to be used for ammonia distribution (conversion, storage, reconversion) in both grid and renewable electricity-based electrolysis pathways.
Ammonia produced using renewable electricity (Figure 4) is likely to comply with the EU GHG threshold in 2023 and 2030 in both Scotland and Norway, and may just comply in France by 2030. Similar to the earlier analysis, production in the US and Chile may still struggle to comply, as the conversion step (ammonia production) accounts for a significant portion of the total pathway emissions. This is due to the release of nitrous oxide emissions, the use of grid electricity in distribution and losses in conversion efficiency.
Grid electricity-based ammonia produced in all countries modelled in this study (Figure 5) is unlikely to meet the threshold, except for Norway in both years and for Scotland in 2030. As discussed in the previous section, only the renewable portion of the ammonia would likely qualify under EU RED, the remaining portion would need to qualify under the EU Gas Directive. As shown in Figure 6, even avoiding emissions from reconversion of ammonia to gaseous hydrogen does not sufficiently reduce the emissions of natural gas reforming pathways via ammonia to comply with the EU GHG threshold.
gCO2e/MJ (LHV)
Processing
Conversion
Compression
Transport
Storage
Reconversion
Downstream
GHG emission results for hydrogen production pathways under ISO 19870 methodology
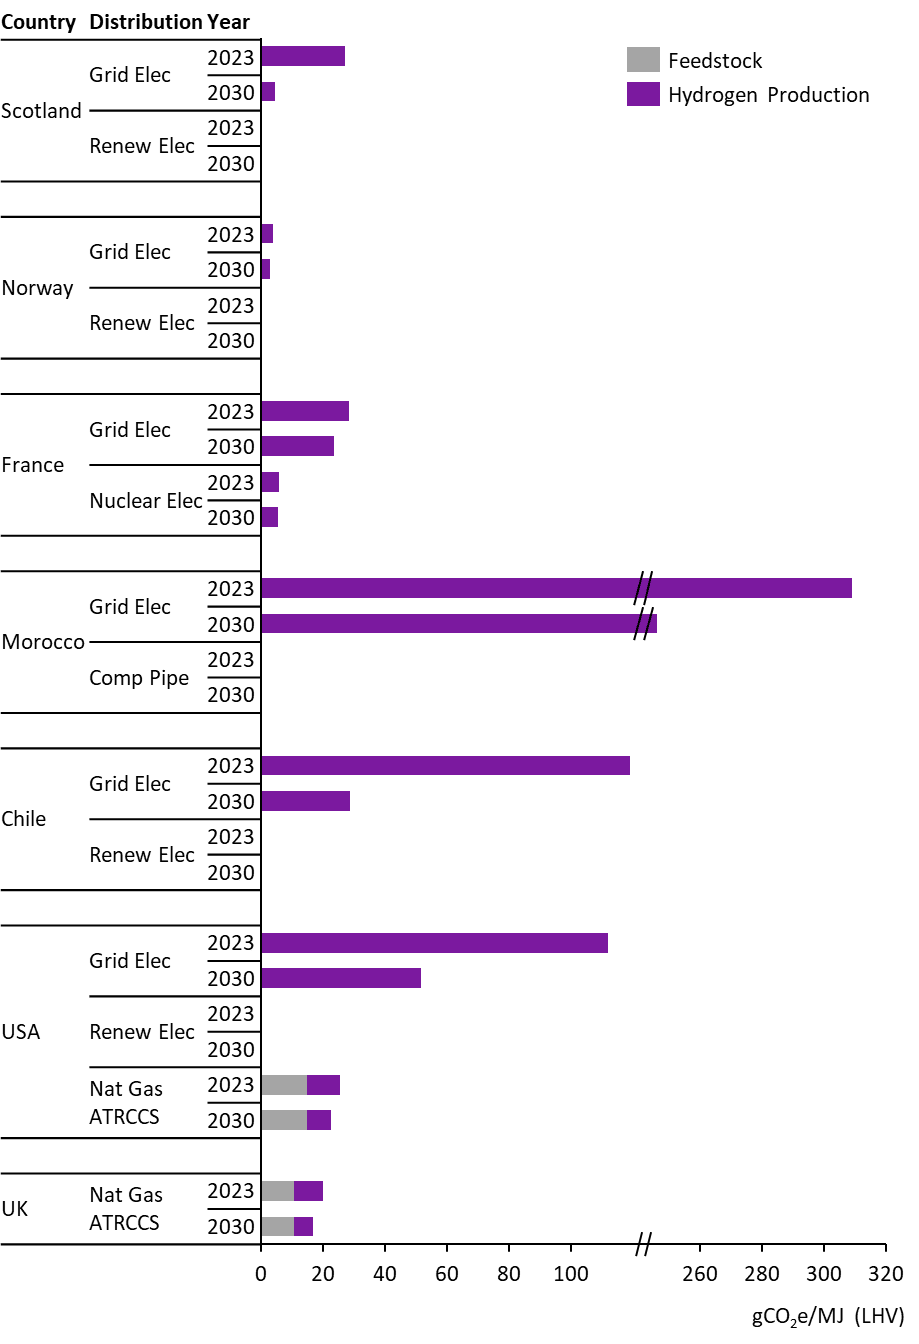
The GHG emission intensities of pathways modelled under the ISO methodology are shown below in Figure 7. Only emissions from feedstock and hydrogen production are modelled given the current ISO 19870 system boundary is “cradle to production gate” and does not include any downstream steps. There is also no GHG emissions threshold under ISO 19870, so compliance is not assessed.
Emissions for renewable electrolysis pathways are close to zero because there are only very small emissions for consumed water and minor chemicals. Emissions for delivered wind, hydro and solar electricity are considered to be zero, as in EU RED. Once again, grid electricity intensities dominate the grid electrolysis results.
For the natural gas reforming pathways, the difference in emissions between the UK and USA is mainly due to differences in upstream natural gas emissions intensities and grid electricity intensities. Under the ISO methodology, which allows producer, region or country-specific data to be used, the upstream natural gas intensities in the ISO analysis are assumed to be 8.7 and 9.2 gCO2e/MJLHV natural gas for the UK and USA respectively, based on current published UK and US government data.
These values could be significantly underestimating true upstream emissions, including the impact of LNG imports and methane leakage rates, and are lower than the generic single value the EU RED DA applies to all natural gas supplies (12.7 gCO2e/MJLHV natural gas). However, UK and US government data is likely to be updated more frequently (e.g. annually) in light of new evidence or updated gas source mixes compared to the single value published in the EU RED DA (which is based on the JEC WTT v5 study from 2020).
Those applying the ISO methodology are not required to use government estimates and could use other credible sources, including producer-specific data. This means that natural gas intensities under the ISO method are likely to vary significantly between projects, although where several credible options exist, there may be pressure from projects to choose lower values. In contrast, the EU Gas Directive requires the phasing in of producer-specific methane intensity data and does not give a choice as to which dataset to use.
The ISO 19870 method requires adjustments upwards for impurities by mass, and applies GWPs assuming the impurities are released. This may slightly affect the results, depending on the project-specific impurities. The engineering design data used assumes high purities (>99.9% by volume), so hydrogen product compositions were not modelled. However, for hydrogen production facilities that generate hydrogen at lower purities (e.g. 95-99% by volume), these impurity adjustments have a more significant impact, as hydrogen purity by mass is significantly lower than purity by volume.
Conclusions and recommendations
Key hydrogen standards globally already set out different GHG calculation methodologies and compliance requirements for producers. Hydrogen imported to the EU market must comply with rules set by the EU Renewable Energy Directive (RED) and the EU Gas Directive, if they are to contribute towards targets set under these policies. While an international standard is being developed (ISO 19870), it is unclear if the UK or EU will align with it in the future.
With regard to GHG emissions, electrolytic hydrogen produced in Scotland and exported to the EU market could be one of the most competitive among the countries we studied. Today, electrolytic hydrogen produced from renewable electricity in Scotland can already meet the EU RED GHG emission threshold. Further grid decarbonisation would increase the likelihood of compliance for grid connected electrolysis by 2030, even if the GB grid average factor has to be used under EU rules instead of the (much lower) Scottish grid average. Of the other countries considered in this study, only Norway with its hydro-electric dominated grid can deliver electrolytic hydrogen to the EU with lower GHG emissions than Scotland.
When transported over short distances as compressed hydrogen via pipelines or ships, electrolytic hydrogen produced using low-carbon electricity is expected to meet the EU GHG threshold. This applies in both 2023 and 2030 to renewable hydrogen produced in Scotland (930 km), Norway (1,312 km) and Morocco (2,747 km by ship, 1,930 km by pipeline), as well as nuclear electricity-derived hydrogen from France (261 km by ship, 435 km by pipeline).
Transporting hydrogen as ammonia leads to significantly higher GHG emissions. Producers relying on ammonia for long-distance transport from countries such Chile and the USA may need to adopt additional emission reduction measures to comply with EU policies, particularly if ammonia is reconverted to hydrogen for final use. Over shorter distances, hydrogen produced in Scotland or Norway using renewable electricity and transported as ammonia is likely to comply with the EU GHG emission threshold by 2030. However, in France, ammonia pathways will only meet the EU threshold if ammonia is used as the end-product in 2030 due to additional emissions from nuclear electricity inputs. Meeting the threshold requires further emission reduction measures such as using renewable electricity for hydrogen distribution.
Only countries with a high share of low-carbon electricity on their grid can produce grid-based electrolytic hydrogen meeting the EU GHG threshold. In 2023, grid electricity-based hydrogen from Norway can already meet the EU threshold when transported as compressed hydrogen. Scotland could also achieve compliance if compressed hydrogen is transported via pipelines. By 2030, all production pathways in Scotland can meet the EU threshold if the GHG intensity of grid electricity specific to Scotland decarbonises in line with policy aspirations. However, if GB’s grid emission intensity is used, only the hydrogen pipeline transport pathway could meet the threshold by 2030, assuming the grid decarbonises as planned. Hydrogen produced from fossil heavy electricity grid mixes such as those in Morocco, Chile and the USA will not be compliant.
Many natural gas pathways modelled will not comply with the EU Gas Directive threshold. These pathways are highly sensitive to the upstream GHG intensity of natural gas, which is uncertain and can be highly variable depending on the natural gas source (e.g. imported LNG with high intensities). Based on the default upstream natural gas intensity published in the EU RED Delegated Act 2023/1185 (as the EU Gas Directive Delegated Act is not yet finalised), natural-gas derived hydrogen produced in the UK could be compliant when piped or shipped as compressed hydrogen, giving it an emissions advantage over US natural gas-derived hydrogen (transported via ammonia).
GB’s electricity grid has a significantly higher GHG intensity than Scotland, so further clarity on the definition of bidding zones in the EU RED Delegated Act is critical. Using the GB grid average for grid-electrolysis projects in Scotland results in high risk of non-compliance with the EU GHG threshold (see Appendix F for results of this analysis), whereas use of grid GHG intensity data specific to Scotland would confer significant advantages on grid electrolysis projects, including exemptions from some EU requirements.
This GHG emission analysis could be combined with the previous CXC cost analysis to evaluate the overall competitiveness of these hydrogen pathways. Further work could also provide a view on the costs of adopting the different emission reduction measures discussed in the sensitivity analysis section of this report. Appendix H provides an abatement cost methodology, to calculate the minimum cost of compliance for those pathways above the EU GHG threshold but where emissions reduction measures could lead to compliance. We also note that implementation of the hydrogen and ammonia pathways modelled in this study may require significant investment in new infrastructure for some countries, and these infrastructure needs and any first-mover advantages could be investigated further.
Recommended next steps
The following recommendations could be considered for follow-on work:
- Expand the sensitivity analysis to cover additional sensitivities:
- Low-emission trucking
- Nitrous oxide mitigation
- Sensitivities in 2023, given several grid-electrolysis pathways do not consider any sensitivities in 2023
- Expand the analysis to include:
- Other distribution options e.g. methanol, liquid organic hydrogen carriers (LOHC)
- Additional time periods e.g. 2040 and 2050
- Additional emerging export regions e.g. Oman, Egypt, Australia, Namibia
- Combine the previous CXC cost analysis with the GHG emission analysis in this study to evaluate the overall competitiveness of the hydrogen and ammonia pathways
- Integrate upstream fossil fuel emissions intensity data once more reliable data is available e.g. EU methane regulations, any UK studies
We also suggest engagement with policymakers on the following aspects:
- Confirm with the European Commission whether Scotland counts as a country with its own GHG intensity or whether the GB grid bidding zone takes priority
- The EU Gas Directive Delegated Act as it is finalised and published, as interpretation of these rules could significantly impact fossil pathways
- The potential impacts of ISO 19870 once published, including the level of EU engagement or willingness to align with the standard, and when downstream hydrogen vectors e.g. ammonia will be included in future iterations of ISO 19870.
References
Arup. (2024). Cost reduction pathways of green hydrogen production in Scotland – total costs and international comparisons. Available at: https://www.climatexchange.org.uk/projects/green-hydrogen-production-and-international-competitiveness/
BEIS. (2023). Decarbonisation of the power sector. Available at: https://committees.parliament.uk/publications/39325/documents/193081/default/
CertifHy. (2023). SD Carbon footprint calculation. Available at: https://www.certifhy.eu/wp-content/uploads/2023/03/CertifHy_Carbon-footprint-calculation_220214.pdf
CertifHy. (2022). CertifHy-SD Hydrogen Criteria. Available at: https://www.certifhy.eu/wp-content/uploads/2022/06/CertifHy_H2-criteria-definition_V2.0_2022-04-28_endorsed_CLEAN-1.pdf
CERTIFHY. (n.d.). CERTIFHY DOCUMENTS – CERTIFHY. Available at: https://www.certifhy.eu/certifhy-documents/
Circularise. (2022). Four chain of custody models explained. Available at: https://www.circularise.com/blogs/four-chain-of-custody-models-explained
Department for Energy Security & Net Zero (DESNZ). (2023). UK Low Carbon Hydrogen Standard. Available at: https://assets.publishing.service.gov.uk/media/6584407fed3c3400133bfd47/uk-low-carbon-hydrogen-standard-v3-december-2023.pdf
Ding, Y., Baldino, C. and Zhou, Y. (2024). Understanding the proposed guidance for the Inflation Reduction Act’s Section 45V Clean Hydrogen Production Tax Credit. Available at: https://theicct.org/wp-content/uploads/2024/03/ID-132-%E2%80%93-45V-hydrogen_final2.pdf
E4tech. (2021). Options for a UK low carbon hydrogen standard Final report. Available at: https://assets.publishing.service.gov.uk/media/616012fce90e071979dfebba/Options_for_a_UK_low_carbon_hydrogen_standard_report.pdf
Ember. (n.d.). Electricity Data Explorer | Open Source Global Electricity Data. Available at: https://ember-climate.org/data/data-tools/data-explorer/
European Union. (2023a). DIRECTIVE (EU) 2023/2413 OF THE EUROPEAN PARLIAMENT AND OF THE COUNCIL of 18 October 2023 amending Directive (EU) 2018/2001, Regulation (EU) 2018/1999 and Directive 98/70/EC as regards the promotion of energy from renewable sources, and repealing Council Directive (EU) 2015/652 (EU RED III). Available at: https://eur-lex.europa.eu/legal-content/EN/TXT/?uri=CELEX:02018L2001-20220607
European Union. (2023b). Commission Delegated Regulation (EU) 2023/1184 of 10 February 2023 supplementing Directive (EU) 2018/2001 of the European Parliament and of the Council by establishing a Union methodology setting out detailed rules for the production of renewable liquid and gaseous transport fuels of non-biological origin. Available at: https://eur-lex.europa.eu/legal-content/EN/TXT/?uri=uriserv%3AOJ.L_.2023.157.01.0011.01.ENG&toc=OJ%3AL%3A2023%3A157%3ATOC
European Union. (2024a). Directive – EU – 2024/1788 of the European Parliament and of the Council of 13 June 2024 on common rules for the internal markets for renewable gas, natural gas and hydrogen. Available at: https://eur-lex.europa.eu/legal-content/EN/TXT/PDF/?uri=OJ:L_202302413
European Union. (2024b). Texts adopted – Common rules for the internal markets for renewable gas, natural gas and hydrogen (recast) – Thursday, 11 April 2024. Available at: https://www.europarl.europa.eu/doceo/document/TA-9-2024-0283_EN.html
European Union. (2024c). Methodology to determine the greenhouse gas (GHG) emission savings of low-carbon fuels. Available at: https://ec.europa.eu/info/law/better-regulation/have-your-say/initiatives/14303-Methodology-to-determine-the-greenhouse-gas-GHG-emission-savings-of-low-carbon-fuels_en
European Union. (2024d). Regulation (EU) 2024/1787 of the European Parliament and of the Council of 13 June 2024 on the reduction of methane emissions in the energy sector and amending Regulation (EU) 2019/942. Available at: https://eur-lex.europa.eu/legal-content/EN/TXT/?uri=OJ:L_202401787
GHG Protocol. (n.d.). GHG Protocol Scope 2 Guidance. Available at: https://ghgprotocol.org/sites/default/files/2023-03/Scope%202%20Guidance.pdf
GH2 Standard. (2023). The Global Standard for Green Hydrogen and Green Hydrogen Derivatives. Available from: https://gh2.org/sites/default/files/2023-12/GH2_Standard_2.0_Dec%202023.pdf
International Partnership for Hydrogen and Fuel Cells in the Economy (IPHE). (2023). Methodology for Determining the Greenhouse Gas Emissions Associated with the Production of Hydrogen. Available at: https://www.iphe.net/_files/ugd/45185a_8f9608847cbe46c88c319a75bb85f436.pdf
International PtX Hub. (2023). Introduction to the IPHE methodology. Available at: https://ptx-hub.org/wp-content/uploads/2023/08/International-PtX-Hub_202308_IPHE-methodology-electrolysis.pdf
International Organization for Standardization (ISO). (2023). ISO/TS 19870:2023. Hydrogen technologies — Methodology for determining the greenhouse gas emissions associated with the production, conditioning and transport of hydrogen to consumption gate. Available at: https://www.iso.org/standard/65628.html
Martin, P. (2023). France to launch €4bn contracts-for-difference programme to support clean hydrogen production | Hydrogen Insight. Available at: https://www.hydrogeninsight.com/policy/france-to-launch-4bn-contracts-for-difference-programme-to-support-clean-hydrogen-production-reports/2-1-1508431
République Francaise. (2024). Decree of 1 July 2024 specifying the greenhouse gas emissions threshold and the methodology for qualifying hydrogen as renewable or low-carbon. Available at: https://www.legifrance.gouv.fr/jorf/id/JORFTEXT000049870616
Scottish Government. (2022). Hydrogen action plan. Available at: https://www.gov.scot/publications/hydrogen-action-plan/pages/3/
Scottish Renewables. (2021). Renewable Energy Facts & Statistics | Scottish Renewables. www.scottishrenewables.com. Available at: https://www.scottishrenewables.com/our-industry/statistics
TÜV Rheinland. (2023). Standard H2.21 Renewable and Low-Carbon Hydrogen Fuels. Available at: https://www.tuv.com/content-media-files/master-content/global-landingpages/images/hydrogen/tuv-rheinland-hydrogen-standard-h2.21-v2.1-2023-en.pdf
TÜV SÜD. (2021). Standard CMS 70 Production of green hydrogen (GreenHydrogen). Available at: https://www.tuvsud.com/en-gb/-/media/global/pdf-files/brochures-and-infosheets/tuvsud-cms70-standard-greenhydrogen-certification.pdf
US Department of Energy (DOE). (2024). Guidelines to Determine Well-to-Gate Greenhouse Gas (GHG) Emissions of Hydrogen Production Pathways using 45VH2-GREET Rev. March 2024. Available at: https://www.energy.gov/sites/default/files/2024-05/45vh2-greet-user-manual_may-2024.pdf
Appendices
Appendix A Definitions
Chain of custody
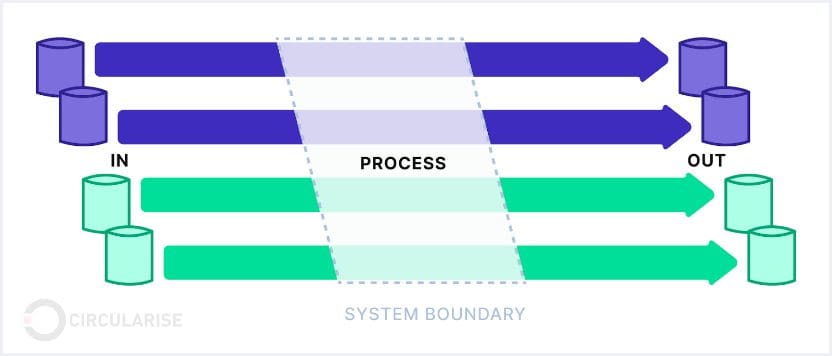
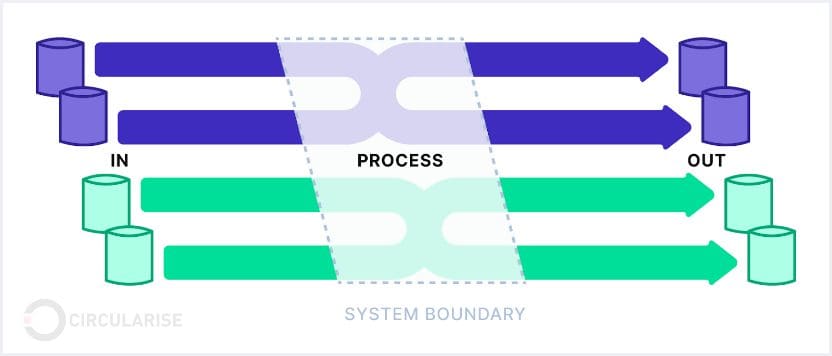
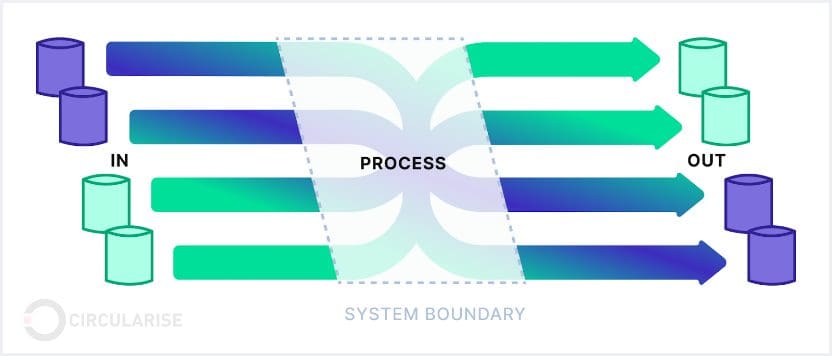
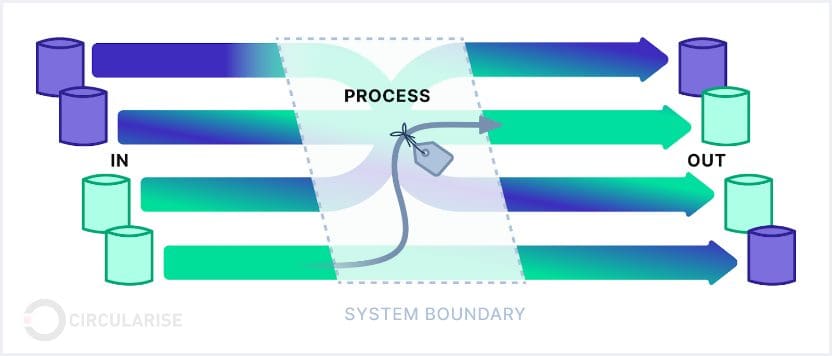
There are 4 types of chain of custody models to trace sustainability throughout supply chains. They are listed below in order of high to low level of physical connection required (Circularise, 2022).
|
Identify preservation – this model does not allow the certified product from a certified site to mix with other certified sources. It requires tracking the actual molecule of the material as they move through the supply chain. |
 |
|
Segregation – this model requires the certified product from a certified site to be kept separately from non-certified sources. However, it allows different certified sources to be mixed if they share the same defined standard. |
 |
|
Mass balance – this model tracks the total amount of sustainable content through virtual balancing of physical allocation. It allows the mixing of sustainable and non-sustainable materials producers and end-users must operate within the same ecosystem (e.g. gas grid). |
 |
|
Book-and-claim – the sustainable attributes are tracked virtually where sustainable and non-sustainable materials flow freely through the supply chain without the requirement of them being supplied and used in the same ecosystem. |
 |
In addition to the 4 types of chain of custody models, some hydrogen standards also use Environmental Attribute Certificates (EAC). This is a mechanism to demonstrate to end-users that a product (e.g. hydrogen, electricity, biogas) is produced from renewable sources. EACs enable the decoupling of physical goods from their environmental attributes, and can take the form of guarantees of original (GOs), renewable electricity certificates (RECs), etc. EACs could adopt either a mass balance or book-and-claim chain of custody model, or a combination of both. As such and where possible, the report uses terms referenced directly in the hydrogen standards.
Emission allocation methods
Hydrogen production pathways can generate co-products. Consequently, the total emissions resulting from the hydrogen production (and its upstream emissions) should be divided between the hydrogen and its co-products where these co-products are valorised. Outputs that would normally be discarded or that do not carry any economic value are considered as wastes or residues and do not receive any emissions burden. There are multiple methods of assigning emissions to the co-products, as described below.
System expansion – In this method, co-products are considered alternatives to other products on the market. The emissions avoided as a result of this replacement is subtracted from the product system, whereby the remaining net emissions are assigned to the main product (e.g. hydrogen). This requires understanding of the counterfactuals (i.e. the GHG emission of the products being replaced).
Energy allocation – Emissions are assigned to each co-product based on their energy content (generally on the basis of lower heating values). This can also include application of Carnot efficiencies or enthalpy changes to only account for the useful heat contained within any steam/heat co-products.
Physical causality – This allocation method is specifically mentioned in EU RED for processes where the ratio of the co-products produced can be changed. In these processes, the allocation should be determined based on physical changes in emissions, by incrementing the output of just one co-product whilst keeping the other outputs constant.
Economic allocation – Emissions are allocated in proportion to the (co-)product economic values based on total revenues obtained for each.
Mass allocation – Rarely used, but emissions would be allocated in proportion to the (co-)product mass flows.
Appendix B Detailed review of international hydrogen standards
UK Low Carbon Hydrogen Standard (LCHS)
The UK’s Low Carbon Hydrogen Standard (LCHS) was published in 2022 to support the implementation of the UK Hydrogen Strategy, setting requirements that UK hydrogen projects must meet to access revenue support under the Hydrogen Production Business Model and/or the Net Zero Hydrogen Fund (DESNZ, 2023).
Eligibility
The LCHS is feedstock neutral, but hydrogen must be produced via an eligible pathway as shown in the summary table in Table 3. New pathways can apply to be added to this list.
The LCHS sets a maximum GHG emission threshold of 20 gCO2e/MJLHV of hydrogen product (DESNZ, 2023). This threshold is applicable to a ‘cradle-to-production gate’ system boundary, which includes emissions from feedstock production up to and including hydrogen production.
Hydrogen derived from biogenic inputs is required to satisfy biomass feedstock Sustainability Criteria (Land, Soil Carbon and/or Forest Criteria, following those established in EU RED), and >50% of any biogenic hydrogen must be derived from waste or residue feedstocks. Indirect land use change emissions are also required to be reported separately.
GHG calculation methodology principles
Under the LCHS, hydrogen producers using electricity must demonstrate one of the following electricity supply configurations:
- Power Purchase Agreement (PPA) with a specific generator or private network. Here, physical delivery including losses and 30 minute temporal correlation (showing delivered volumes of electricity at least match the electricity consumption) is required for producers to use the GHG intensity of that generator or private network; or
- Grid electricity supply, where the GHG intensity is determined by the 30 minute average grid factor (GB or Northern Ireland, as applicable); or
- Grid electricity that would otherwise have been curtailed, which is permitted to use nil GHG intensity.
Proof of renewable electricity additionality is not a requirement of the UK LCHS (e.g. new windfarms do not have to be built to supply a hydrogen production facility). The LCHS requires that the contracted electricity generator must be located within the UK but does not impose further geographical correlation rules.
The LCHS uses energy allocation to assign GHG emissions based on (co-)products’ lower heating value energy contents. When heat or steam are produced as co-products, Carnot efficiencies[5] are applied for the energy allocation. However, the LCHS also requires that pathways using waste fossil feedstocks account for their displaced counterfactual emissions (i.e. the emissions that would have occurred if the feedstock had not been diverted to hydrogen production), which is a partial inclusion of a system expansion method.
A pressure of 3MPa and purity of 99.9% by volume is used as a reference flow under the LCHS. If the hydrogen produced is below these values, the theoretical emissions from compression and/or purification required to reach the reference flow need to be added. No adjustment is made if hydrogen is produced above the reference flow values.
Other requirements
Under the UK LCHS, mass balance chain of custody is generally used for upstream supply chains. However, the LCHS also currently states that biomethane cannot be mixed with fossil natural gas at any point, i.e. imposing an identity preserved chain of custody for biomethane feedstocks.
Uncertainties and future direction
Uncertainties in the LCHS include if/when downstream emissions from producer to user might be included within the system boundary, if/when hydrogen producers will be able to report producer-specific upstream natural gas GHG intensities (given the current lack of methodology and paucity of fossil industry data), plus when fugitive hydrogen emissions might be accounted for (and at what Global Warming Potential). It is also unclear how the UK LCHS will interact with ISO-19870 once published.
EU Renewable Energy Directive (RED)
Under EU law, regulations are directly applicable and binding in all Member States without the need for national implementation. Directives, on the other hand, set goals that Member States must achieve, and require Member States to first transpose them into national law, which allows for differences in policy mechanisms to arise in how these goals are met.
The Renewable Energy Directive (RED) is the legal framework for the development of clean energy across all sectors of the EU economy which Member States must transpose into national law (European Union, 2023a). Unlike the UK LCHS which currently only determines the eligibility for domestic UK hydrogen production to receive financial support, the RED mandates renewable energy consumption more broadly. Under EU RED, both domestically produced and imported hydrogen can contribute towards Member States’ compliance with renewable energy targets (European Union, 2023a).
Eligibility
EU RED does not prescribe a list of eligible technology pathways but evaluates eligibility based on fuel type, which is defined by the feedstock used to produce hydrogen.
- Biofuel – hydrogen produced from biomass that meets RED sustainability criteria;
- Recycled carbon fuels (RCF) – hydrogen produced from waste streams of non-renewable origin (European Union, 2023a);
- Renewable fuel of non-biological origin (RFNBO) – hydrogen derived from renewable energy sources other than biomass.
When used in transport, biofuels, RCFs and RFNBOs must achieve at least 70% GHG emissions savings (variable depending on year of commissioning) compared to the fossil fuel comparator of 94 gCO2eq/MJ. This means that lifecycle GHG emissions must be below 28.2 gCO2eq/MJLHV hydrogen. This threshold is measured on a ‘cradle-to-use’ system boundary, which goes beyond the UK LCHS’s ‘cradle-to-production gate’ system boundary.
GHG calculation methodology principles
In the EU, rules determining the GHG emission intensity of electricity inputs are set by the Delegated Act (DA) on renewable electricity under EU RED (European Union, 2023b). This states that renewable electricity from direct connections and PPAs need to meet additionality requirements to be considered to have nil GHG impact. Grid connected facilities with PPAs must also fulfil temporal and geographical correlation requirements, with some exceptions.
- Additionality: Requires that hydrogen production is connected to new (i.e. less than 36 months before the electrolyser starts operation), rather than existing, renewable energy generation assets. Additionality is not required before 2028, and for plants built before 2028, it is only required starting in 2038. This is different to the UK LCHS, which does not have additionality requirements.
- Temporal correlation: Until 2030, this rule requires that hydrogen must be produced within the same calendar month as the renewable electricity used to produce it, and hourly thereafter (European Union, 2023b). This is more relaxed than the 30-minute requirement in the UK LCHS.
- Geographical correlation: Requires that the hydrogen producer must be in the same bidding zone as the renewable energy installation or in an interconnected bidding zone with day ahead prices higher than that of the renewable generation asset.
- Exceptions: Additionality is not required for renewable PPAs with temporal and geographical correlation where the emission intensity of the bidding zone is <18gCO2/MJe. Bidding zones with >90% renewables do not have to meet any of these three criteria provided that the load hours of the hydrogen production plant are lower than the grid’s renewability share.
Similar to the UK LCHS, the default allocation method for hydrogen production pathways under EU RED is based on lower heating value (LHV) energy content for any co-product fuel, electricity or heat/steam (applying Carnot efficiencies). However, EU RED states that if the plant can change the ratio of the co-products produced, physical causality allocation is used (see definition in Appendix A). If co-products are produced that have no LHV energy content (e.g. oxygen, chlorine), GHG emissions are shared among co-products through economic allocation, based on the average factory-gate values of the (co-)products over the last three years. As with the UK LCHS, waste fossil feedstocks used for RCF production account for their displaced counterfactual emissions. EU RED sets no reference flow, with purity and pressure requirements only determined by the end user.
Uncertainties and future direction
According to the DA on renewable electricity (European Union, 2023b), the GHG emission intensity of grid electricity is determined at the level of countries or at the level of bidding zones. Different bidding zones do not currently exist in the GB power grid, but it is unclear how the DA defines a country. If Scotland is defined as a country under the DA, grid electrolysis projects could claim nil emissions for their input electricity without having to meet rules on additionality, temporal and geographical correlation, as Scotland’s grid has more than 90% renewables (Scottish Renewables, 2021). This would be a significant advantage and allow these projects to reduce their input electricity costs due to the lower regulatory burden. But if not defined as a country under the DA, these projects would have to take the GHG intensity of the GB grid, which only had an approximately 50% renewable share in 2023 (Ember, n.d.), requiring producers to instead procure renewable electricity PPAs that meet additionality, temporal and geographical correlation rules to claim nil emissions for the input electricity.
There are also uncertainties as to how individual Member States will implement the latest revised version of the RED, given that there is a May 2025 deadline for RED III to be transposed into national laws. Even within the confines of RED III, the policy mechanisms created and pathways deemed eligible by Member States can vary across the EU.
EU Gas Directive
The EU Gas Directive (formally called the Directive on common rules for the internal markets for renewable gas, natural gas and hydrogen) was published in July 2024 as part of the Hydrogen and Decarbonised Gas Market Package, it established a framework for the development of the future gas market in the EU, and its scope includes renewable and low-carbon hydrogen. Renewable hydrogen is defined as bio-hydrogen and RFNBO hydrogen, which must follow RED requirements (European Union, 2024a), whereby the EU Gas Directive sets requirements for low-carbon nuclear and fossil-fuel based pathways (outside of fossil waste derived RCFs) that are not currently covered by RED. This policy shares many similarities with the methodology set under RED, including a GHG emission threshold of 28.2 gCO2e/MJLHV and a ‘cradle-to-use’ system boundary.
The European Commission has until July 2025 to adopt a Delegated Act (DA) specifying the GHG methodology for low-carbon fuels (other than RCFs) (European Union, 2024b). On September 27, 2024, a draft version of this DA was released for public consultation (European Union, 2024c).
This draft version sticks to the same RED renewable power sourcing rules (and does not expand them to nuclear or fossil + CCS generator PPAs), but also appears to have several differences to the RED methodology for RFNBOs. For example, carbon capture and utilisation (CCU) in permanently chemically bound products is currently permitted in the draft DA, and there are also more detailed CCS requirements including allowing solid carbon sequestration, but ruling out enhanced oil & gas recovery (European Union, 2024c). Upstream natural gas emissions are to be based on reported producer values under EU methane regulations (European Union, 2024d), but before these are available, a conservative value from the DA is to be used. However, it is unclear how the existing use/fate of fossil fuel feedstocks is to be interpreted, and whether this counterfactual term is to be ignored or would generate a large emissions penalty or a large credit – both latter options would be a major departure from the attributional GHG methodology used in the RED and other EU legislation. Given the current consultation stage, other significant changes to the DA before final publication are possible, which also adds uncertainty.
CertifHy
CertifHy is an industry developed voluntary Guarantee of Origin (GO) certificate scheme within the EU, the European Economic Area and Switzerland. The CertifHy GO scheme verifies the origin (e.g. production location, production technology, feedstocks etc.) and GHG emissions of hydrogen products (CertifHy, n.d.). Rather than a set of legislative requirements, it is a scheme that producers can choose to participate in to demonstrate sustainability to their end-users.
Eligibility
CertifHy hydrogen can be labelled “green hydrogen” which covers renewable pathways, or “low-carbon hydrogen” which covers low-carbon fossil and nuclear pathways. For both, a GHG emissions threshold of 36.4gCO2e/MJ LHV hydrogen applies, which is measured on the same ‘cradle-to-production gate’ system boundary as the UK LCHS. This represents a reduction of 60% compared to the benchmark fossil process of 91gCO2e/MJLHV hydrogen product (via steam reforming of natural gas) (CertifHy, 2022).
GHG calculation methodology principles
When producing hydrogen from the electricity grid, the renewable origin can be established by cancelling of GOs[6]. Unlike the UK LCHS and EU RED, CertifHy does not specify further requirements such as additionality, temporal or geographical correlation.
Under CertifHy, co-products are dealt in different ways and are defined based on the production pathways. For pathways producing steam as a co-product, CertifHy requires its producers and consumers to use the same allocation method. Economic allocation is applied for hydrogen produced from chlor-alkali processes and its co-products. However, the method for allocating emissions to any co-produced oxygen from electrolysis is yet to be adopted (CertifHy, 2023).
Other requirements
The CertifHy GO scheme allows for the decoupling of physical hydrogen supply and its environmental attributes, via a book & claim system.
Uncertainties and future direction
The future use of this voluntary scheme and others such as TÜV SÜD and TÜV Rheinland could be impacted by the potential future alignment with ISO 19870.
France Energy Code L. 811-1
In July 2024, France transposed the definition of renewable hydrogen in alignment with EU RED under L. 811-1 of the Energy Code (République Francaise, 2024). It is a government developed standard and mandatory for accessing subsidy schemes.
Eligibility
As it is a transposition of EU RED, requirements for renewable hydrogen follow EU RED. The Energy Code also specifies the GHG methodology for low-carbon hydrogen, which is based on EU RED rules, but allows electricity from nuclear power generation.
Uncertainties
Recent Government changes in France resulted in a pause in publishing the new hydrogen strategy and subsequent Government funding in the form of a CfD for hydrogen developers producing renewable or low-carbon hydrogen. It is also currently unclear if France permits RCFs to count towards the REDIII renewable energy target (Martin, P., 2023).
United States Inflation Reduction Act 45V Tax Credit
The Inflation Reduction Act (IRA) introduced the Clean Hydrogen Production Tax Credit (PTC) (45V) to promote the production of low-carbon hydrogen in the US. This tax credit can be claimed by producers for every kilogram of eligible hydrogen they produce in the US. The value of the tax credit is determined by a tiered approach based on the GHG emissions intensity of the hydrogen with significant multipliers also available if the production facility meets the labour requirements set out under the tax credit.
Eligibility
Eligibility for 45V is determined by whether the produced hydrogen meets GHG emission thresholds, which is measured on a ‘cradle-to-production gate’ system boundary. The maximum GHG threshold is defined at 4 kgCO2e/kg H2. Hydrogen produced with lower GHG emissions is eligible for higher support, which is determined by a percentage of the maximum credit value[7] as seen in table below.
|
kgCO2e/kg hydrogen |
gCO2e/MJLHV |
% of Production Tax Credit value |
|
>4 |
>33.3 |
0% |
|
2.4 to 4 |
20 to 33.3 |
20% |
|
1.5 to 2.5 |
12.5 to 20 |
25% |
|
0.45 to 1.5 |
3.8 to 12.5 |
33.4% |
|
<0.45 |
<3.8 |
100% |
GHG calculation methodology principles
For electricity input for electrolytic hydrogen, rules to demonstrate renewability are similar to requirements set under EU RED’s DA. Producers must procure PPAs for renewable electricity that demonstrate incrementality (new generation capacity must begin operations within 3 years of hydrogen facility being placed into service, this is similar to the additionality concept in the EU), deliverability (clean power must be sourced from the same region), and temporal correlation (annual matching is until 2028, with hourly matching thereafter).
The reference flow is set at 2MPa at 100% purity, rather than 3MPa and purity of 99.9% under the UK LCHS. Producing hydrogen below/above this reference flow means the GHG intensity is adjusted higher/lower. By contrast, only upwards adjustments are required for the UK LCHS.
Further differences include the allocation approach. In the US, a system expansion (displacement) approach is generally used for co-product allocation, instead of energy allocation as in the UK LHCS. The US method can therefore give significantly negative GHG intensities for hydrogen produced from organic waste based biomethane[8]. Additionally, 45V places a cap on the amount of steam that can claimed as co-product from natural gas reforming to avoid incentivising over-production of steam to lower hydrogen GHG emissions (US DOE, 2024).
Uncertainties and future direction
45V is currently undergoing consultation to seek industry opinion on methods to enable a virtual tracking system for both direct connection and mass balancing for biomethane and fugitive methane. This includes counterfactual assumptions for biomethane feedstocks, treatment of fugitive emissions, and how to track and verify biomethane through virtual systems. It appears likely that 45V will impose “incrementality” (additionality), temporal matching and deliverability requirements for biomethane but details are unknown at present (Ding et al., 2024). More broadly, while the IRA has been signed into law, a change in US administration could create instability regarding the future of this tax credit.
International Partnership for Hydrogen and Fuel Cells in the Economy (IPHE)
IPHE is an international inter-governmental partnership, which aims to develop a set of mutually agreed methodologies and an analytical framework to determine the GHG emissions of hydrogen production. Use of this methodology is voluntary and differs from other standards reviewed as it serves as a framework for determining GHG emissions of hydrogen production only and does not set any eligibility criteria.
Version 3 of IPHE defines GHG methodologies for electrolysis, steam cracking, fossil gas reforming with CCS, fossil (coal) gasification with CCS, biomass biodigestion (anaerobic digestion to biomethane) with CCS, and biomass gasification with CCS. The methodologies for other pathways will be developed in the future. Unlike other standards, IPHE does not provide guidance on any categories (e.g., “renewable” or “low-carbon”), and it does not stipulate any GHG emission intensity threshold. (IPHE, 2023). This is expected to be done by individual countries participating in IPHE, if they wish to do so.
GHG calculation methodology principles
The current IPHE guidance covers a ‘cradle-to-point of use’ system boundary, which includes supply chain steps to transport hydrogen from the producer to the end user, but not the final use of the hydrogen. This goes beyond the UK LCHS system boundary, but not quite as far as EU RED.
Market-based emissions accounting approach such as renewable energy certificates (RECs) can be used to substantiate electrolytic hydrogen production from renewable electricity. There are no requirements on additionality, temporal correlation and geographic correlation criteria.
IPHE provides pathway-specific recommendations for splitting GHG emissions between co-products, following a hierarchy of options (i.e. allocation based on LHV energy content, followed by system expansion, then economic value). However, certain allocation methods are deemed not appropriate for certain pathways (e.g. energy allocation is not recommended for electrolysis and chloralkali pathways.
Key uncertainties and future direction
The latest IPHE Working Paper (Version 3) was released in July 2023. It is unclear if additional versions will be published, or whether future IPHE developments will be incorporated within the ISO 19870 process, since ISO is developing a global standard starting from the IPHE V3 methodology.
ISO 19870
The IPHE methodology V3 was used as the basis of a draft ISO Technical Specification (ISO/TS 19870) published in late 2023 (ISO, 2023). This is now being further developed into an ISO International Standard on the “Methodology for determining the greenhouse gas emissions associated with the production, conditioning and transport of hydrogen to consumption gate”. This standard is due to be published in 2025. This first ISO hydrogen standard (ISO 19870-1) will cover cradle to production gate, but future standards in the series may cover downstream steps including hydrogen conversion and distribution.
Similar to IPHE, ISO 19870-1 will not provide any threshold values or define any hydrogen categories, labels or colours. All pathways are eligible, but detailed guidance will be provided for a number of pathways. Given the focus is purely on GHG emissions, sustainability requirements are not currently set for biomass feedstocks.
GHG calculation methodology principles
Onsite/direct connection to renewable generators are allowed provided no contracts are sold to a third party. Alternatively, power may be purchased from the grid with a contract and energy attribute certificates (e.g. RECs, GOs) provided ISO 14064-1 (part E.2.2) quality criteria are met (ISO, 2018).
No reference flow is set in ISO/TS 19870, with pressure and purity only set by the next user in the supply chain. However, the GHG emissions intensity shall be adjusted upwards to reflect the presence of impurities in the hydrogen product (e.g. water, nitrogen, carbon dioxide, carbon monoxide, methane etc), and their release to atmosphere.
Other requirements
Chain of custody requirements are not specified, but energy sourcing allows grid purchase with Guarantees of Origin (GOs). Production batches can be any length of time chosen by the operator. GHG emissions of capital equipment are to be reported separately.
Uncertainties
ISO 19870-1 is still under development, therefore significant uncertainties exist, particularly around the (multiple) allocation methodologies that will be recommended for each individual pathway, and the level of detail required for evidence. Whilst ISO standards flow into national standards, Governments are not required to adopt or use a national standard. As a result, how countries/regions choose to align their policies with the new ISO standard once published is unclear (International PtX Hub, 2023). This may depend on whether ISO 19870-1 remains broad in simultaneously accommodating different methodology choices (e.g. consequential or attributional allocation) or becomes more prescriptive with a single methodology and more detailed evidence requirements.
TÜV SÜD
TÜV SÜD is an industry developed, voluntary standard which provides a guaranteed proof of origin alongside certification for renewable hydrogen. The present standard is based on European legislation but is in principle applicable worldwide. A certificate for the production of hydrogen from renewable energy sources labelled “GreenHydrogen” can be issued if all requirements are met (TÜV SÜD, 2021).
Eligibility
The GHG emission threshold follows EU RED, though it accepts two system boundaries which are ‘cradle-to-point of use’ (GreenHydrogen+) or ‘cradle-to-production gate’ (GreenHydrogen) if delivered at the plant gate or injected in a transmission grid. TÜV SÜD also requires that during periods when hydrogen production is not certified as “GreenHydrogen”, emissions still remain below 91 gCO₂e/MJLHV. The scheme currently covers four production pathways, all of which are renewable. Biomass feedstocks used for hydrogen production must meet relevant RED sustainability criteria.
GHG calculation methodology principles
Proof of renewable electricity for electrolysis hydrogen production can be provided by purchasing and retiring GOs or comparable certificates (RECs) which follow EU RED rules though it is unclear if this refers to the renewable electricity DA. GreenHydrogen+ imposes further requirements which includes additionality (new power production must have commissioned no later/earlier than 11 months following the hydrogen production facility installation), temporal correlation (every 15 minutes) and geographical correlation. These rules are more stringent than the UK LCHS and EU RED. The approach to allocating emissions between co-products follows EU RED, although where hydrogen is produced as a by-product such as in chlor-alkali electrolysis, it is possible to allocate emissions using energy allocation, economic allocation or system expansion.
Uncertainties and future direction
The future use of this voluntary scheme and others such as CertifHy and TÜV Rheinland could be impacted by the potential future alignment with ISO 19870.
TÜV Rheinland
TÜV Rheinland is an industry developed, voluntary standard similar to TÜV SÜD, but has an expanded scope which covers both “Renewable Hydrogen” and “Low Carbon Hydrogen”. The present standard is based on European legislation but is in principle applicable worldwide (TÜV Rheinland, 2023).
Eligibility
The GHG emission threshold follows EU RED for both hydrogen categories. Though the system boundary is defined by the user (e.g., cradle to production gate or to point of use). “Renewable hydrogen” has two sub-categories, “Green Hydrogen” and “RFNBO (RED II)”. Eligible pathways for both are electrolytic hydrogen produced from renewable (non-biogenic) electricity and water or aqueous solutions (e.g. chlor-alkali electrolysis) but have different renewable power purchasing requirements. For low-carbon hydrogen, all pathways are eligible e.g., steam reforming, electrolysis, pyrolysis etc.
GHG calculation methodology principles
To be certified as “Green Hydrogen”, renewable electricity can be supplied via a direct connection or the electricity grid (with PPA). The renewable electricity is not required to be additional, but if sourcing via the grid, must have temporal matching on an annual basis and located within the same country. “RFNBO (RED II)” certification requires RED II renewable electricity rules are met.
Green Hydrogen Standard (GH2)
The Green Hydrogen Organisation (GH2) is an industry developed voluntary standard (non-profit foundation) based in Switzerland. Green hydrogen projects that meet the requirements will be licensed to use the label “GH2 Green Hydrogen” and will be eligible to generate and trade GH2 certificates of origin (GH2 Standard, 2023).
Eligibility
GH2 only allows electrolytic hydrogen produced from 100% renewable energy supplied via a direct connection or the electricity grid (with PPA). It sets a significantly lower GHG emissions threshold than the UK LCHS, of 8.33 gCO2e/MJ LHV hydrogen product on a ‘cradle-to-production gate’ basis. Hydrogen developers have the option to calculate and report on embodied emissions including construction emissions.
Where biomass is used in electricity generation, hydrogen developers are required to demonstrate a low risk of indirect land use change, including verifying that production of feedstock does not take place on land with high biodiversity, that land with a high amount of carbon has not been converted for feedstock production. Additionally, hydrogen developers are required to address any risks relating to the displacement of crops for food and feed. Adherence to the EU Commission Delegated Regulation 2019/807 (criteria for determining the high ILUC-risk feedstock) or an equivalent national standard will satisfy this requirement.
GHG calculation methodology principles
Under GH2 the same ‘cradle-to-production gate’ system boundary as the UK LCHS is used. Renewable electricity through RECs are allowed but not required to meet additionality, temporal and geographical correlation. Co-product allocation is not specifically mentioned but given GH2 applies the methodology for the electrolysis production pathway as per IPHE, it is assumed that this will also follow IPHE. For electrolysis, the use of system expansion is recommended for co-product allocation between hydrogen and oxygen products as energy allocation is not appropriate for this co-product.
Uncertainties and future direction
The scheme may expand to include nuclear and other forms of energy production with low emissions but the timeframe for this is currently unknown.
Appendix C GHG calculation methodology
EU RED
Biofuel: E = eec + el + ep + etd + eu – esca – eccs – eccr
Where,
|
E |
= |
total emissions from the use of the fuel; |
|
eec |
= |
emissions from the extraction or cultivation of raw materials; |
|
el |
= |
annualised emissions from carbon stock changes caused by land-use change; |
|
ep |
= |
emissions from processing; |
|
etd |
= |
emissions from transport and distribution; |
|
eu |
= |
emissions from the fuel in use; |
|
esca |
= |
emission savings from soil carbon accumulation via improved agricultural management; |
|
eccs |
= |
emission savings from CO2 capture and geological storage; and |
|
eccr |
= |
emission savings from CO2 capture and replacement. |
RFNBO and RCF: E = ei + ep + etd + eu – eccs
Where,
|
E |
= |
total emissions from the use of the fuel; |
|
ei |
= |
emissions from supply of inputs = ei elastic + ei rigid – e ex-use; |
|
ei elastic |
= |
emissions from elastic inputs; |
|
ei rigid |
= |
emissions from rigid inputs; |
|
e ex-use |
= |
emissions from inputs’ existing use or fate; |
|
ep |
= |
emissions from processing; |
|
etd |
= |
emissions from transport and distribution; |
|
eu |
= |
emissions from the fuel in use; |
|
eccs |
= |
emission savings from CO2 capture and geological storage |
EU Gas Directive
E = ei + ep + etd + eu – eccs – eccu
Where,
|
E |
= |
total emissions from the use of the fuel; |
|
ei |
= |
emissions from supply of inputs = ei elastic + ei rigid – e ex-use; |
|
ei elastic |
= |
emissions from elastic inputs; |
|
ei rigid |
= |
emissions from rigid inputs; |
|
e ex-use |
= |
emissions from inputs’ existing use or fate; |
|
ep |
= |
emissions from processing (including captured carbon); |
|
etd |
= |
emissions from transport and distribution; |
|
eu |
= |
emissions from the fuel in use; |
|
eccs |
= |
net emission savings from CO2 capture and geological storage; |
|
eccu |
= |
net emission savings from CO2 captured and permanently chemically bound in long-lasting products. |
ISO/TS 19870
E = ecombustion emissions + efugitive emissions + eindustrial process emissions + eenergy supply emissions + eupstream emissions
Where,
|
ecombustion emissions |
= |
combustion of relevant solid, liquid and/or gaseous fuels |
|
efugitive emissions |
= |
leakages and accidental losses, as well as other losses due to incorrect management of plant operations |
|
eindustrial process emissions |
= |
specific GHG gases used across a number of industry activities (e.g., hydrofluorocarbons (HFCs) used in industrial refrigeration and/or cooling systems, and sulphur hexafluoride (SF6) used in electrical switchgear). |
|
eenergy supply emissions |
= |
emissions associated with the supply of energy |
|
eupstream emissions |
= |
emissions relating to the upstream extraction of resources |
Appendix D Hydrogen pathways modelled
|
Hydrogen production pathway |
Hydrogen production country |
Distribution pathway to Rotterdam |
End product |
|---|---|---|---|
|
Electrolysis using renewable electricity |
Scotland, Norway, Morocco, Chile, USA |
Ammonia shipping with reconversion to hydrogen |
Hydrogen |
|
Electrolysis using renewable electricity |
Scotland, Norway, Morocco, Chile, USA |
Ammonia shipping |
Ammonia |
|
Electrolysis using renewable electricity |
Scotland, Norway, Morocco |
Compressed hydrogen shipping |
Hydrogen |
|
Electrolysis using renewable electricity |
Scotland, Norway, Morocco |
Compressed hydrogen pipeline |
Hydrogen |
|
Electrolysis using nuclear electricity |
France |
Ammonia shipping with reconversion to hydrogen |
Hydrogen |
|
Electrolysis using nuclear electricity |
France |
Ammonia shipping |
Ammonia |
|
Electrolysis using nuclear electricity |
France |
Compressed hydrogen shipping |
Hydrogen |
|
Electrolysis using nuclear electricity |
France |
Compressed hydrogen pipeline |
Hydrogen |
|
Electrolysis using grid electricity |
Scotland, Norway, France, Morocco, Chile, USA |
Ammonia shipping with reconversion to hydrogen |
Hydrogen |
|
Electrolysis using grid electricity |
Scotland, Norway, France, Morocco, Chile, USA |
Ammonia shipping |
Ammonia |
|
Electrolysis using grid electricity |
Scotland, Norway, France, Morocco |
Compressed hydrogen shipping |
Hydrogen |
|
Electrolysis using grid electricity |
Scotland, Norway, France, Morocco |
Compressed hydrogen pipeline |
Hydrogen |
|
Natural gas ATR+CCS |
UK, USA |
Ammonia shipping with reconversion to hydrogen |
Hydrogen |
|
Natural gas ATR+CCS |
UK, USA |
Ammonia shipping |
Ammonia |
|
Natural gas ATR+CCS |
UK |
Compressed hydrogen shipping |
Hydrogen |
|
Natural gas ATR+CCS |
UK |
Compressed hydrogen pipeline |
Hydrogen |
*In the case of France, electrolytic hydrogen production was modelled using electricity from nuclear sources instead of renewable sources
Appendix E Modelling assumptions
|
Location |
Assumption |
2023 |
2030 |
References | |
|---|---|---|---|---|---|
|
Hydrogen production location |
USA |
The Northeast region of the US was used in the 2023 CXC report but no specific location was stated. To align with the CXC report and based on likely shipping ports, New Jersey has been assumed for the production location (and electricity grid factor), and Port Newark for the export location. |
– |
– | |
|
Shipping distances/days |
All |
The shipping distances from Scotland, Norway, Morocco and Chile to Rotterdam, were taken from the 2023 CXC report. A shipping distance for the US was not given, so has been calculated from Port Newark to Rotterdam. The shipping time (days) has been calculated based on a ship speed of 29.6 km/hr (JRC, 2024) and calculated using Sea-Distances, 2024. The shipping distance for France was 38.2 km in the CXC report – assumed this is a typo given the shortest shipping distance between France and Rotterdam is from Port of Dunkirk (261 km). |
Scotland: 930 km / 1.3 days Norway: 1,312 km / 1.8 days France (Port of Dunkirk): 261 km / 0.4 days Morocco: 2,747 km / 3.9 days USA (Port Newark): 6,265 km / 14 days Chile: 17,970 km / 25.3 days |
Scotland: 930 km / 1.3 days Norway: 1,312 km / 1.8 days France (Port of Dunkirk): 261 km / 0.4 days Morocco: 2,747 km / 3.9 days USA (Port Newark): 6,265 km / 14 days Chile: 17,970 km / 25.3 days |
CXC, 2023, pg41 |
|
Pipeline distances |
All except USA & Chile |
The pipeline distances from Scotland, Norway, France and Morocco to Rotterdam, were taken from the 2023 CXC report. |
Scotland: 930 km Norway: 1,312 km France: 435 km Morocco: 1,930 km |
Scotland: 930 km Norway: 1,312 km France: 435 km Morocco: 1,930 km |
CXC, 2023, pg41 |
|
Electricity grid GHG intensity |
Scotland |
Average annual grid generation intensity recorded for 2023 taken as current value (45.9 gCO2/kWh) (National Grid ESO, 2024). gCO2/kWh value increased by 1% to derive gCO2e/kWh value based on the difference between gCO2 and gCO2e intensities reported in UK Gov Conversion Factors, 2024. Given EU RED and ISO/TS 19870 requirements, upstream emissions were added for Scottish generators, calculated (as 3.61 gCO2e/MJ elec currently) using the electricity generation mix from DESNZ, 2023 and applying the fuel emission factors in Table 3 of the RED Delegated Act on GHG methodology for RCFs and RFNBOs. Imports of electricity into Scotland were ignored in the upstream calculations. Scottish electricity grid in 2030 is estimated to reach 120 TWh/yr generation and emit 1025 ktCO2e/yr (Scottish Government, 2024). Upstream emissions were estimated for 2030 by applying the same ratio as the generation emissions for 2023 compared to 2030. |
16.5 gCO2e/MJ elec |
3.0 gCO2e/MJ elec |
National Grid ESO, 2024, Country Carbon Intensity Forecast UK Gov, 2024, Greenhouse gas reporting: conversion factors 2024 DESNZ, 2023, Energy Trends https://www.gov.scot/policies/renewable-and-low-carbon-energy Scottish Government, 2024, Greenhouse gas emissions projections |
|
Electricity grid GHG intensity |
Norway |
2023 grid mix taken from Ember (Ember, 2024). Generation and upstream emissions were calculated using the fuel combustion and upstream emission factors in Table 1 and Table 3 of the RED Delegated Act on GHG methodology for RCFs and RFNBOs and generator efficiencies from JRC (2020). Norway renewables capacity is expected to increase by 40 TWh in Norway in 2030 (DLA Piper, 2023). |
2.46 gCO2e/MJ elec |
1.95 gCO2e/MJ elec |
European Commission, 2023, Delegated Act 2023/1185. |
|
Electricity grid GHG intensity |
France |
2023 grid mix taken from Ember (Ember, 2024). Generation and upstream emissions were calculated using the fuel combustion and upstream emission factors in Table 1 and Table 3 of the RED Delegated Act on GHG methodology for RCFs and RFNBOs and generator efficiencies from JRC (2020). France aims for 34% renewable electricity in 2030 compared to currently 24.7% (IEA, 2024). |
17.3 gCO2e/MJ elec |
15.7 gCO2e/MJ elec |
European Commission, 2023, Delegated Act 2023/1185. |
|
Electricity grid GHG intensity |
Morocco |
2023 grid mix taken from Ember (Ember, 2024). Generation and upstream emissions were calculated using the fuel combustion and upstream emission factors in Table 1 and Table 3 of the RED Delegated Act on GHG methodology for RCFs and RFNBOs and generator efficiencies from JRC (2020). Current renewables capacity is ~38%, aiming to increase to 52% by 2030 (International Trade Administration, 2024). This anticipated percentage increase in renewables capacity was used to estimate the grid emission factor for 2030. |
188.4 gCO2e/MJ elec |
162.1 gCO2e/MJ elec |
European Commission, 2023, Delegated Act 2023/1185. |
|
Electricity grid GHG intensity |
USA (New Jersey) |
Latest year grid mix for the RFC East subregion in which New Jersey is in (EPA, 2022). Generation and upstream emissions were calculated using the fuel combustion and upstream emission factors in Table 1 and Table 3 of the RED Delegated Act on GHG methodology for RCFs and RFNBOs and generator efficiencies from JRC (2020). New Jersey is targeting 50% reduction in electricity generation emissions by 2030 compared to 2005 (climate-Xchange.org, 2024, NJ DEP, 2024). This emissions reduction was applied to the 2023 generation emissions to calculate the 2030 generation emissions. To estimate the 2030 upstream emissions, the 2023 upstream to generation emissions ratio was applied. |
68.2 gCO2e/MJ elec |
34.1 gCO2e/MJ elec |
European Commission, 2023, Delegated Act 2023/1185. JRC, 2020, JEC-Well-to-Tank report v5 climate-Xchange.org, 2024, New Jersey NJ DEP, 2024, NJ Greenhouse Gas Emissions Inventory Report Years 1990-2021 |
|
Electricity grid GHG intensity |
Chile |
2023 grid mix taken from Ember (Ember, 2024). Generation and upstream emissions were calculated using the fuel combustion and upstream emission factors in Table 1 and Table 3 of the RED Delegated Act on GHG methodology for RCFs and RFNBOs and generator efficiencies from JRC (2020). By 2030, Chile aims to reduce emissions by 84% compared to 2021 (Wartsila, 2022) – 2021 grid mix used to estimate 2030 grid emission factor (Ember, 2024). |
72.7 gCO2e/MJ elec |
19.1 gCO2e/MJ elec |
European Commission, 2023, Delegated Act 2023/1185. |
|
Electricity grid GHG intensity |
UK |
2023 factor calculated based on the GB generation intensity data from National Grid ESO (2024). Given EU RED and ISO/TS 19870 requirements, upstream emissions were added, calculated using the GB electricity generation mix (DESNZ, 2023) and applying the fuel upstream emission factors from UK Gov (2024), and generator efficiencies from JRC (2020). Upstream emissions of imported electricity were calculated using the same approach, using country electricity grid generation mixes (IEA, 2023) for France, Belgium, Netherlands and Norway, weighted by the proportion of imported electricity from UK Gov Energy Trends (2024). 2030 generation factor calculated based National Grid Future Energy Scenarios (FES) following the Holistic Transition scenario. The upstream emissions factors from GB generation were calculated using the 2030 GB electricity generation mix (National Grid ESO, 2024). Transmission and distribution losses (7.5%) were included for all upstream emissions calculations (National Grid ESO, 2024), to give consistent gCO2e/kWh delivered values. For simplicity, GB factors taken for UK. |
53.8 gCO2e/MJ elec delivered (11.4 upstream + 42.4 generation) |
16.7 gCO2e/MJ elec delivered (5.0 upstream + 11.6 generation) |
National grid ESO, 2024, ESO’s Carbon Intensity Dashboard. European Commission, 2023, Delegated Act 2023/1185. UK Gov, 2024, Greenhouse gas reporting: conversion factors 2024 UK Gov, 2024, Energy Trends: UK electricity IEA, 2023, Energy Statistics Data Browser JRC, 2020, JEC-Well-to-Tank report v5 National Grid ESO, 2024, Future Energy Scenarios: Pathways to Net Zero. |
|
Electricity grid GHG intensity |
Netherlands |
2023 grid mix taken from Ember (Ember, 2024). Generation and upstream emissions were calculated using the fuel combustion and upstream emission factors in Table 1 and Table 3 of the RED Delegated Act on GHG methodology for RCFs and RFNBOs and generator efficiencies from JRC (2020). The 2030 Netherlands grid mix is taken from the JRC and upstream and combustion emission factors from the RED were applied to estimate the 2030 grid emission factor (JRC, 2024). |
81.2 gCO2e/MJ elec |
31.6 gCO2e/MJ elec | |
|
Renewable electricity GHG intensity |
All |
Generation and upstream emissions for wind, hydro and solar electricity are considered as zero, as per EU RED and ISO/TS 19870. |
0 gCO2e/MJ elec |
0 gCO2e/MJ elec | |
|
Nuclear electricity GHG intensity |
France |
Emission factor for nuclear fuel is taken from Table 3 from RED Delegated Act on GHG methodology for RCFs and RFNBOs (1.2 gCO2e/MJ LHV fuel) (European Commission, 2023). Nuclear power plant LHV efficiency of 33% then applied (JRC, 2020). |
3.64 gCO2e/MJ elec |
3.64 gCO2e/MJ elec |
European Commission, 2023, Delegated Act 2023/1185. JRC, 2020, JEC WTT v5 – NUEL chain (Pathways 6 Electricity workbook) |
|
Natural gas grid GHG intensity |
Netherlands, UK & USA (following EU RED DA methodology) |
Natural gas supply and combustion emissions are taken from RED Delegated Act on GHG methodology for RCFs and RFNBOs (European Commission, 2023), given the factors in the Delegated Act do not distinguish between different countries (including those outside of the EU). In the absence of 2030 intensity projections by country, assumed the same GHG intensity for 2030. |
Upstream: 12.7 gCO2e/MJ LHV Combustion: 56.2 gCO2e/MJ LHV |
Upstream: 12.7 gCO2e/MJ LHV Combustion: 56.2 gCO2e/MJ LHV | |
|
Natural gas grid GHG intensity |
Netherlands (following ISO/TS 19870 methodology) |
Natural gas supply and combustion emissions are taken from RED Delegated Act on GHG methodology for RCFs and RFNBOs (European Commission, 2023). In the absence of 2030 intensity projections by country, assumed the same GHG intensity for 2030. |
Upstream: 12.7 gCO2e/MJ LHV Combustion: 56.2 gCO2e/MJ LHV |
Upstream: 12.7 gCO2e/MJ LHV Combustion: 56.2 gCO2e/MJ LHV | |
|
Natural gas grid GHG intensity |
UK (following ISO/TS 19870 methodology) |
Upstream natural gas emissions taken from the UK Low Carbon Hydrogen Standard V3 (DESNZ, 2023). In the absence of 2030 intensity projections by country, assumed the same GHG intensity for 2030. |
Upstream: 8.7 gCO2e/MJ LHV Combustion: 56.2 gCO2e/MJ LHV |
Upstream: 8.7 gCO2e/MJ LHV Combustion: 56.2 gCO2e/MJ LHV | |
|
Natural gas grid GHG intensity |
USA (following ISO/TS 19870 methodology) |
Upstream natural gas CO2 emissions taken from GREET (16.52 gCO2/kWh natural gas). The methane leakage rate (7.5 gCH4/kg natural gas) is based on the Pennsylvania region in Sherwin et al. (2024) given this is the closest region to New Jersey. The natural gas LHV applied to convert units is from UK Gov Conversion Factors (2024). Combustion emissions were based on RED Delegated Act on GHG methodology for RCFs and RFNBOs. In the absence of 2030 intensity projections by country, assumed the same GHG intensity for 2030. |
Upstream: 9.2 gCO2e/MJ LHV Combustion: 56.2 gCO2e/MJ LHV |
Upstream: 9.2 gCO2e/MJ LHV Combustion: 56.2 gCO2e/MJ LHV |
R&D GREET, 2023, NA NG from Shale and Conventional Recovery UK Gov, 2024, Greenhouse gas reporting: conversion factors 2024 |
|
Electrolyser inputs |
All |
Assume PEM electrolyser with current LHV efficiency 61% and output pressure at 30 bar (CXC, 2022 – aligns with DESNZ, 2023; IEA, 2019; Element Energy, 2019). 2030 value assumed to reach 66% efficiency (CXC, 2022) – this aligns with other sources (IEA, 2019). CXC assume 25 kg H2O/kg H2 in water consumption for current year (CXC, 2023) and assumed remains constant to 2030. Chemical inputs (hydrochloric acid and sodium hydroxide) required to deionise water are based on industry data. The emissions associated with these chemical inputs are very small. |
Electrolyser efficiency: 61% Water consumption: 25 kg H2O/kg H2 Chemical inputs: 1.8 x10⁻⁶ kg NaOH/MJ H2 1.6 x10⁻⁶ kg HCl/MJ H2 |
Electrolyser efficiency: 66% Water consumption: 25 kg H2O/kg H2 Chemical inputs: 1.8 x10⁻⁶ kg NaOH/MJ H2 1.6 x10⁻⁶ kg HCl/MJ H2 |
IEA, 2019, The Future of Hydrogen Element Energy, 2018, Hydrogen supply chain evidence base prepared for BEIS |
|
ATR + CCS inputs |
UK, USA |
ATR+CCS plant LHV efficiency from Environment Agency (2023) and electricity input and water consumption from the same reference. These values align with other sources (Element Energy, 2018). Included grid electricity for ATR+CCS operations (JRC, 2020). Hydrogen output from ATR assumed to be at 20 bar (Element Energy, 2018) – hence included electricity for additional hydrogen compression to 30 bar (DESNZ, 2023). Emissions of fugitive methane and N2O, and consumption of MEA catalyst are from industry data. CO2 capture rate of 95% (Environmental Agency, 2023; Element Energy, 2018). All inputs assume to remain constant to 2030. Assume same inputs for US and UK. |
LHV efficiency: 80.6% ATR electricity: 8.8 MJ elec/kg H2 Electricity for nat gas compression: 0.0059 MJ elec/MJLHV nat gas Additional electricity for hydrogen compression: 0.0068 MJ elec/MJLHV H2 Water consumption: 3.8 kg H2O/kg H2 Catalyst consumption: 0.000081 kg MEA/MJLHV H2 CO2 capture rate: 95% Fugitive emissions: 0.00071 gCH4/MJLHV H2 0.0028 gN2O/MJLHV H2 |
LHV efficiency: 80.6% ATR electricity: 8.8 MJ elec/kg H2 Electricity for nat gas compression: 0.0059 MJ elec/MJLHV nat gas Additional electricity for hydrogen compression: 0.0068 MJ elec/MJLHV H2 Water consumption: 3.8 kg H2O/kg H2 Catalyst consumption: 0.000081 kg MEA/MJLHV H2 CO2 capture rate: 95% Fugitive emissions: 0.00071 gCH4/MJLHV H2 0.0028 gN2O/MJLHV H2 |
JRC, 2020, JEC-Well-to-Tank report v5 Element Energy, 2018, Hydrogen supply chain evidence base prepared for BEIS |
|
Hydrogen compression before pipeline transport |
Scotland, Morocco, Norway, France, UK |
Hydrogen assumed to be produced at 30 bar. Compression required to reach 100 bar for injecting in transmission pipeline network (Element Energy, 2018). Electricity required for compressing hydrogen from 30 bar to 100 bar calculated using formula in DESNZ, 2023. |
0.78 kWh/kg H2 |
0.78 kWh/kg H2 |
Element Energy, 2018, Hydrogen supply chain evidence base prepared for BEIS |
|
Pipeline transport |
Scotland, Morocco, Norway, France, UK |
Offshore subsea pipelines assumed for Scotland, and Norway; onshore pipelines will be used for France; and both onshore and offshore pipelines will be used for Morocco. Pipelines have been excluded for Chile and the USA due to the distances required. Dedicated pipeline compressor ratings in the CXC report were used and pipeline throughput from European Hydrogen Backbone report for 36-inch pipeline at 75% capacity. Assume losses in pipeline transport of 1% (JRC, 2024). |
Scotland: 36 MWe/1000 km Norway: 60 MWe/1000 km France: 45 MWe/1000 km Morocco: 40 MWe/1000 km Pipeline losses: 1% 36-inch pipeline throughput at 75% capacity: 3600 MWLHV H2 |
Scotland: 36 MWe/1000 km Norway: 60 MWe/1000 km France: 45 MWe/1000 km Morocco: 40 MWe/1000 km Pipeline losses: 1% 36-inch pipeline throughput at 75% capacity: 3600 MWLHV H2 | |
|
Hydrogen compression before trucking |
All (expect USA and Chile) |
Hydrogen assumed to be produced at 30 bar. Compression required to reach 500 bar (JRC, 2020) for trucking of hydrogen and storage of hydrogen (Element Energy, 2018) at either side of the shipping port. Electricity required for compressing hydrogen from 30 bar to 500 bar calculated using formula in DESNZ, 2023. |
2.34 kWh/kg H2 |
2.34 kWh/kg H2 |
JRC, 2020, JEC-Well-to-Tank report v5 Element Energy, 2018, Hydrogen supply chain evidence base prepared for BEIS |
|
Compressed hydrogen trucking |
All (expect USA and Chile) |
Hydrogen trucked at 500 bar, from hydrogen plant to port. Trucks are assumed to use diesel with biofuel blend in the current year based on UK Gov conversion factors (2024). By 2030, assume trucks use a 12% biofuel blend (LHV basis) in 2030 based on DfT targets (2021), and for simplicity, this applies to all regions. For all pathways, assume a trucking distance of 50 km between hydrogen production site and port (JRC, 2020). Standard truck fuel use was taken from JEC (2020) and an adjustment factor was applied to account for trucking hydrogen. The leakage rate for compressed hydrogen trucking is assumed to be the same as for storage (Frazer-Nash, 2022) therefore assumed 0.24% leakage per day during trucking. |
Distance: 50 km Payload: 0.955 tonne H2 payload Capacity: 28 tonne tank mass Losses: 0.24%/day Fuel use: 0.81 MJ diesel/tonne.km |
Distance: 50 km Payload: 0.955 tonne H2 payload Capacity: 28 tonne tank mass Losses: 0.24%/day Fuel use: 0.81 MJ diesel/tonne.km |
UK Gov, 2024, Greenhouse gas reporting: conversion factors 2024 JRC, 2020, JEC-Well-to-Tank report v5 Frazer-Nash Consulting, 2022, Fugitive Hydrogen Emissions in a Future Hydrogen Economy |
|
Compressed hydrogen storage |
All (expect USA and Chile) |
Hydrogen stored in gaseous form at 500 bar. The leakage rate ranges from 0.12% – 0.24% per day depending on the storage pressure, cylinder and valve material, and the size of the cylinder. Assume a smaller cylinder is required due to hydrogen being stored at high pressure therefore expect the leakage rate to be at the top end of this range (0.24%). Average duration of compressed hydrogen delivery is 2 – 30 days (Frazer-Nash, 2022). Here assume 20 days storage. |
Losses: 0.24%/day Storage time: 20 days |
Losses: 0.24%/day Storage time: 20 days |
Frazer-Nash Consulting, 2022, Fugitive Hydrogen Emissions in a Future Hydrogen Economy |
|
Hydrogen decompression |
All (expect USA and Chile) |
Assumed no heat required for decompression of gaseous hydrogen from high pressure. |
– |
– | |
|
Compressed hydrogen shipping |
All (expect USA and Chile) |
Hydrogen shipped at 250 bar on ship with capacity (1370 t H2) and fuel usage (534 kt diesel/Mt H2) taken from JRC (2024). Fuel usage converted to MJ diesel/km assuming 29.1 ships deliver 1 Mt H2/yr over distance of 2,500 km (JRC, 2024). Assumed current shipping runs on fossil marine diesel oil (not biodiesel as in JRC source), and by 2030, 25% of hydrogen carrying vessels are assumed to be running on external sources of zero carbon hydrogen (so effectively 25% lower fossil marine diesel oil use by 2030). Ship speed (29.6 km/hr) taken from JRC (2024). The leakage rate for compressed hydrogen shipping is assumed to be the same as for storage (Frazer-Nash, 2022) therefore assumed 0.24% leakage per day during shipping. Return ship journeys always assumed to be empty (IEA, 2019). |
Ships: 100% fossil marine diesel oil Fuel usage: 437 MJ diesel/km |
Ships: 75% fossil marine diesel oil, 25% zero carbon hydrogen Fuel usage: 328 MJ diesel/km | |
|
Capacity: 1370 tonne H2 Vessel speed: 29.6 km/hr Losses: 0.24%/day |
Capacity: 1370 tonne H2 Vessel speed: 29.6 km/hr Losses: 0.24%/day |
Frazer-Nash Consulting, 2022, Fugitive Hydrogen Emissions in a Future Hydrogen Economy | |||
|
Ammonia production |
All |
Data for ammonia production taken from JRC, 2024. Includes inputs of electricity, iron-based catalyst, and water consumption (150 L/kg ammonia used for cooling where 9% is consumed and the rest is recycled in the process; 1.9 L/kg ammonia used for water deionisation). Also, ammonia emissions and nitrous oxide emissions are included. |
Electricity requirement: 0.81 kWh/kg NH3 Catalyst: 0.055 g catalyst/kg NH3 Water consumption: 15.4 L H2O/kg NH3 Fugitive emissions: 1.63 gNH3/kgNH3 1.0 gN2O/kgNH3 |
Electricity requirement: 0.81 kWh/kg NH3 Catalyst: 0.055 g catalyst/kg NH3 Water consumption: 15.4 L H2O/kg NH3 Fugitive emissions: 1.63 gNH3/kgNH3 1.0 gN2O/kgNH3 | |
|
Ammonia trucking |
All |
Trucks are assumed to use diesel with biofuel blend in the current year based on UK Gov conversion factors (2024). By 2030, assume trucks use a 12% biofuel blend (energy basis) in 2030 based on UK targets (DfT, 2021). No boil-off assumed (IEA, 2020). For all pathways a trucking distance of 50 km has been assumed from ammonia plant to port (JRC, 2020). Standard truck fuel use taken from JEC (2020) and an adjustment factor was applied to account for trucking ammonia, with the truck payload calculated based on an equivalent 2.6 tonne H2 capacity per ammonia truck (IEA, 2020) converted to 14.7 tonnes of ammonia using molar masses (JRC, 2020). |
Distance: 50 km Payload: 14.7 tonne NH3 payload Capacity: 28 tonne tank mass Losses: 0%/day Fuel use: 0.81 MJ diesel/tonne.km |
Distance: 50 km Payload: 14.7 tonne NH3 payload Capacity: 28 tonne tank mass Losses: 0%/day Fuel use: 0.81 MJ diesel/tonne.km |
UK Gov, 2024, Greenhouse gas reporting: conversion factors 2024 |
|
Ammonia storage |
All |
0.005 kWh/kg ammonia electricity required for storage at export terminal and 0.02 kWh/kg ammonia required for storage at import terminal. Assume 0%/day boil-off rate and 20 days storage time (IEA, 2020). |
Electricity for export terminal: 0.005 kWh/kg NH3 Electricity for import terminal: 0.02 kWh/kg NH3 Losses: 0%/day Storage time: 20 days |
Electricity for export terminal: 0.005 kWh/kg NH3 Electricity for import terminal: 0.02 kWh/kg NH3 Losses: 0%/day Storage time: 20 days | |
|
Ammonia shipping |
All |
Ammonia ship capacity and fuel use are calculated using the JRC, 2024 report. The ship capacity is based on compressed hydrogen ship capacity, applying the ratio of ships required to deliver 1 Mt H2/yr using compressed hydrogen (29.1 ships) compared to ammonia (4.5 ships). Fuel usage (57 kt diesel/Mt H2) assumed over shipping distance of 2,500 km. Assumed current shipping runs on fossil marine diesel oil, and by 2030, 25% of ammonia carrying vessels are assumed to be running on external sources of zero carbon ammonia (so effectively 25% lower fossil marine diesel oil use by 2030). Boil off rate assumed to be 0.02%/day (JRC, 2024). Ship speed (29.6 km/hr) taken from JRC, 2024. Return ship journeys always assumed to be empty (IEA, 2019). |
Fuel use: 100% fossil marine diesel oil, 302 MJ diesel/km Capacity: 8,859 tonne NH3 Vessel speed: 29.6 km/hr Losses: 0.02%/day |
Fuel use: 75% fossil marine diesel oil, 25% zero carbon ammonia, so 226.5 MJ diesel/km Capacity: 8,859 tonne NH3 Vessel speed: 29.6 km/hr Losses: 0.02%/day | |
|
Ammonia cracking |
All |
Data for ammonia cracking is based on JRC, 2024. Assume part of ammonia delivered to the cracker is used for heating (1.63 kg ammonia/kg H2), in addition to 5.67 kg ammonia/kg H2 feedstock use, used to calculate LHV efficiency of this step, given ammonia LHV = 18.6 MJ/kg. Hydrogen produced from ammonia cracking is assumed to be at 99.97% purity and 240 bar. No additional electricity required to compress hydrogen further for downstream usage. |
Ammonia input: 7.3 kg ammonia/kg H2 Electricity: 4.86 kWh/kg H2 Nickel-based catalyst: 1.46 g catalyst/kg H2 Zeolite powder: 0.88 g zeolite/kg H2 Fugitive emissions: Ammonia: 7.05 mg/kg H2 N2O: 4.89 mg N2O/kg H2 |
Ammonia input: 7.3 kg ammonia/kg H2 Electricity: 4.86 kWh/kg H2 Nickel-based catalyst: 1.46 g catalyst/kg H2 Zeolite powder: 0.88 g zeolite/kg H2 Fugitive emissions: Ammonia: 7.05 mg/kg H2 N2O: 4.89 mg N2O/kg H2 | |
|
Piping of hydrogen to hydrogen user |
Netherlands |
Transport of hydrogen via pipeline from port storage to the refinery was assumed to be 50 km. Hydrogen transferred from storage to pipeline assumed to be at sufficient pressure, so no additional compression electricity required (Element Energy, 2018). Pipeline compressor rating and throughput from European Hydrogen Backbone report for 36-inch pipeline at 75% capacity (similar to country specific ratings in the CXC 2023 report). Assume some losses in pipeline transport (JRC, 2024) with fugitive losses 1% |
Pipeline distance: 50 km Pipeline losses: 1% |
Pipeline distance: 50 km Pipeline losses: 1% |
Element Energy, 2018, Hydrogen supply chain evidence base prepared for BEIS |
|
Hydrogen user |
Netherlands |
In Rotterdam, there is a large focus on using hydrogen in industry, including petrochemical terminals and refineries. To align with a hydrogen application in Rotterdam, usage of gaseous hydrogen in a refinery was selected as the downstream application. For hydrogen use in a refinery boiler, N2O emissions have been included (0.272 mgN2O/kWh) (Scottish Government, 2023) with hydrogen losses of 0.5% (JRC, 2024). The input hydrogen pressure was assumed to be 10 bar (HyNet, 2022). |
N2O emissions: 0.272 mgN2O/kWh H2 Hydrogen losses: 0.5% |
N2O emissions: 0.272 mgN2O/kWh H2 Hydrogen losses: 0.5% |
Rotterdam Maritime Capital, Europe’s Hydrogen Hub Scottish Government, 2023, Nitrous Oxide emissions associated with 100% hydrogen boilers: research |
|
Ammonia user |
Netherlands |
Main uses of ammonia are in fertilisers, with shipping proposed as a major future market. Given the significance of the maritime sector in Rotterdam, usage of ammonia in shipping was selected as the downstream application. No further transport of ammonia before the final user Accounted for nitrous oxide emissions (0.061 gN2O/kWh) releasing during shipping (Maersk Mc-Kinney Moller Center, 2023). |
N2O emissions: 0.061 gN2O/kWh NH3 |
N2O emissions: 0.061 gN2O/kWh NH3 |
Rotterdam Maritime Capital, Europe’s Hydrogen Hub Maersk Mc-Kinney Moller Center, 2023, Managing Emissions from Ammonia-Fueled Vessels |
Appendix F Sensitivity Analysis
Sensitivity 1: All renewable electricity
The baseline results shown in Section 3.2 assume grid electricity in the relevant country is used whenever electricity is consumed in any of the steps downstream of hydrogen production, and that grid electricity is also used during hydrogen production via natural gas ATR+CCS.
This sensitivity tests the impact of using renewable electricity for all steps of the value chain, including hydrogen distribution (e.g. compression, ammonia production, cracking, storage etc) as well as for hydrogen production via ATRCCS. However, no change was made to the electrolysis input electricity source, and this sensitivity was not applied to grid electrolysis pathways as these pathways are unlikely to adopt fully renewable electricity for downstream steps outside of their control when the electrolysis is using grid average electricity.
Results in Figure 8 and Figure 9 below show that all renewable electrolysis pathways could fall even further below the GHG emission threshold in 2023 and 2030 when this sensitivity is applied. Compared to the baseline renewable electrolysis pathways (without the sensitivity applied), the emission intensity reduces by up to 46 gCO2e/MJLHV when utilising renewable electricity – this largest reduction is achieved for renewable electrolytic hydrogen produced in Morocco and transported as ammonia.
After application of this sensitivity, the main remaining emissions for the renewable electrolysis pathways will be the release of nitrous oxide in ammonia pathways, and the shipping fuels used for transporting ammonia or compressed hydrogen. The difference between 2023 and 2030 results is due to the decarbonisation of trucks and ships using cleaner fuels.
All renewable ammonia pathways are also expected to meet the EU GHG threshold. However, these pathways will still have significantly higher emissions compared to the gaseous hydrogen shipping pathways due to efficiency losses in the (re-)conversion steps and release of nitrous oxide.
Compared to the baseline, hydrogen produced in the UK or USA via natural gas pathways and transported as ammonia still exceeds the EU GHG threshold due to the upstream emissions and emissions associated with ammonia (re-)conversion. However, the emissions from producing hydrogen in the UK via natural gas ATR+CCS and transported via compressed shipping or pipeline could just meet the GHG threshold in 2023. The UK could therefore have an emissions advantage over the USA if comparing natural gas reforming pathways.
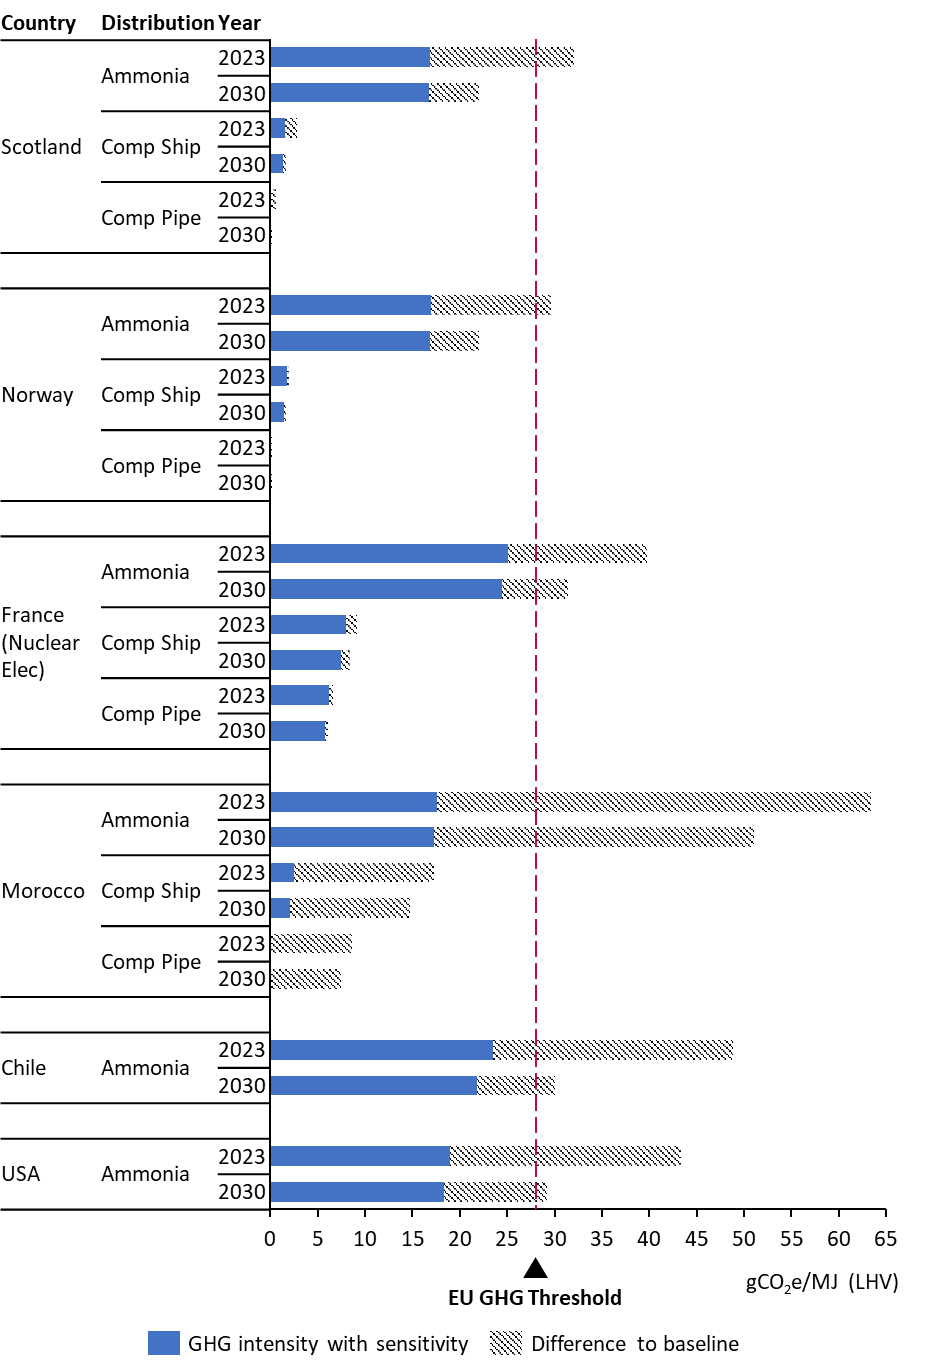
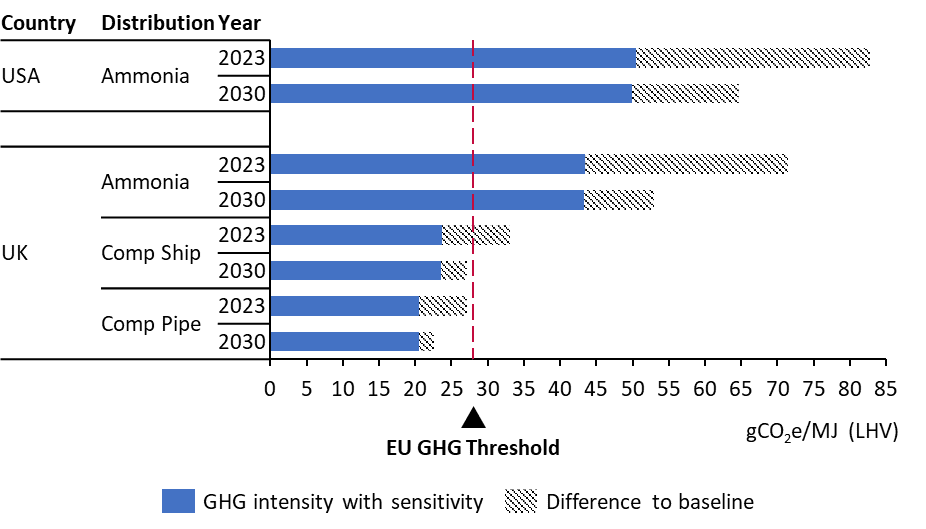
Sensitivity 2: GB vs Scotland grid electricity
In the baseline, Scottish grid electricity GHG intensities are modelled for Scottish production, although under EU RED or the EU Gas Directive, the European Commission are yet to confirm whether the Scottish or GB (or even average UK) grid intensity should be used. The GB grid electricity GHG intensity is significantly higher than that of Scotland’s due to the GB grid electricity mix consisting of a higher contribution from natural gas (~40% compared to ~10% in Scotland’s grid mix) and a lower contribution from renewable sources (~40% compared to ~70% in Scotland’s grid). Scotland is expected to have a much lower grid GHG intensity compared to GB until full decarbonisation of the GB grid is achieved. The UK Government have set a target to decarbonise the electricity grid by 2030 but for modelling purposes, the projected GHG intensity of the UK electricity grid is based on the grid mix data in the National Grid’s Future Energy Scenarios (~70% reduction in the electricity grid GHG intensity in 2030 compared to today). The GHG intensities modelled for the GB and Scottish grids include upstream emissions in line with EU RED requirements. As shown in Figure 10, all Scottish electrolysis and distribution pathway combinations using GB grid electricity intensities are expected to be above the EU GHG threshold in 2023, and only the compressed pipeline pathway may just comply in 2030.
The added emissions from the higher GB grid intensity are particularly significant for pathways transporting hydrogen via ammonia, increasing by over 100% compared to the same pathway using the Scottish grid factor.
Scottish producers would therefore gain a significant advantage if the Commission were to allow a Scottish grid factor to be used (and under EU RED rules, this decision would also become more likely if zonal pricing across GB is introduced, provided there are one or more zones in Scotland).
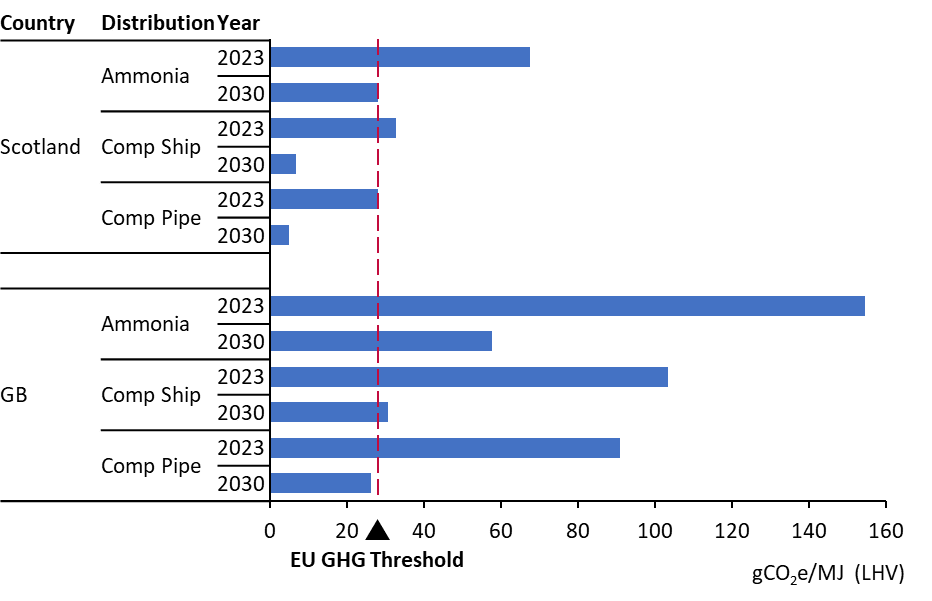
Sensitivity 3: Low-carbon shipping fuel
In the baseline, ships are assumed to use fossil marine diesel fuel exclusively in 2023, but in 2030, 25% of the fleet is assumed to be fuelled by zero emission hydrogen or ammonia. As a sensitivity, we explored switching to 100% zero emission shipping fuel (such as renewable ammonia) in 2030, when supply is expected to be more readily available. For simplicity, this zero emission fuel is assumed to be sourced from supplies other than the shipping cargo, so as to not impact the chain efficiencies. The resulting sensitivity results show a modest reduction in emissions across all shipping pathways but is more noticeable in pathways with high shipping distances such as from Chile.
Compared to the baseline, using 100% zero emissions shipping fuel to transport renewable or grid electricity based ammonia from Chile to Rotterdam could reduce the total pathway emissions by 18% or 8% respectively in 2030, or by 6% for US renewable ammonia pathways in 2030. This sensitivity for the Chile and USA renewable electrolysis pathways would enable compliance with the EU GHG threshold in 2030.
However, for hydrogen production in countries other than Chile and USA (using renewable electricity and ammonia distribution), decarbonising shipping fuel in 2030 is unlikely to be significant enough to enable previously non-compliant pathways to fall below the GHG threshold.
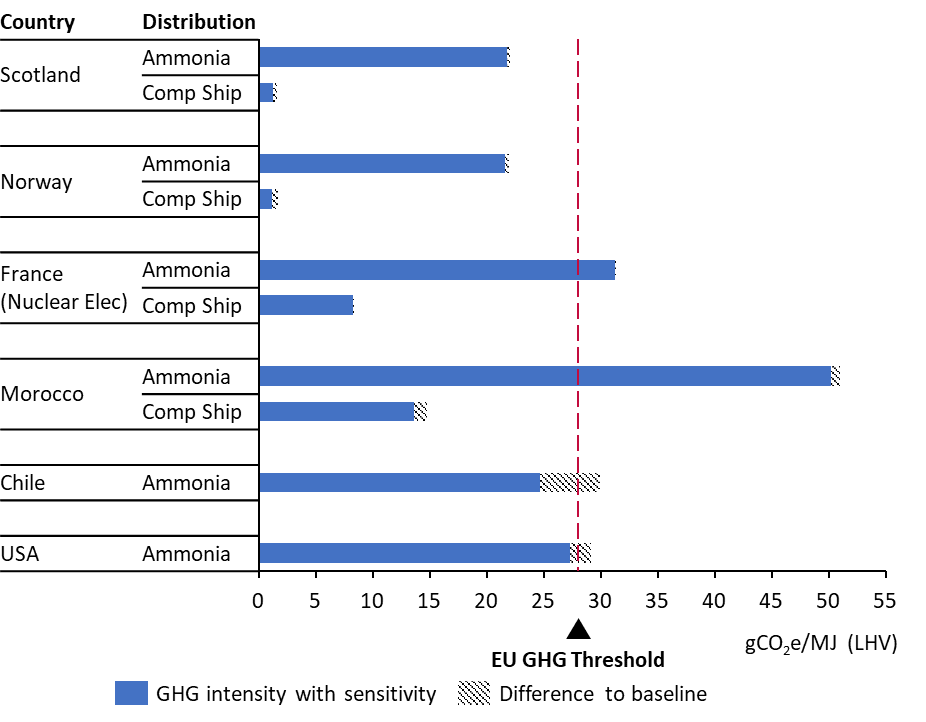
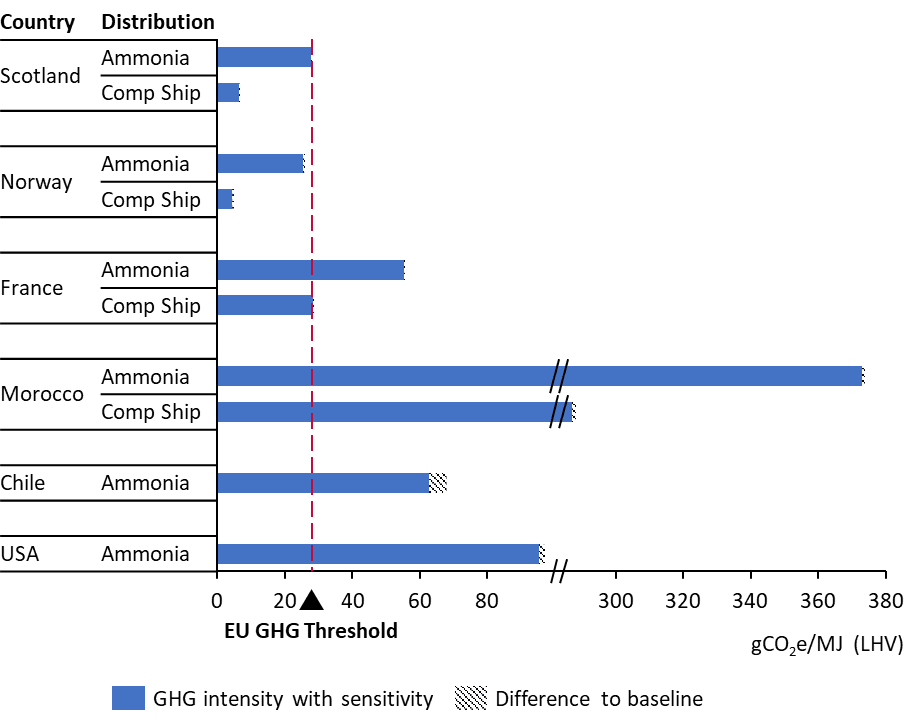
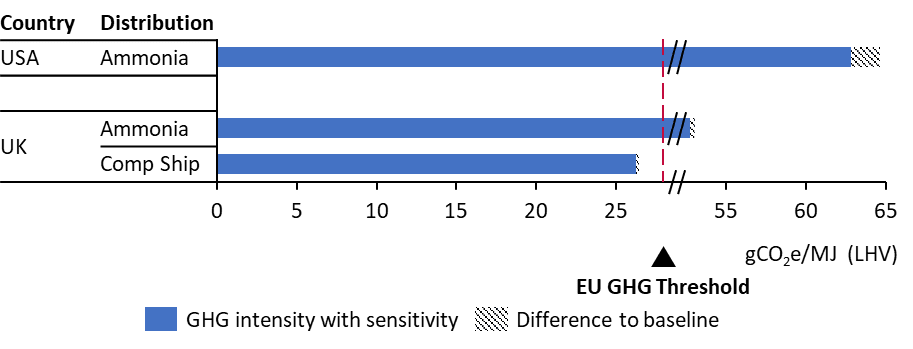
Sensitivity 4: Renewable heat
In the baseline, the ammonia pathways that require reconversion to gaseous hydrogen are assumed to consume some of the shipped ammonia to provide heat for the cracking process. For this sensitivity, utilisation of renewable industrial heat (from an alternative source with zero emissions) instead of self-consumption of ammonia was modelled.
Figure 14 shows that using alternative renewable heat for renewable ammonia cracking could enable production in Norway to achieve compliance with the threshold in 2023, but not other countries. However, as shown in Figure 15, this sensitivity does not sufficiently reduce the GHG intensity to achieve compliance with the EU GHG threshold for any grid-based ammonia pathways in 2023. But by 2030, decarbonisation of Scotland’s grid may be enough to enable the Scottish grid-based ammonia pathway to comply.
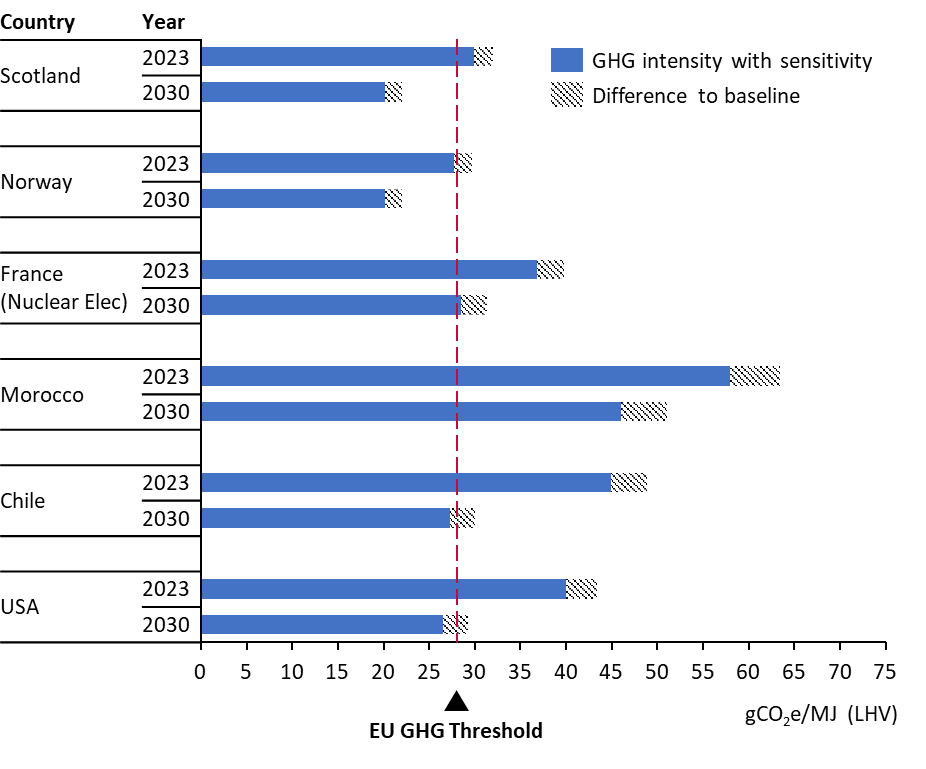
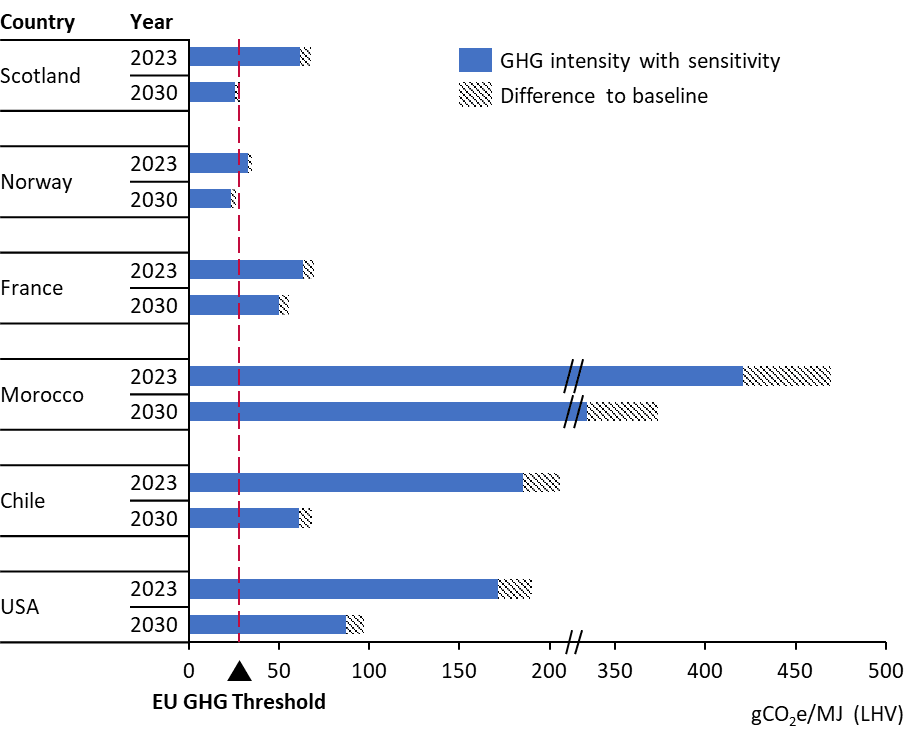
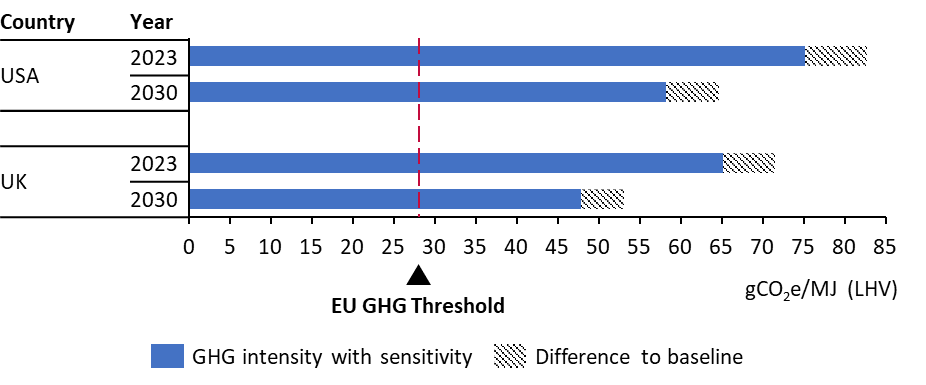
Appendix G GHG Emission Compliance Scoring Matrix
The GHG intensity calculated for each pathway in 2023 and in 2030 were compared against the EU GHG emissions threshold of 28.2 gCO2e/MJLHV to evaluate the risk of non-compliance for each potential hydrogen exporting country. The table below summarises the results from the GHG intensity scoring including justification for the scores. A selection of GHG reduction measures were modelled in the sensitivity analysis to evaluate the impact of using renewable electricity across all the post-production supply chain steps, using (alternative) renewable heat for the ammonia cracking step of relevant pathways, and/or switching in 2030 to using only zero emission marine fuels for shipping pathways. See Appendix F for further details. Scottish vs GB grid results are given below as separate pathways scores. Those scores marked with a * do not have any relevant sensitivities modelled that reduce their emissions, so cannot be medium risk. The following scoring was used:
|
L |
Low risk: Likely to comply with GHG threshold set under EU RED and EU Gas Directive |
|
M |
Medium risk: Could comply if relevant GHG reduction measures modelled in the sensitivity analysis are applied |
|
H |
High risk: Likely to not comply, even with relevant GHG reduction measures modelled in the sensitivity analysis |
|
Country |
Hydrogen Value Chain |
2023 |
2030 |
Reasoning |
|
Scotland |
Ammonia (Scottish grid factor), shipping, cracking, H2 use |
M |
L |
2023 can comply if renewable electricity is used throughout the chain. In 2030, Dutch electricity grid decarbonisation reduces cracking impact allowing compliance. |
|
Scotland |
Ammonia (Scottish grid factor), shipping, Ammonia use |
L |
L |
Below the threshold, despite emissions arising from conversion steps. |
|
Scotland |
Compression (Scottish grid factor), shipping, H2 use |
L |
L |
Well below the threshold |
|
Scotland |
Compression (Scottish grid factor), shipping, H2 use |
L |
L |
Well below the threshold |
|
Scotland |
Ammonia (GB grid factor), shipping, cracking, H2 use |
M |
L |
2023 can comply if renewable electricity is used throughout the chain. In 2030, Dutch electricity grid decarbonisation reduces cracking impact allowing compliance. |
|
Scotland |
Ammonia (GB grid factor), shipping, ammonia use |
L |
L |
Below the threshold, despite conversion emissions. |
|
Scotland |
Compression (GB grid factor), H2 use |
L |
L |
Well below the threshold |
|
Scotland |
Compression (GB grid factor), pipeline, H2 use |
L |
L |
Well below the threshold |
|
Norway |
Ammonia, shipping, cracking, H2 use |
M |
L |
Using renewable heat or renewable electricity in 2023 can enable compliance. |
|
Norway |
Ammonia, shipping, ammonia use |
L |
L |
Below the threshold, despite conversion emissions. |
|
Norway |
Compression, shipping, H2 use |
L |
L |
Well below the threshold |
|
Norway |
Compression, pipeline, H2 use |
L |
L |
Well below the threshold |
|
France (nuclear) |
Ammonia, shipping, cracking, H2 use |
M |
M |
Threshold can be met in 2023 and 2030 by using renewable electricity for ammonia cracking. |
|
France (nuclear) |
Ammonia, shipping, ammonia use |
M |
L |
Using renewable electricity throughout chain enables compliance in 2023. 2030 is just compliant due to decarbonisation of the Dutch electricity grid. |
|
France (nuclear) |
Compression, shipping, H2 use |
L |
L |
Well below the threshold, even with some nuclear electricity emissions. |
|
France (nuclear) |
Compression, pipeline, H2 use |
L |
L |
Well below the threshold, even with some nuclear electricity emissions. |
|
Morocco |
Ammonia, shipping, cracking, H2 use |
M |
M |
Morocco’s grid leads to high ammonia conversion emissions, but if renewable electricity was used instead, could comply. |
|
Morocco |
Ammonia, shipping, ammonia use |
M |
M |
Morocco’s grid leads to high ammonia conversion emissions, but if renewable electricity was used instead, could comply. |
|
Morocco |
Compression, shipping, H2 use |
L |
L |
Below the threshold, despite Moroccan grid input for compression. |
|
Morocco |
Compression, pipeline, H2 use |
L |
L |
Below the threshold, despite Moroccan grid input for compression. |
|
USA |
Ammonia, shipping, cracking, H2 use |
M |
M |
Using renewable electricity can enable compliance. |
|
USA |
Ammonia, shipping, ammonia use |
M |
L |
2030 just below threshold, but using renewable electricity throughout chain, rather than New Jersey’s high intensity grid, can enable compliance in 2023. |
|
Chile |
Ammonia, shipping, cracking, H2 use |
M |
M |
Using renewable electricity throughout chain can enable compliance. |
|
Chile |
Ammonia, shipping, ammonia use |
M |
L |
2030 just below threshold, but using renewable electricity throughout chain, rather than Chile’s high intensity grid, can enable compliance in 2023. |
|
Country |
Hydrogen Value Chain |
2023 |
2030 |
Reasoning |
|
Scotland (Scottish grid factor) |
Ammonia (Scottish grid factor), shipping, cracking, H2 end use |
H |
L |
Electricity grid decarbonisation enables this pathway to just fall below the threshold in 2030, but not in 2023. |
|
Scotland (Scottish grid factor) |
Ammonia (Scottish grid factor), shipping, ammonia end use |
H* |
L |
Electricity grid decarbonisation enables this pathway to just fall below the threshold in 2030, but not in 2023. |
|
Scotland (Scottish grid factor) |
(Scottish grid factor) compressed H2, shipping, H2 end use |
H* |
L |
Just above the threshold in 2023, but electricity grid decarbonisation enables this pathway to fall well below the threshold in 2030. |
|
Scotland (Scottish grid factor) |
(Scottish grid factor) compressed H2, pipeline, H2 end use |
L* |
L* |
Just below the threshold in 2023, and electricity grid decarbonisation enables this pathway to fall well below the threshold in 2030 |
|
Scotland (GB grid factor) |
Ammonia (GB grid factor), shipping, cracking, H2 end use |
H |
H |
GB electricity grid ~3 times more GHG intensive than Scotland’s, leading to emissions well above the threshold, even with projected grid decarbonisation. |
|
Scotland (GB grid factor) |
Ammonia (GB grid factor), shipping, ammonia end use |
H* |
H |
GB grid ~3 times more GHG intensive than Scotland’s, leading to emissions well above the threshold, even with projected grid decarbonisation. |
|
Scotland (GB grid factor) |
(GB grid factor) compressed H2 shipping, H2 end use |
H* |
H |
GB electricity grid decarbonisation not quite enough to meet threshold by 2030. |
|
Scotland (GB grid factor) |
(GB grid factor) compressed H2 pipeline, H2 end use |
H* |
L |
GB electricity grid decarbonisation not quite enough to meet threshold by 2030. |
|
Norway |
Ammonia, shipping, cracking, H2 end use |
H |
L |
Decarbonisation of Norway and Netherlands electricity grids enables compliance in 2030. |
|
Norway |
Ammonia, shipping, ammonia end use |
L* |
L |
Below threshold, despite conversion emissions. |
|
Norway |
Compressed H2 shipping, H2 end use |
L* |
L |
Well below the threshold. |
|
Norway |
Compressed H2 pipeline, H2 end use |
L* |
L* |
Well below the threshold. |
|
France |
Ammonia, shipping, cracking, H2 end use |
H |
H |
France’s electricity grid decarbonisation is not enough to comply in 2030. |
|
France |
Ammonia, shipping, ammonia end use |
H* |
H |
France’s electricity grid decarbonisation is not enough to comply in 2030. |
|
France |
Compressed H2 shipping, H2 end use |
H* |
H |
France’s and Netherland’s electricity grid decarbonisation is not enough to comply. |
|
France |
Compressed H2 pipeline, H2 end use |
H* |
L* |
France’s electricity grid decarbonisation combined with low emissions from distribution allows compliance in 2030. |
|
Morocco |
Ammonia, shipping, cracking, H2 end use |
H |
H |
Morocco’s grid has a very high GHG intensity, significantly exceeding the threshold. |
|
Morocco |
Ammonia, shipping, ammonia end use |
H* |
H |
Morocco’s grid has a very high GHG intensity, significantly exceeding the threshold. |
|
Morocco |
Compressed H2 shipping, H2 end use |
H* |
H |
Morocco’s grid has a very high GHG intensity, significantly exceeding the threshold. |
|
Morocco |
Compressed H2 pipeline, H2 end use |
H* |
H* |
Morocco’s grid has a very high GHG intensity, significantly exceeding the threshold. |
|
USA |
Ammonia, shipping, cracking, H2 end use |
H |
H |
New Jersey’s grid has a high GHG intensity, significantly exceeding the threshold, even with expected decarbonisation by 2030. |
|
USA |
Ammonia, shipping, ammonia end use |
H* |
H |
New Jersey’s grid has a high GHG intensity, significantly exceeding the threshold, even with expected decarbonisation by 2030. |
|
Chile |
Ammonia, shipping, cracking, H2 end use |
H |
H |
Chile’s grid has a high GHG intensity, significantly exceeding the threshold, even with expected decarbonisation by 2030. |
|
Chile |
Ammonia, shipping, ammonia end use |
H* |
H |
Chile’s grid has a high GHG intensity, significantly exceeding the threshold, even with expected decarbonisation by 2030. |
|
Country |
Hydrogen Value Chain |
2023 |
2030 |
Reasoning |
|
USA |
Ammonia, shipping, cracking, H2 end use |
H |
H |
Natural gas upstream emissions combined with N2O emissions, chain efficiency losses and the New Jersey electricity grid means emissions significantly above the threshold. |
|
USA |
Ammonia, shipping, ammonia end use |
H |
H |
Natural gas upstream emissions combined with N2O emissions, chain efficiency losses and the New Jersey electricity grid means emissions significantly above the threshold. |
|
UK |
Ammonia (GB grid factor), shipping, H2 end use |
H |
H |
Natural gas upstream emissions combined with N2O emissions, chain efficiency losses, and GB electricity grid means emissions significantly above the threshold. |
|
UK |
Ammonia (GB grid factor), shipping, Ammonia end use |
H |
H |
Natural gas upstream emissions combined with N2O emissions, chain efficiency losses, and GB electricity grid means emissions significantly above the threshold. |
|
UK |
Compression (GB grid factor), shipping, H2 end use |
M |
L |
Using renewable electricity for ATR+CCS hydrogen production and distribution could enable compliance in 2023. GB electricity grid and shipping decarbonisation could just lead to compliance in 2030 (but still sensitive to upstream natural gas emissions). |
|
UK |
Compression (GB grid factor), pipeline, H2 end use |
L |
L |
Low distribution emissions may just allow compliance in 2023 (but still sensitive to upstream natural gas emissions). |
Appendix H Methodology for calculating the cost of compliance
For those pathways identified with an amber rating, ClimateXChange requested a methodology for calculating the costs (in £/kg) of meeting EU GHG intensity requirements if the GHG intensity of a delivered hydrogen pathway is too high but could be made compliant via implementing various GHG emission reduction measures.
This methodology will allow ClimateXChange to combine energy and fuels unit cost data (for 2023 and 2030) from their previous report with the usage rates and relative GHG emission intensities from this project, to calculate the added costs of compliance, potentially as a weighted average cost across multiple mitigation options.
Table 12 outlines the steps that can be taken to calculate the minimum cost of compliance for the “amber rating” hydrogen pathways. This approach relies on the user selecting mitigation measures that are independent of each other[9] and does not take into account any variation in cost within a mitigation measure, nor how these abatement costs compare to other options outside of the supply chain sensitivities explored (or other decarbonisation options for the end user outside of these hydrogen pathways).
|
Step |
Methodology |
Example (purely illustrative) |
|---|---|---|
|
1 |
Model the GHG intensity of the delivered hydrogen without any measures applied |
48.2 gCO2e/MJLHV hydrogen |
|
2 |
Model the cost of the delivered hydrogen without any measures applied |
£19.2/kg ÷ 120 MJLHV/kg = £0.16/MJLHV hydrogen |
|
3 |
Calculate the reduction in GHG intensity required to achieve the EU GHG emission threshold (step 1 – 28.2 gCO2e/MJLHV) |
48.2 – 28.2 = 20.0 gCO2e/MJLHV hydrogen abatement required |
|
4 |
Identify an emission reduction measure |
Wind electricity replacing grid electricity across the whole pathway (at the same availability as grid) |
|
5 |
Model the delivered hydrogen GHG intensity with the new measure applied |
15.2 gCO2e/MJLHV hydrogen |
|
6 |
Calculate the maximum abatement potential of the new measure (step 1 – step 7) |
48.2 – 15.2 = 33.0 gCO2e/MJLHV hydrogen abated |
|
7 |
Model the delivered hydrogen cost with the new measure applied |
£21.6/kg ÷ 120 MJLHV/kg = £0.18/MJLHV hydrogen |
|
8 |
Calculate the added cost of the new measure (step 7 – step 2) |
0.18 – 0.16 = 0.02 £/MJLHV hydrogen |
|
9 |
Calculate the abatement cost of the new measure, by dividing step 8 by step 6 then multiplying by 1,000,000 |
(0.02 £/MJLHV hydrogen ÷ 33.0 gCO2e/MJLHV hydrogen) x 1,000,000 g/t = £606/tCO2e abated |
|
10 |
Repeat steps 4 – 9 for each individual mitigation measure, and rank the mitigation measure abatement potentials by their abatement costs (step 9 results) |
Max 2.0 gCO2e/MJLHV hydrogen abated @£300/tCO2e for renewable shipping fuel replacing fossil marine diesel Max 33.0 gCO2e/MJLHV hydrogen abated @£606/tCO2e for renewable power replacing Scottish grid Max 12.0 gCO2e/MJLHV hydrogen abated @£700/tCO2e for (alternative) renewable heating replacing ammonia cracking self-heating |
|
11 |
Repeat steps 4-10 as many times as there are measures, but instead of assessing measures individually, start with the lowest abatement cost measure, then cumulatively include each extra measure on top of the others (following the step 10 ranking), to output a new list of abatement potentials ranked by their new abatement costs. At the end of each new step 10, overwrite step 1 with the latest step 5 result, and overwrite step 2 with the latest step 7 result, before adding the next measure in step 4 again. |
2.0 gCO2e/MJLHV hydrogen abated @£300/tCO2e for renewable shipping fuel replacing fossil marine diesel 33.0 gCO2e/MJLHV hydrogen abated @£606/tCO2e for renewable power replacing Scottish grid 3.0 gCO2e/MJLHV hydrogen abated @£2,800/tCO2e for (alternative) renewable heating replacing ammonia cracking self-heating |
|
12 |
Select enough measures in ranked order (cheapest first) from step 11 to achieve the step 3 requirement, noting that the whole abatement potential of each measure may not be needed |
2.0 gCO2e/MJLHV hydrogen abated @£300/tCO2e for renewable shipping fuel replacing fossil marine diesel 18.0 gCO2e/MJLHV hydrogen abated @£606/tCO2e for renewable power replacing Scottish grid No (alternative) renewable heating needed |
|
13 |
Calculate a weighted average of the selected step 12 abatements and abatement costs to calculate the overall minimum cost of compliance |
(2 x 300 + 18 x 606 + 0 x 2,800) / (2 + 18 + 0) = £575/tCO2e abated |
|
14 |
Finally, convert step 13 into £/kg by dividing by 1,000,000 then multiplying by step 3 and multiplying by the LHV energy content of the delivered hydrogen |
(£575/tCO2e abated ÷ 1,000,000 g/t) x 20 gCO2e/MJLHV hydrogen x 120 MJLHV/kg = £1.38/kg extra required to comply with EU GHG threshold |
© The University of Edinburgh, 2024
Prepared by ERM on behalf of ClimateXChange, The University of Edinburgh. All rights reserved.
While every effort is made to ensure the information in this report is accurate, no legal responsibility is accepted for any errors, omissions or misleading statements. The views expressed represent those of the author(s), and do not necessarily represent those of the host institutions or funders.
The rationale for a voluntary standard is that it builds consumer trust and encourages participation through market-driven benefits like increased demand and price advantages, without imposing penalties. It supports self-regulation and is easier to implement internationally, avoiding the need for legislative enforcement. ↑
Other standards that could incentivise the uptake of low-carbon hydrogen are also available in some regions (e.g. UK’s Renewable Transport Fuel Obligation, or California’s Low Carbon Fuel Standard). They have been excluded from this analysis because they are targeted at non-EU consumption, which is unlikely to affect hydrogen exports to the EU market. No further relevant standards were identified within those countries (Norway, Morocco, Chile) in scope of this study. ↑
Upstream emission factor for nuclear fuel is taken from Table 3 from RED Delegated Act on GHG methodology for RCFs and RFNBOs (1.2 gCO2e/MJ LHV fuel) (European Commission, 2023). Nuclear power plant LHV efficiency of 33% then applied (JRC, 2020). ↑
Feedstock emissions are only relevant to natural gas pathways and includes the upstream emissions for e.g. natural gas extraction, pre-processing and transport, including methane leakages. ↑
The maximum theoretical efficiency that a heat engine may have operating between two given temperatures. It is used in the LHV energy allocation methodology when heat or steam is a co-product. ↑
GOs is an assurance scheme to demonstrate to end-users that a product (e.g. hydrogen, electricity, biogas) are produced from renewable sources. In electricity, this can take the form of Renewable Electricity Certificates (RECs) or Power Purchasing Agreements (PPAs). More information on this in Appendix A. ↑
The maximum credit value is $0.60/kg hydrogen. This amount is multiplied by 5 (i.e. maximum credit value of $3.0/kg hydrogen) if the production facility meets prevailing wage requirements and apprenticeship requirements defined under the IRA. ↑
This is due to avoided methane emissions. ↑
If any of the measures are not independent of each other (e.g. if one measure impacts the efficiency of the supply chain), these non-independent measures may change the maximum abatement potential of other measures, and the abatement costs of some measures may also be impacted by the costs and order/combinations of other measures applied (or not applied). This process to find a minimum compliance cost may be iterative and will rely on cost & GHG modelling of the whole supply chain exploring combinations of measures. ↑
