

Onshore and inshore storage of carbon dioxide
July 2024
DOI: http://dx.doi.org/10.7488/era/4622
Executive summary
Scotland’s net zero 2045 ambition and updated Climate Change Plan require the rapid development of carbon capture and storage (CCS) and carbon dioxide removal (CDR). Current pathways to meeting statutory targets are dependent on large industrial clusters, funded by the UK Government.
Alternative pathways for the rapid decarbonisation of smaller, distributed biogenic sources of carbon dioxide (CO2) may be available, noting that these would be of an order of magnitude less than the industrial clusters, with the advantage of high-value CDR credits. This requires permits for storage sites within Scottish inshore waters which extend to 12 nautical miles from the coast, and policy coordination across capture, transport and storage.
This study explored the potential total CO2 storage capacity in Scottish inshore areas and the availability of onshore emissions originating from biomass, known as bio-CO2. The study also investigated if the distribution of potential sources and storage availability would make it possible to expedite Scotland’s CCS and CDR potential.
The capture of bio-CO2 is already a commercial success in Scotland, with an ambition to scale without subsidy to 1 million tonnes per year by 2030, which requires storage. Norway, Denmark and Iceland are selling CO2 storage at a premium, reflecting a supply-and-demand imbalance in regional storage availability.
Aims
This study aimed to assess the potential for developing CCS within 12 nautical miles of the Scottish shoreline – an area within Scottish Ministers’ competence. We explored the feasibility to deploy high-value capture and low-cost CO2 storage in Scotland and what the commercially viable total capacity for nearshore storage is likely to be. The outcomes also address the availability of bio-CO2, domestic CCS value chains, fit-for-purpose storage site licensing and high-value CDR certificates.
We propose that Scotland can make rapid progress by refocusing on domestic bio-CO2. These emissions are already being captured in Scotland at low cost and with simple technology.
We identified prospects within the 12 nm territorial waters. Developing secure storage of high value bio-CO2 within the Scottish jurisdiction can produce several financial benefits, including premium lease payments to Crown Estate Scotland, development of local skills and growth of new businesses. This has the potential to increase Scottish GDP by tens to hundreds of millions of pounds per year, as well as paying staff and corporate taxes.
Developing Scottish storage sites for CO2 provides elements of control over licensing and the pace of approval for carbon capture and storage. Developing secure storage of high value bio-CO2 within the Scottish jurisdiction can produce CO2 removals, equivalent to direct air capture but at much lower financial cost.
We reviewed the potential for the rapid licensing of inshore storage using a streamlined version of UK licensing. Four geographic areas of interest are ranked by maturity of evaluation. We examine when injection could start if all regulations were in place across the different authorities.
Findings
We addressed five elements of CCS: licensing, storage, sources, timeframes and cost. We found that it is theoretically possible to adopt a streamlined licensing framework; inshore storage is available for rapid appraisal, albeit at a very limited capacity compared to offshore; bio-CO2 sources are abundant across nine sectors with explosive growth potential driven by the global CDR market; timeframes can be measured in years with the potential to deliver operational injection of bio-CO2 before 2030; costs are competitive with UK clusters and export markets.
Licensing
- CO2 storage involves multiple activities under different licensing regimes.
- New regulations for CO2 storage are not required.
- Minor amendments to existing statutory instruments may be required.
- The amendments may be fast if based on existing UK regulations and the CCS Directive.
- A Crown Estate Scotland (CES) lease is also required.
- Consents may also be required from the Scottish Environmental Protection Agency (SEPA) and the Scottish Government’s Marine Directorate.
Storage
- Four areas have well data and seismic coverage.
- Only the Lybster oil field is a candidate for immediate development.
- The total expected nearshore capacity is 2 Mt without further extensive surveying.
- The Forth Basin is a low Technology Readiness Level research opportunity.
Sources
- We mapped 98 of the largest bio-CO2 sources in Scotland.
- Source emissions range from 2 to 360 kilotonnes per annum.
- Separation of CO2 from distilleries and biogas upgrading are low cost.
- Combustion sources are higher cost and are the largest sources and sectors.
- The source distribution across five clusters favours road transport to local storage.
Timeframes
- North Sea Transition Authority appraisal licences average five years and three months.
- Appraisal are followed by storage permits and 2 years of further site development.
- The fastest storage permits are issued in as little as three years.
- The fastest development of a site to first injection is around a year.
- Lybster permitting could be fast but requires further exploration of legal frameworks.
- Rapid progression is dependent on pre-existing data to confirm site suitability.
Costs
- Capture costs for separation sources are low, at £60 per tonne.
- Capture costs for combustion sources are higher, at £120 per tonne.
- Truck transport costs £20 per tonne per 100 miles, or £0.12/tonne/km.
- Storage costs for Lybster are £70 per tonne.
- The full chain CCS cost is £150 per tonne for separation within 100 miles of Lybster.
- Storage costs for sites further offshore are at least two to three times higher.
Revenue
- CDR credits on the European voluntary market are worth £297 per tonne.
- Taxing storage would be subject to further work by the Scottish Government.
- As a simple example, a 10% tax could yield between £7 and £30 per tonne per annum.
- Lybster tax revenue would be £30 million for a 2 Mt capacity and £15 per tonne tax.
- Further revenue is available if bio-CO2 is transported to Acorn via the Feeder 10 pipeline.
- Combined revenue for Lybster and Feeder 10 could total £250-500 million by 2045.
Next steps
In order to progress the potential benefits of CCS and CDR in Scotland, we recommend the following actions.
- The Scottish Government could conduct further work to fully understand the law around consenting and regulating storage and consider pursuing a streamlined regulatory framework for storage that builds on the structure established by the NSTA while emulating the accelerated approach taken by Denmark and Norway. This is relevant to Scottish policy, legislators, SEPA, and the Marine Directorate.
- The Scottish Government could consider supporting an appraisal of Lybster with the involvement of a compliant operator. This would require 3D seismic interpretation to build a static model and undertake reservoir simulation. This could be completed within one year with the intention of transitioning to a front-end engineering design study and development decision within three years. This requires a competent person’s report on the site, model outcomes, and risk analysis.
- The Forth Basin saturated water injection proposal could be considered as a potential research pilot to mature the concept and location from its current low TRL. This is relevant to the Scottish universities’ research community and British Geological Survey.
- Maturing the Fraserburgh and Solway Firth areas could proceed when market signals support the necessary investment in data acquisition and offshore development.
- The Scottish Government could seek mechanisms and policies to maximise the domestic benefits of full chain CCS, rather than exporting captured bio-CO2 to storage providers in other countries. The high concentration of bio-CO2 sources in the central belt raises the possibility of a gathering station for Feeder 10 access to Acorn.
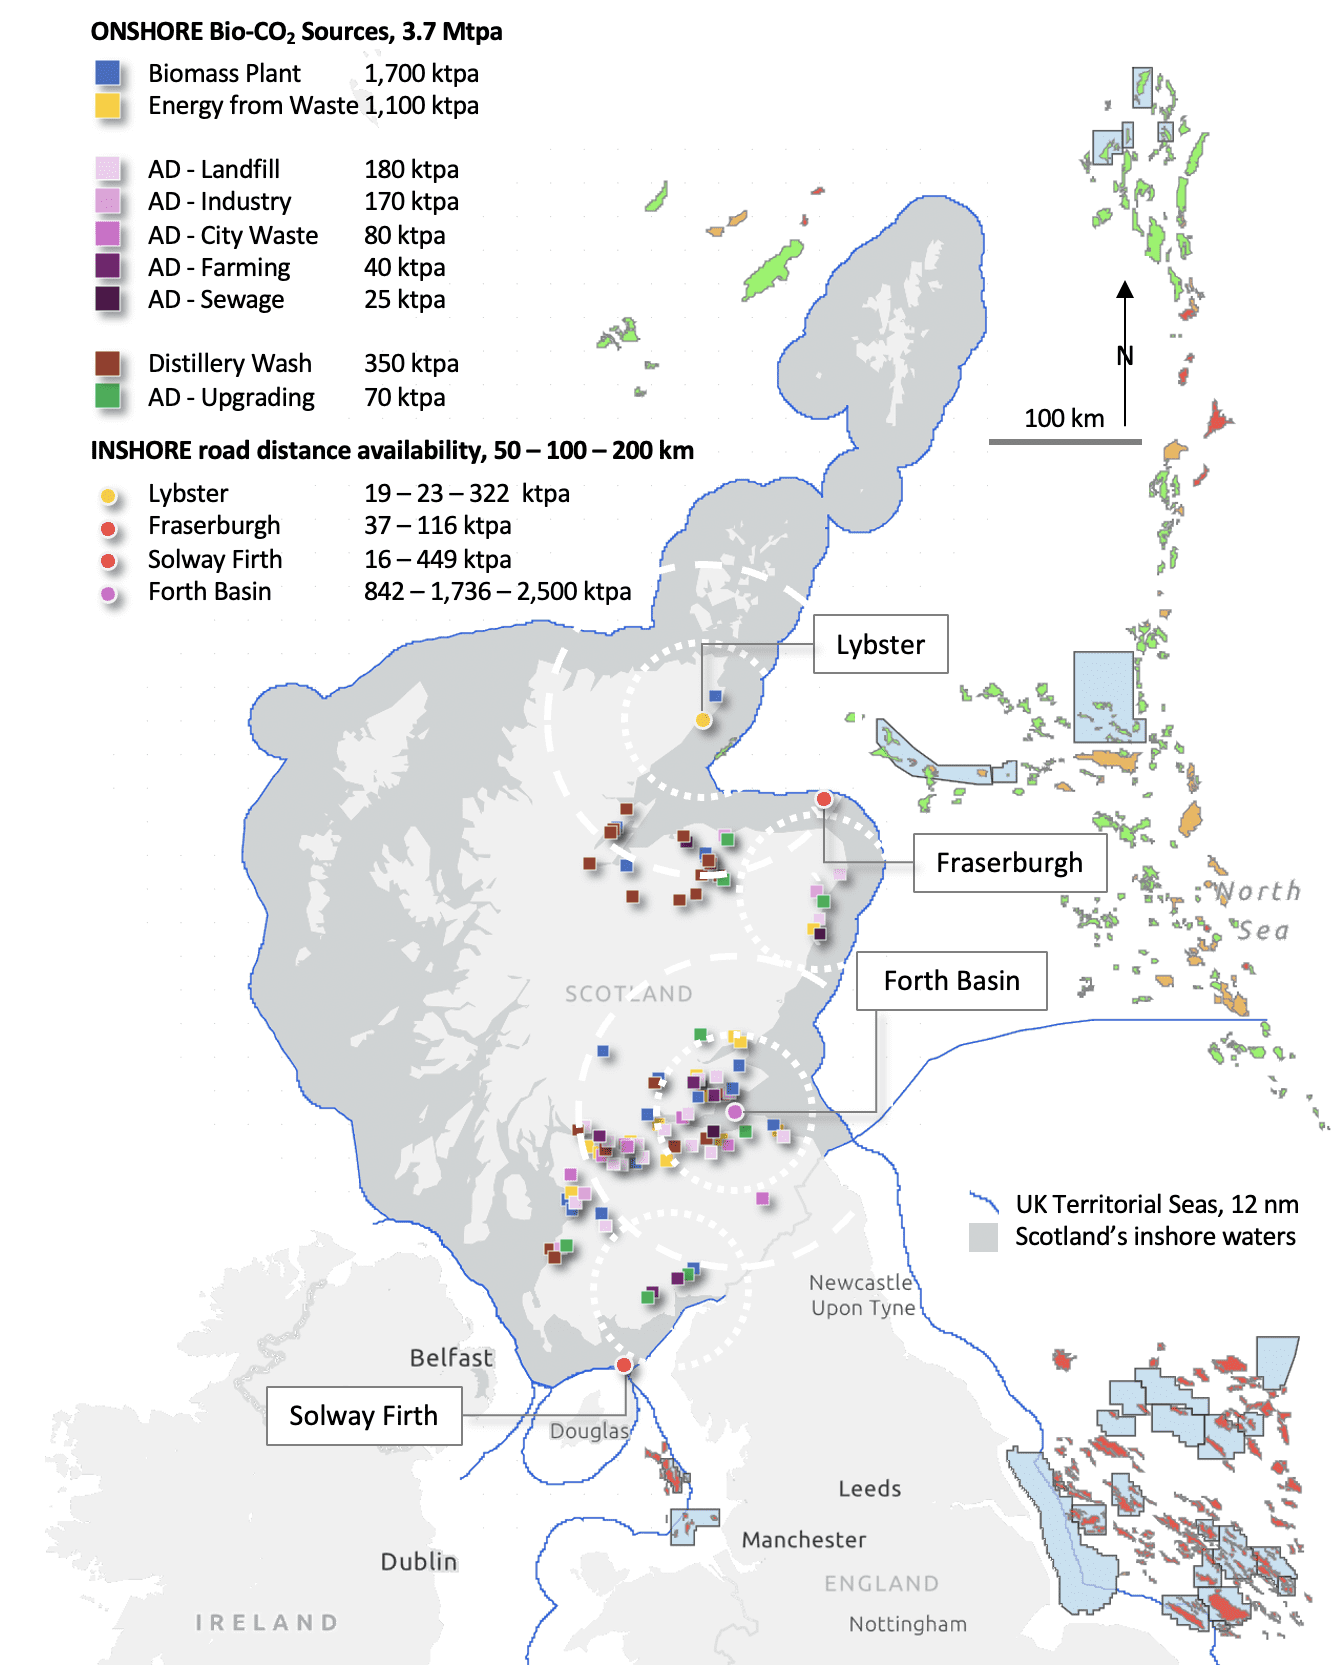
Onshore bio-CO2 sources located close to inshore CO2 storage prospects.
(Sources: SCCS, BGS, SNZR, NNFCC, NSTA)
List of abbreviations
|
AD |
Anaerobic Digester |
|
AOI |
Area of Interest |
|
BEIS |
Department for Business, Energy, and Industrial Strategy |
|
BSA |
Boston Square Analysis |
|
Bio-CO2 |
CO2 from decomposition, digestion, or combustion of biomass |
|
CCS |
Carbon Capture and Storage |
|
CDR |
Carbon Dioxide Removal |
|
CES |
Crown Estate Scotland |
|
DECC |
Department of Energy and Climate Change |
|
DESNZ |
Department for Energy Security and Net Zero |
|
DF |
Distillery Fermentation |
|
EfW |
Energy from Waste |
|
FEED |
Front End Engineering Design |
|
MD |
Marine Directorate |
|
Mtpa |
Million tonnes per annum, equal to 50 litres per second of CO2 |
|
NSTA |
North Sea Transition Authority |
|
OGA |
Oil & Gas Authority, the legal entity for the NSTA |
|
P90-P50-P10 |
Pessimistic-Expected-Optimistic range |
|
SEPA |
Scottish Environmental Protection Agency |
Glossary
|
Aquifer |
An aquifer is an underground layer of water-bearing rock, consisting of porous and permeable materials such as sandstone and chalk. |
|
Biomethane |
Biomethane is methane gas, CH4, that has been produced from the anaerobic digestion of organic matter such as manure, sewage, and organic waste. |
|
Biomethane Upgrader |
A biomethane upgrader is a piece of equipment that transforms biogas to biomethane by filtering out impurities such as other gases that are also generated during anaerobic digestion. |
|
Caprock |
A relatively impermeable rock, commonly shale, anhydrite, or salt, that forms a barrier or seal above and around reservoir rock so that fluids cannot migrate out of the reservoir. |
|
Inshore |
Inshore is a marine area adjacent to the coast of a state or jurisdiction. The inshore area for Scotland is synonymous with the territorial waters that extend 12 nm beyond the coastline. |
|
Regional Aquifer |
A regional aquifer is a water-bearing reservoir that extends laterally for 10s to 100s of km, reflecting a thick regional distribution of the reservoir rock such as a sandstone or chalk. |
|
Seismic |
Seismic in this context refers to the geophysical surveying technique of imaging the geologic structure of the subsurface by using vibrational waves and sonic reflections. |
|
Syncline |
A trough of stratified rock in which the beds dip toward each other from either side to form a u-shaped or v-shaped structure along a geometric axis. |
Introduction
The following report consists of five sections that cover CO2 storage licencing, inshore storage opportunities, available sources of bio-CO2, storage development timeframes, and a cost-revenue analysis of onshore capture, transport, and inshore storage. The report closes with six questions and answers that aim to synthesise the outcomes and propose ways forward.
Licensing
The Energy Act 2008 first enabled CO2 storage in the UK. The Carbon Dioxide Regulations 2010 adopted many requirements of the EU CCS Directive 2009 on the geological storage of carbon dioxide and came into force October 2010 – Appendix A. The regulations were extended in 2011 to address the termination of licences. The CCS Directive was transposed into UK law in 2012 by the adoption of secondary legislation under the authority of the Energy Act 2008.
CCS Directive
An EU regulatory framework for CCS was first proposed by the European Commission in 2007 (EC, 2007). The CCS Directive 2009 provides the framework for CO2 storage with only brief mentions of capture and transport. The CCS Directive is supported by a series of six guidance documents. The guidance covers: the storage complex, characterisation, risk management, stream composition, monitoring and corrective measures, criteria for the transfer of liability to the competent authority, and financial security and financial mechanisms. The Directorate-General for Climate Action (DG CLIMA) commissioned DNV in 2022 to revise the guidance documents to reflect the current understanding of CCS and remove ambiguities identified during the development of early CCS projects. The outcomes can be expected in Q3 2024.
Licensing in the UK
DESNZ currently leads UK government energy policy, preceded by BEIS (2016-2023) and DECC (2008-2016). UK energy policy is framed by HM Treasury budgeting and long-term planning. The Energy Act 2008 makes provision for gas storage, enabling the licensing of CO2 storage appraisals and CO2 storage permitting – Figure 1.
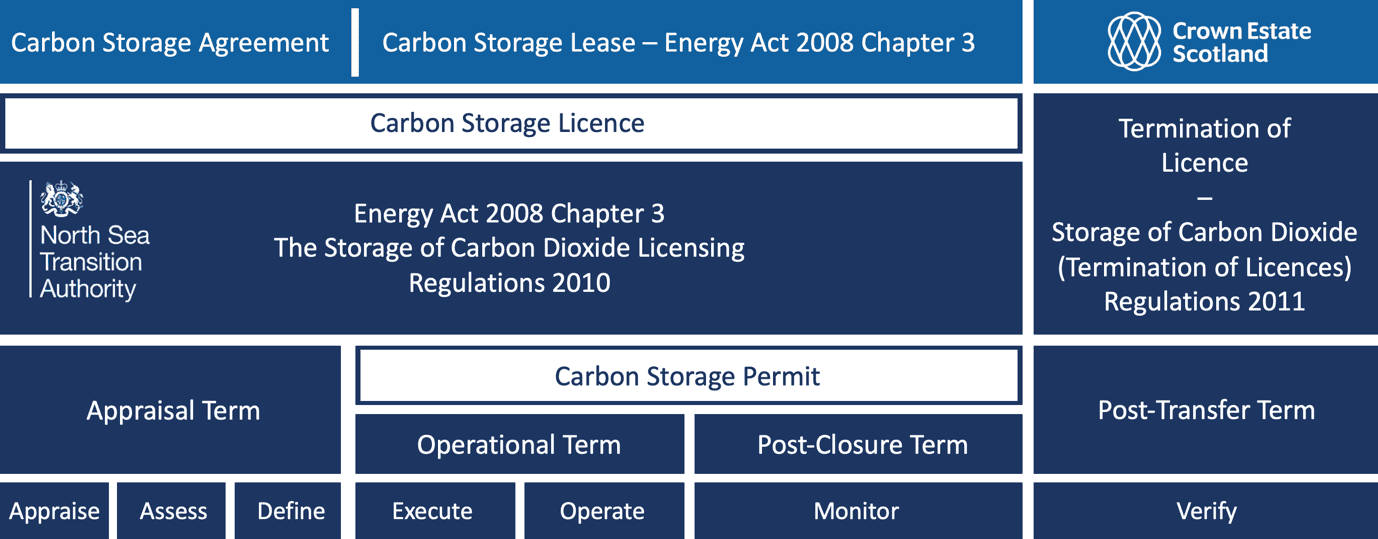
Figure 1. Current UK licensing framework for CO2 storage in Scotland for offshore areas such as Acorn.
UK licensing development
There are currently 27 UK appraisal licences open – see detail in Appendix B and Figure 2.
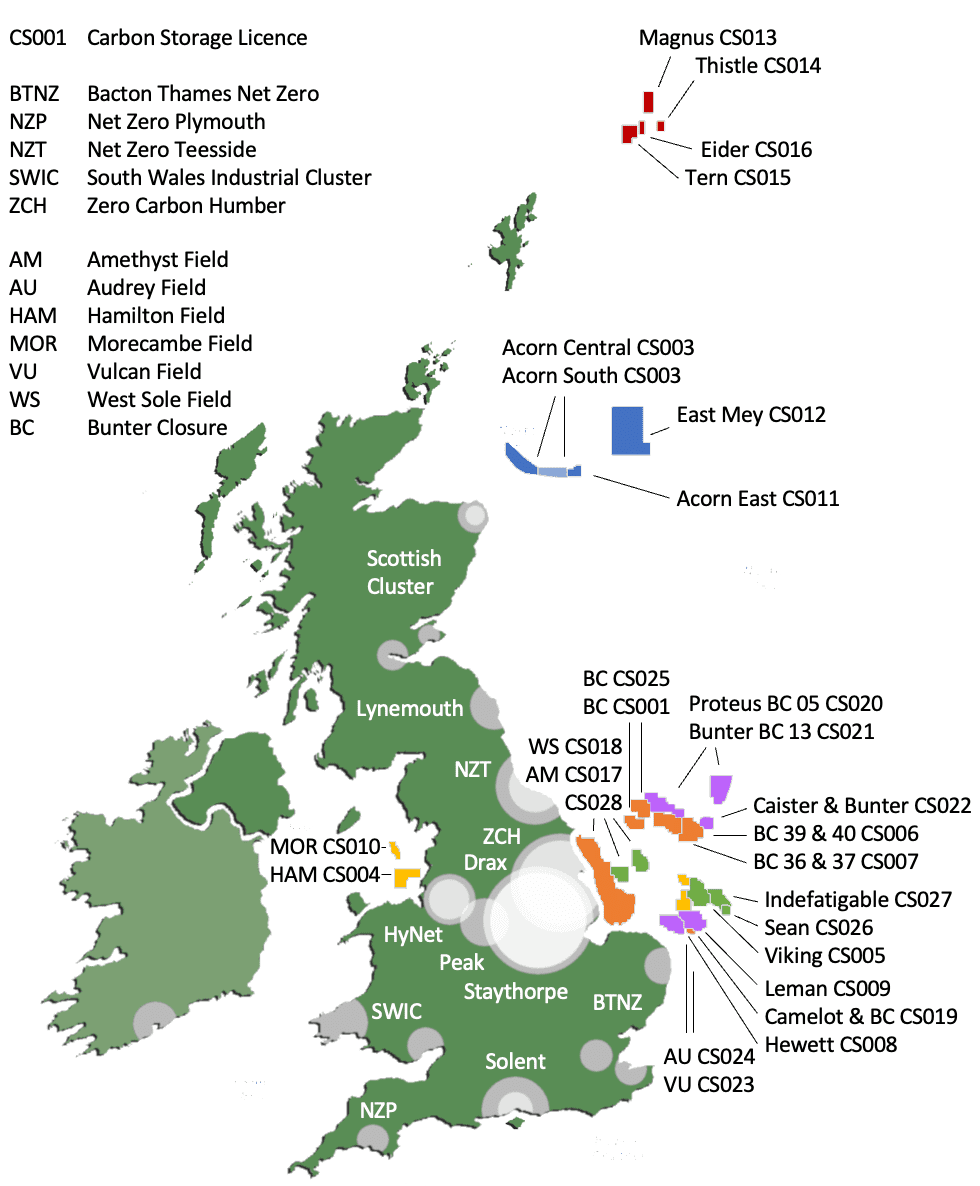
Figure 2. The location of offshore CO2 storage appraisal licences currently active in UK waters.
Licence CS001 and 1CS003-CS027). CS002 was reissued as CS003 in 2023.
Over a decade of policy engagement and early licensing experience has led to the current structure of appraisal licensing, storage permitting, and licence termination. The appraisal licence and storage permit terms both consist of three phases each:
- Appraisal licence phases: 1. Appraise 2. Assess 3. Define
- Storage permit phases: 4. Execute 5. Operate 6. Monitor
The seventh and final phase is a further monitoring period that occurs after the transfer of the site liability from the operator to the regulator with the termination of the storage permit. The seven phases are described in more detail below:
1. Appraise: This initial phase consists of an early risk assessment to establish storage feasibility and identify gaps which are then addressed by site characterisation. The characterisation of the trap structure may require 3D seismic acquisition over the site or reprocessing of an existing survey, and appraisal drilling.
2. Assess: This phase is a thorough evaluation of the site characterisation outcomes, and the operator’s proposed storage plan or need for further appraisal.
3. Define: This phase is a detailed proposal for site development commonly referred to as front end engineering and design (FEED). The design specification and required engineering informs a final investment decision and, if positive, an application for a storage permit.
4. Execute: On issuance of a storage permit, the operator executes the design plan. This entails the construction and commissioning of the engineering works necessary for CO2 injection into the target reservoir and for site conformance monitoring during the operational phase.
5. Operate: This phase commences with the first injection of CO2 and conformance to the operational plan. Any deviation from the planned operational conditions such as pressure excursions, flow impedance, or indications of out-of-zone migration are investigated and addressed to the satisfaction of the regulator, or otherwise promoted to a change in the operational plan up to and including a suspension of operations and early closure of the site.
6. Monitor: This phase commences with the end of injection and closure of the site and is a continuation of any preceding operational monitoring adapted to the specific requirements of conformance monitoring for the post-operational phase.
7. Verify: This phase commences with the end of the storage permit and transfer of site liability to the regulator. It consists of a sustained monitoring plan that verifies the long-term conformance of the site to expected outcomes.
The seven phases outline the structure of the current UK licensing regime – Table 1. In practice, each phase entails many elements that need to be negotiated between the operator and regulator. The negotiations are based on the specific requirements of a storage site and the evidence base of increasingly detailed assessments, characterisation, development proposals, and adaptation to conditions during the execution and operational phases.
Illustrating this, 17 of the 28 appraisal licences include between two and five additional requirements that apply during the initial appraisal phase to support characterisation – Table 2. These range from acquiring 3D seismic and drilling an appraisal well, to undertaking CO2 transport and topside installation studies, core sampling, and fault geomechanical analysis.
Table 1. Main stages of license progression
|
Main stages |
TLA |
Maturity |
|
Early Risk Assessment |
ERA |
Feasibility |
|
Characterise |
CH |
Appraisal |
|
Assess |
AS |
Pre-front-end engineering |
|
Define |
DF |
Front-end engineering design |
|
Permit Application |
PA |
FIP, firm intention to proceed |
|
Construct & Commission |
CX |
FID, final investment decision |
|
Operational |
OP |
OI, on injection |
|
Post-Closure |
PC |
Post-Closure monitoring |
|
Post-Transfer |
PT |
Post-Transfer monitoring |
Table 2. Additional licensing requirements.UK licensing structure
|
Additional Requirement |
Description of Requirement |
|
Seismic RP |
3D Survey reprocessing |
|
Seismic AQ |
3D Survey acquisition |
|
Well |
Appraisal drilling |
|
Injectivity |
Appraisal flow |
|
Wells VSP |
Vertical seismic profile |
|
Firm TR |
Transport study |
|
Firm TS |
Topside installation study |
|
Firm Geomech |
Geomechanical study |
|
Firm Cap |
Caprock seal study |
|
Firm Seal |
Fault seal study |
|
Firm Core |
Core analysis study |
Licensing in Scotland
Inshore developers in Scotland must first secure the appropriate rights to appraise and develop storage from the Crown Estate Scotland (CES). A CES agreement is required for a site appraisal. A CES lease is required for storage in accordance with the Energy Act 2008. The CES approach to managing storage assets is set out in the CCS Asset Profile (CES, 2022).
Onshore consent is covered by Scots law and is a matter for the local planning authority. Offshore consent for CO2 storage in territorial waters is also covered by Scots law, and requires coordination between the Scottish Environmental Protection Agency (SEPA), the Marine Directorate (MD) and the NSTA. The shared jurisdiction is discussed below.
Scots law
The territorial sea adjacent to Scotland is subject to both UK and Scots law. In terms of international law, the UK as the coastal state, enjoys sovereignty in the territorial sea which includes the seabed and subsurface. How the UK decides to exercise that sovereignty is a matter for the UK and this becomes complex in the context of devolution – Appendix C.
Licensing and regulation
Oil and gas fields under the territorial sea adjacent to Scotland are vested in the Crown. Although Scottish Ministers did receive licensing powers for oil and gas in the post-referendum settlement in the context of the Scotland Act 2016, this was explicitly only in relation to the onshore area, defined as lying within the baselines of the territorial sea – section 47. Licensing in relation to all offshore oil and gas, within the territorial sea and under the continental shelf, is a matter for the NSTA. This would be relevant to the closure of the oil production licence for Lybster in preparation for CO2 storage.
Scottish Ministers are established as the licensing for CO2 storage in the territorial sea by section 18 of the Energy Act 2008. The Storage of Carbon Dioxide Regulations 2010 went on to define a licence as granted by the authority, namely the NSTA – Regulation 1.3. However, the Storage of Carbon Dioxide Regulations 2011, a Scottish Statutory Instrument (SSI), transferred the powers to grant storage licences to Scottish Ministers, along with the associated powers to oversee the development, operation, monitoring, and closure of storage sites in Scottish territorial waters. This greatly simplifies the regulatory framework and requirements for licensing storage in Scottish waters.
Two points are worth noting. Firstly, the SSI precedes the 2012 transposition of the CCS Directive, and withdrawal of the UK from the EU in 2020. Very minor amendments to SSI 2011/24 may be required to reflect this. For example, the reporting authority named in the SSI is the European Commission.
Secondly, while the necessary powers sit with Scottish Ministers to oversee storage licensing, the competent authorities, and associated resources and procedures are not developed. Purchasing the services of the NSTA as regulator is an option that requires exploring. The long experience of the NSTA is an important supporting consideration. One option may be an agreement between an existing Scottish authority such as the Marine Directorate and the NSTA to deal with carbon licensing in territorial waters.
There is a precedent, the Memorandum of Understanding between the HSE and OPRED to form the Offshore Safety Directive Regulator, now OMAR, when that directive required a competent authority to deal with health, safety, and environmental risks under one roof (HSE, 2024). While that involved two regulators at UK level, there ought to be no objection to a similar arrangement between a UK and a Scottish regulator given the commonality of purpose and the desirability of a seamless approach.
Liability and ownership
Hydrocarbons in strata, even if residual and uneconomic, are vested in the Crown unless the Crown specifically transferred ownership, which it would be unlikely to do. Regarding liability for operational oil fields, the principal party is the licensee. In most cases, however, liability is joint and several with co-venturers under a joint operating agreement.
For decommissioning, it is a matter of anyone who holds a section 29 notice under the Petroleum Act 1998. Again, this will usually be co-venturers, but the list is lengthened to minimise the risk to the state if duty holders become insolvent. Things get more complicated in relation to any remaining infrastructure under an agreed derogation. Firstly, there is no specific legislation or regulation on this matter; rather it is dealt with in the context of guidance notes issued from time to time by OPRED. Leaving aside the apparent confusion in the guidance over ownership and section 29 notice holders – see Appendix C7. More fundamentally, there is an argument that the use of a Crown lease in relation to CCS constitutes an exercise of property rights. This raises the possibility that pre-existing infrastructure is a fixture in both jurisdictions. It follows that this belongs to the owner of the land or seabed to which it is attached. This has never been tested but is certainly arguable.
By contrast, this is a much easier proposition to establish within the territorial sea where the Crown Estate has habitually claimed property rights and the courts have readily confirmed them. Whatever is stated in the guidance notes and essentially accepted by duty holders in relation to decommissioning, property law may say something different.
Pore space
For Lybster, whereas the hydrocarbons in the field are vested in the Crown and those rights are exercised by the NSTA, the pore space is the property of the Crown. Property rights would be exercisable by the CES. For the Forth Basin, the pore space would also be owned by the Crown and the property rights would be exercisable by CES. Note that this property law analysis also implies that CO2 injected into depleted reservoirs beneath the territorial sea would be owned by the Crown on the basis of the principle of annexation. This has been more fully explored in the context of enhanced oil recovery (Patterson & Paisley, 2016).
Shared jurisdiction
The exploration and production licensing for Lybster at the time would have been a matter for the Secretary of State. Even now, as the reservoir lies within the territorial sea, the oil licensing would be a matter for NSTA. However, the CO2 storage licensing is a matter for Scottish Ministers. The siting and operation of the drilling rig onshore would then and now be a matter for the local planning authority. Thus, both UK law and Scots law are engaged as appropriate.
The Beatrice field presents a most interesting problem. The residual hydrocarbons in the field remain vested in the Crown. The pore space within 12 nm is owned by the Crown. The ownership of pore space beyond 12 nm is not clear, but from a practical perspective only the Crown has sovereign rights to act. The licensing authority within 12 nm is Scottish Ministers, and, beyond the 12 nm, NSTA. This may be resolved by some form of arrangement modelled on those for hydrocarbon reservoirs that cross boundaries.
Summary
CO2 storage involves multiple activities under different licensing regimes. These need to be explored further by the Scottish Government to fully understand what will be necessary to put in to law for CO2 storage within Scottish waters. New regulations will be required; it may well be, however, that insofar as existing regulations could be relied upon, the process of modifying SSI 2011/24 and drafting consents could be fast. This would really be a question for those with a better insight into the technical detail and political due process.
Inshore storage
Scotland’s territorial waters cover an area of 55,480 km2 with the potential for inshore storage. This includes a great deal of seismic data – Figure 3. While the 2D seismic coverage is extensive, only three areas have 3D seismic: Lybster, Fraserburgh, and the Solway Firth. 3D seismic is the most effective data for accurately characterising subsurface structures (Dee, et al., 2005). In its absence, 2D data may identify structures of interest in cross-section. The Forth Basin area is covered by a 2D survey – Appendix C. The availability of data allows the prospective areas to be ranked by maturity – Table 3. The exploration ranking of Fraserburgh and the Solway Firth is explained in the description of the areas of interest that follows below.
Areas of Interest
Figure 3 presents areas of interest for inshore CO2 storage.
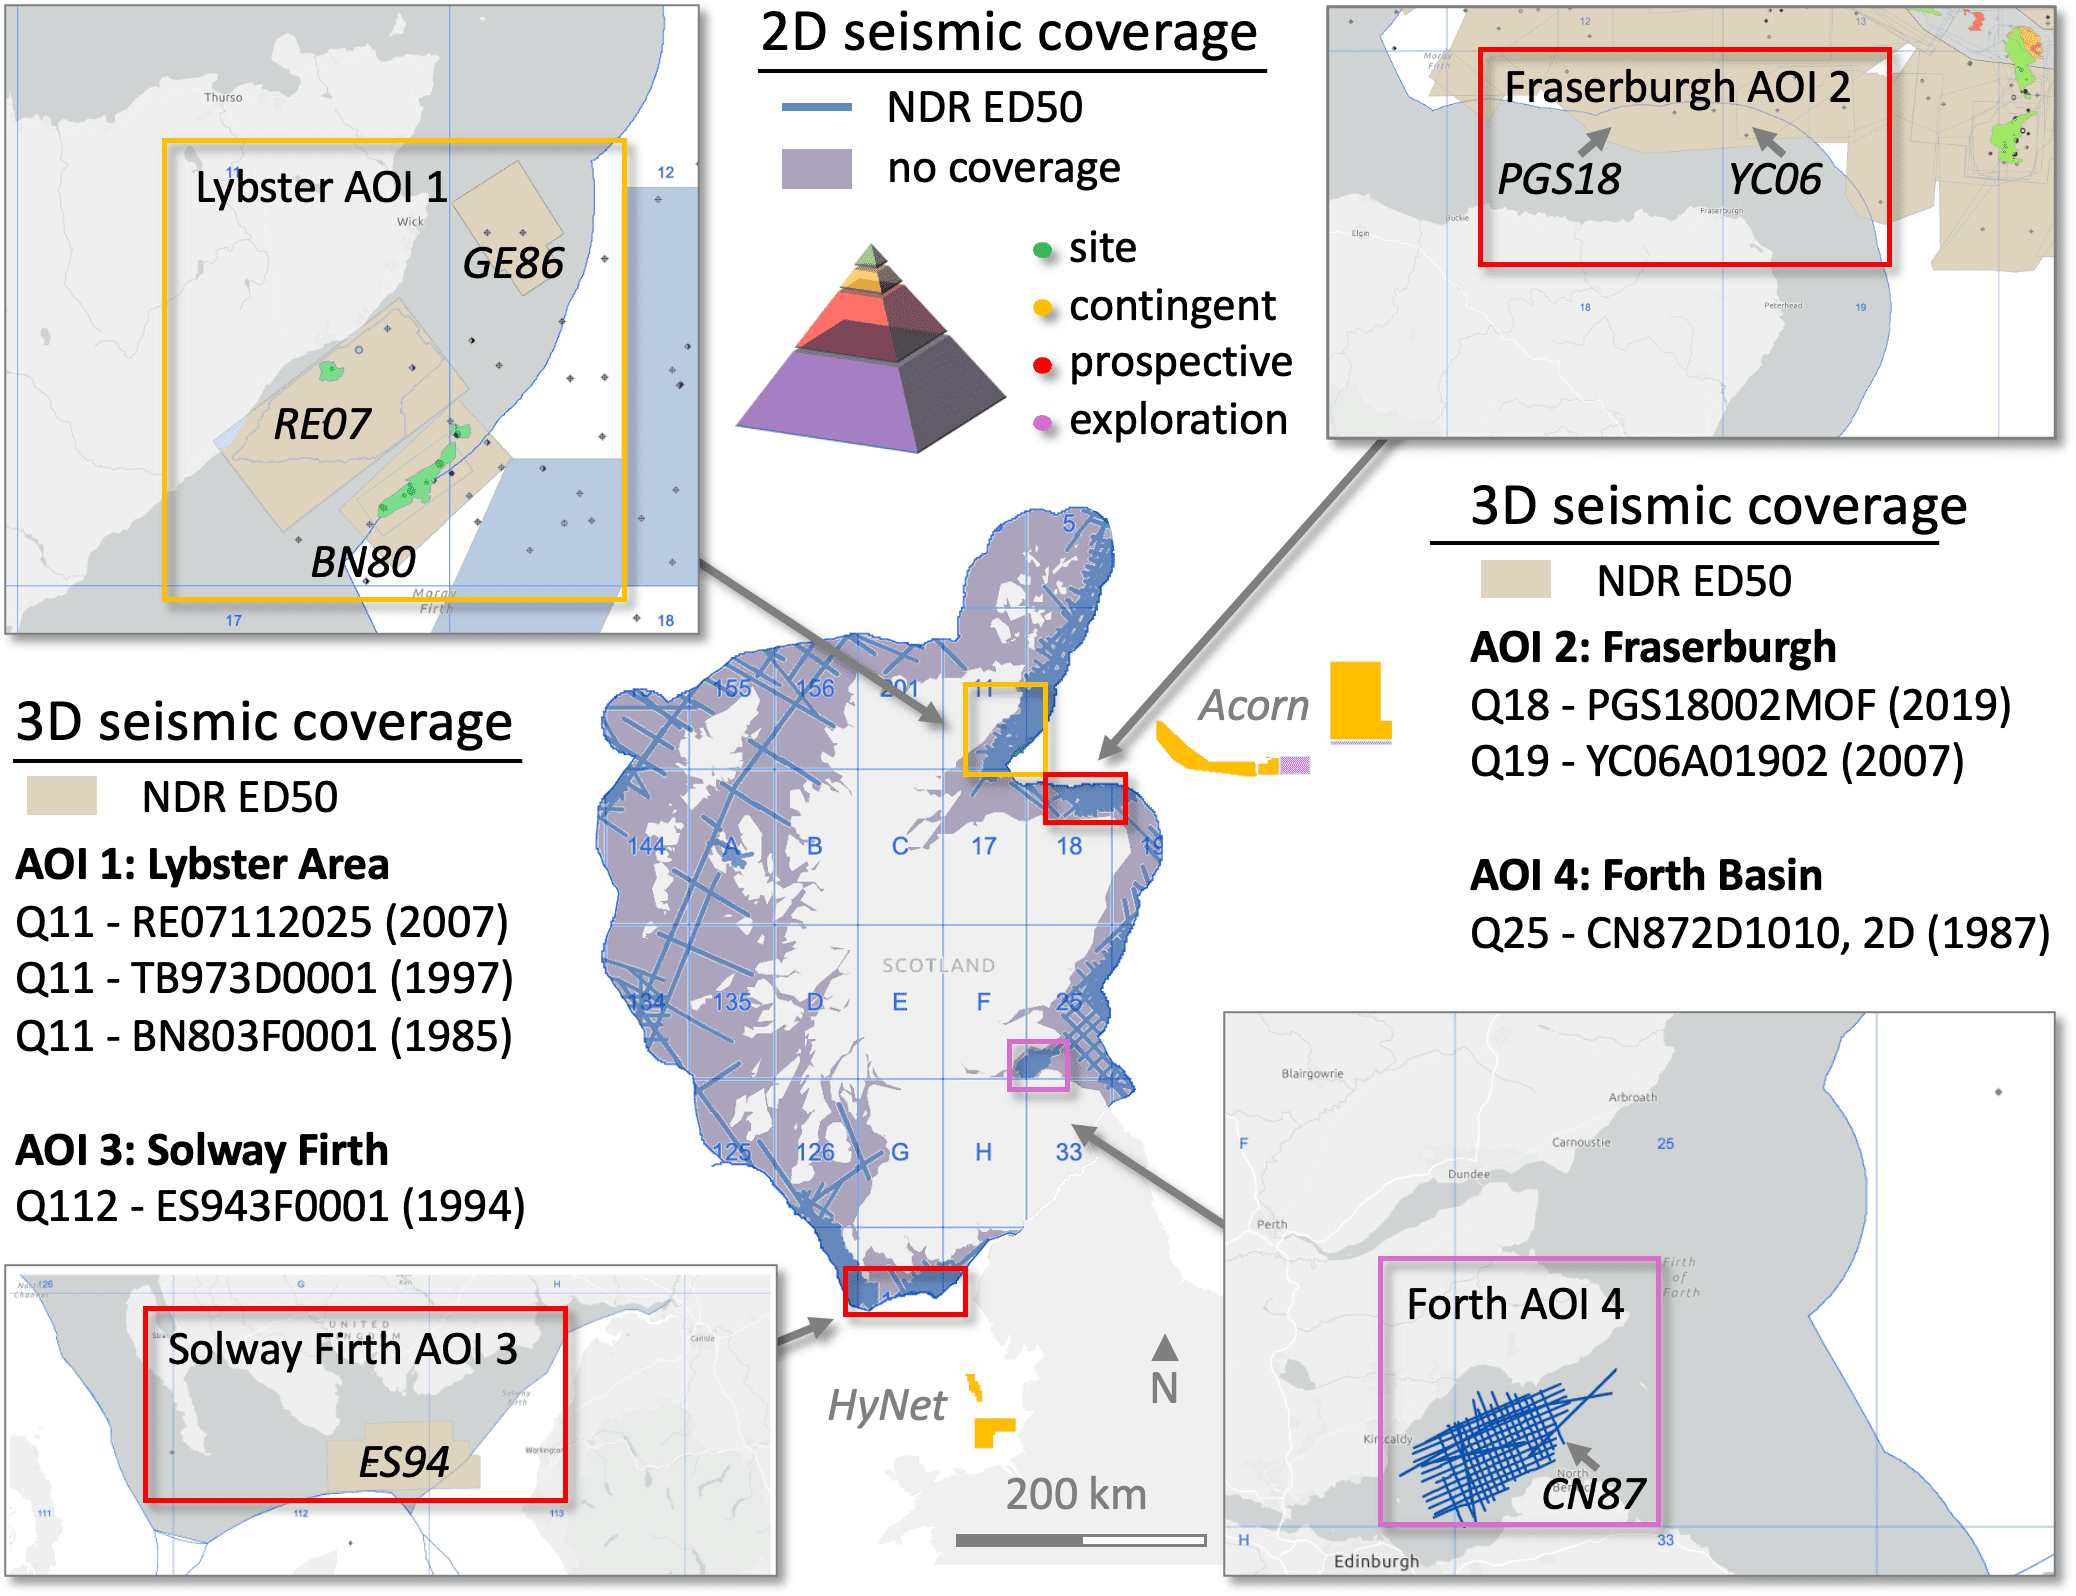
Figure 3. Areas of interest for inshore CO2 storage. Four areas are identified with seismic coverage and exploration well data – see Annex E for an inventory. Lybster has the best data coverage (contingent), followed by Fraserburgh and the Solway Firth (prospective), and the Forth Basin (exploration).
Table 3. Inshore areas of interest ranked by maturity and potential to progress rapidly.
|
Areas of Interest |
Area Name |
Seismic & Wells |
Maturity |
|---|---|---|---|
|
AOI 1 |
Lybster |
RE07 3D seismic + 5 wells + model |
Contingent |
|
AOI 2 |
Fraserburgh |
PGS18 3D seismic + 3 wells |
Prospective |
|
AOI 3 |
Solway Firth |
ES94 3D seismic + 2 wells |
Prospective |
|
AOI 4 |
Forth Basin |
CN87 2D seismic + 1 well |
Exploration |
Lybster Area
The Lybster oil field is ranked as contingent on the maturity pyramid where the maturity progresses from an exploration resource (large base) to a commercial reserve of sites (small top) via contingent prospects – Figure 3. The area of interest encompasses 306 km2 that include the field and exploration structures, Knockinnon and Braemore.
Two more oil fields, Beatrice and Jacky, are located at the 12 nm limit. Lybster is notable for three reasons: its proximity to the coast; a substantial amount of data and analysis; and an existing production well. These significantly reduce the potential cost and timeline to developing a storage site. The field needs to be screened for capacity and suitability to qualify the field for appraisal licensing. The initial capacity estimate and assessment of suitability are documented in Section 4.2, supported by Appendix D.
Knockinnon and Braemore are relatively immature with respect to storage analysis but noteworthy for potentially providing step-out capacity to Lybster. Beatrice has not been assessed for this report as the field is beyond a presumed technical limit for onshore development via extended reach wells. 12 nautical miles is equivalent to 22 km; the 2022 record for an extended reach well is 15 km. A reasonable economic limit of 10 km has been set for assuming offshore development. Beatrice, the largest field in the area, straddles the 12 nm boundary. Jacky is a small satellite field in territorial waters to the north of Beatrice.
Fraserburgh & Solway Firth
Both areas have 3D seismic survey coverage and exploration wells. The location of the 3 wells and seismic for Fraserburgh, approximately 16-20 km from shore, would require an offshore installation (pipeline, injection well, and monitoring equipment). Any prospects within the area would need to be identified from the existing seismic and well data and screened for suitable reservoir injectivity and caprock seal properties prior to appraisal licensing.
The Solway Firth area has two exploration wells and a 3D seismic survey in the southern half of the 12 nm territorial waters. One of the wells is within the seismic survey area. The location of the seismic and well 13 km from shore would require an offshore installation (pipeline, injection well, and monitoring equipment). As with Fraserburgh, prospects within the area would need to be identified from the existing seismic and well data and screened for suitable reservoir injectivity and caprock seal properties prior to appraisal licensing. As such, both areas are ranked as prospective on the maturity pyramid.
Forth Basin
The Forth Basin is close to a diverse cluster of bio-CO2 sources located in the Central Belt. The Forth was screened for prospective storage sites as part of the CASSEM project (SCCS, 2012). Trap structures were identified but rejected due to a lack of well data and poor control on the 2D seismic interpretation for caprock thickness and reservoir volume (Monaghan et al., 2012). The Forth also contains a large basin, the Leven syncline. The syncline may be suitable for an alternative strategy of CO2-brine surface mixing and injection of the CO2-rich mixture which is denser than the syncline’s porewaters (Eke et al., 2011). This approach to storage is examined in section 2.3. The low TRL of dissolved CO2 injection and need to mature the concept for the Forth Basin rank this area as exploration.
Lybster prospect
Lybster was drilled in 1996 just 3 km off the Caithness coast – Figure 4. Lybster is 3 km from the coast, with a vertical offshore discovery well, 11/24-1 (1996), onshore extended reach appraisal well, 11/24-3 (2008), 3D seismic coverage, and a reservoir model.
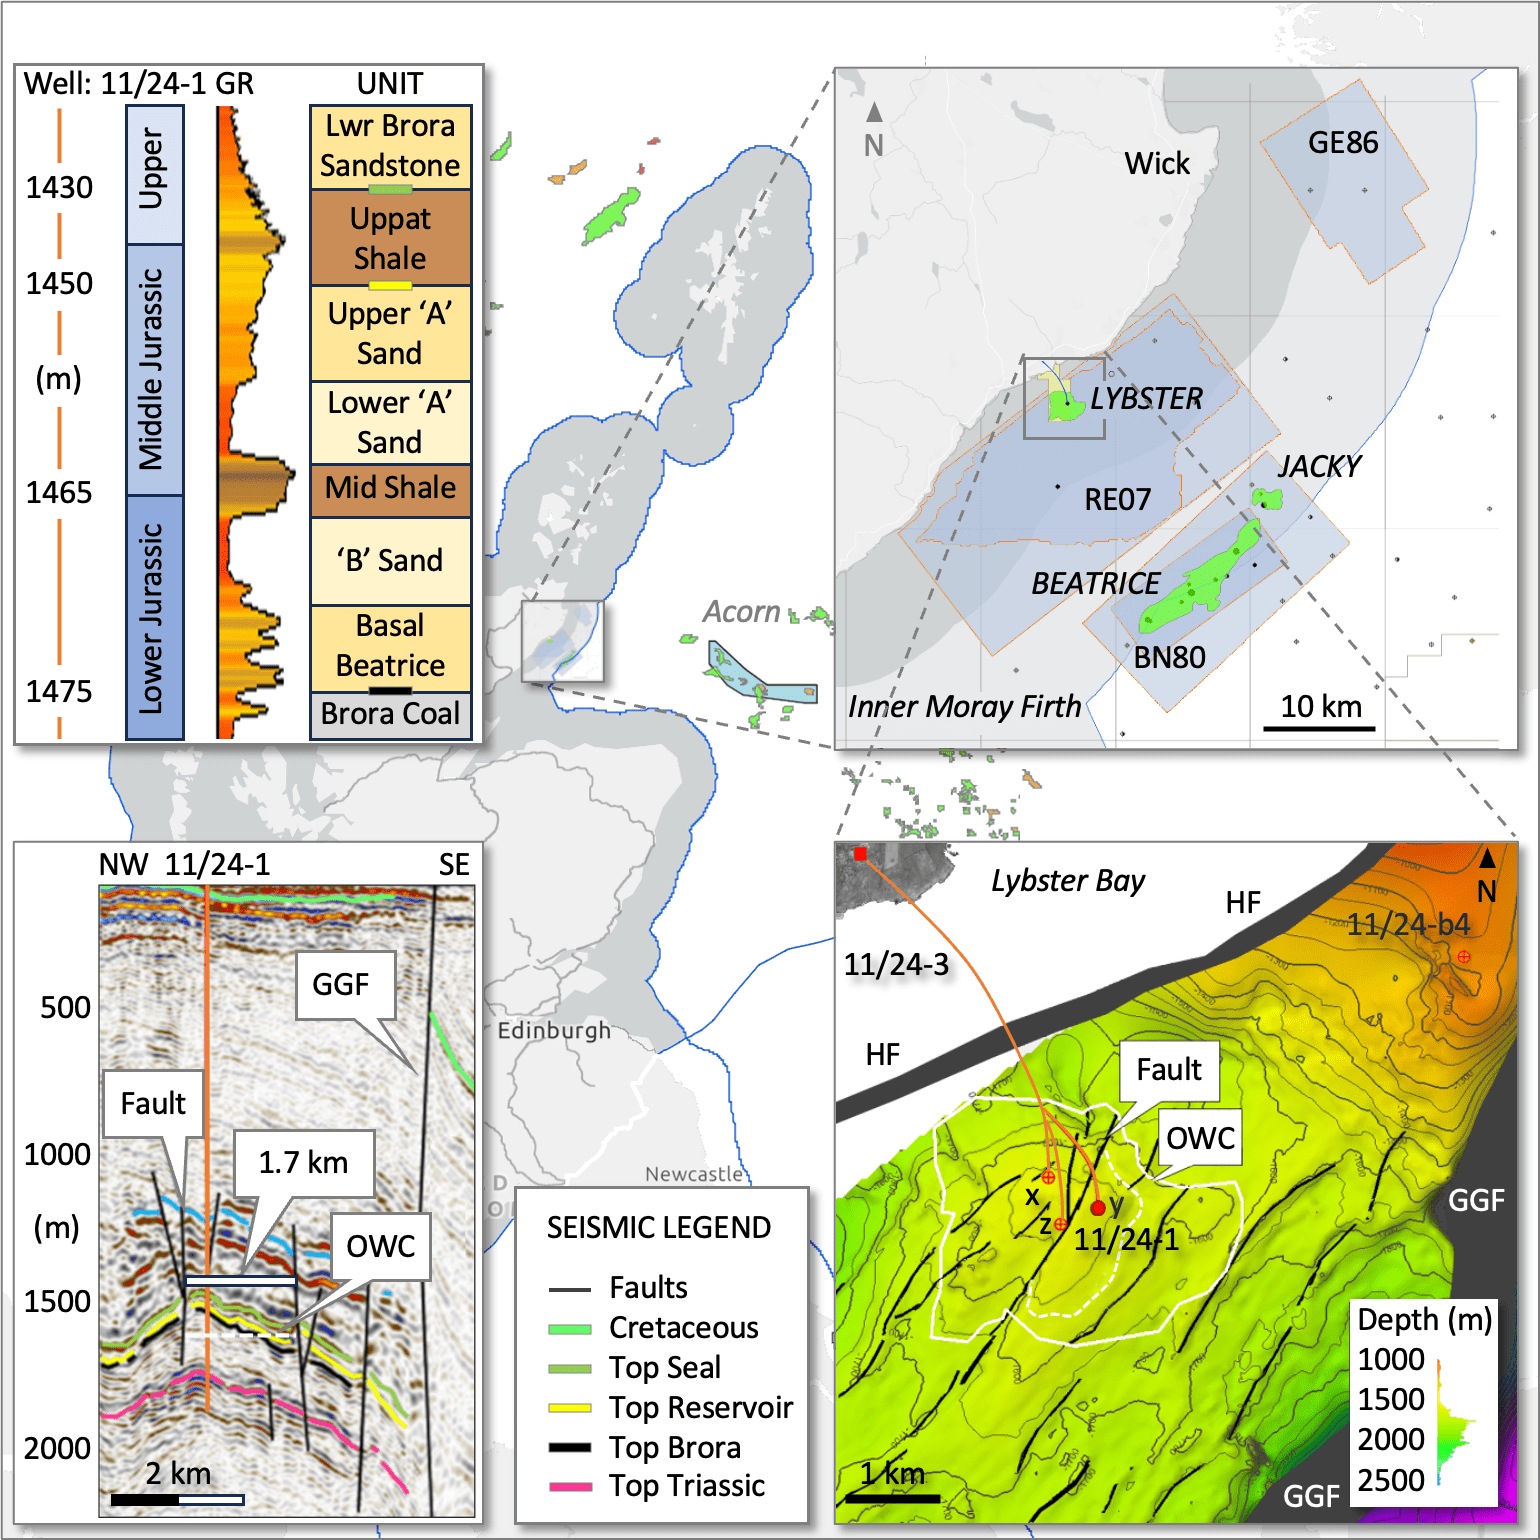
Figure 4. The Lybster prospect location, associated reservoir model, seismic section and well data.
The model (Figure 4, bottom right) is constructed from 3D seismic data (Figure 4, bottom left) and well data (Figure 4, top left). The field has two high quality reservoir units, the lower ‘A’ and ‘B’ sands, separated by a baffle, the mid-shale, and capped by the Uppat Shale seal. The field is divided into two halves by a fault that strikes NE-SW. Several small faults occur between the regional Great Glen Fault (GGF) and Helmsdale Fault (HF).
The discovery well for Lybster was plugged and abandoned. The field was then drilled from the shore in 2008 via a 3 km extended reach well; the only offshore UK field to be produced this way. Most North Sea fields are much further offshore. This makes Lybster an accessible and low-cost storage prospect that requires no expensive infrastructure. If suitable, the suspended production well could be repurposed for CO2 injection.
Lybster is a four-way closure, or small 6 km2 dome, that has trapped oil and gas beneath a mudstone caprock for tens of millions of years. This is a good indication of suitability for storing CO2. The structural volume or space available for storage is calculated from known properties of the field such as reservoir area, thickness, porosity, and fluid properties such as CO2 density at reservoir conditions. The expected capacity is 2 Mt, (low-high range: 0.3-9 Mt).
An appraisal licence requires an early risk assessment (ERA) to formally establish the expected capacity and technical suitability of a suite of attributes ranging from seal and reservoir quality to fault geomechanics, lateral migration risk, legacy wells, and more. The ERA is a gap analysis that identifies further data requirements and potential issues to address in the ‘Assess and Define’ phases of an appraisal term for a storage licence. A first-look analysis follows below.
Storage analysis
At least two attributes of the Lybster field require further analysis as part of an early risk assessment. Firstly, the production history deviated from expectations – Figure 5. Increasing gas and water cuts within a matter of months and declining oil production resulted in a well workover and then suspension. A dynamic reservoir model is needed to explain these outcomes and fully understand the flow and containment of fluids within the structure.
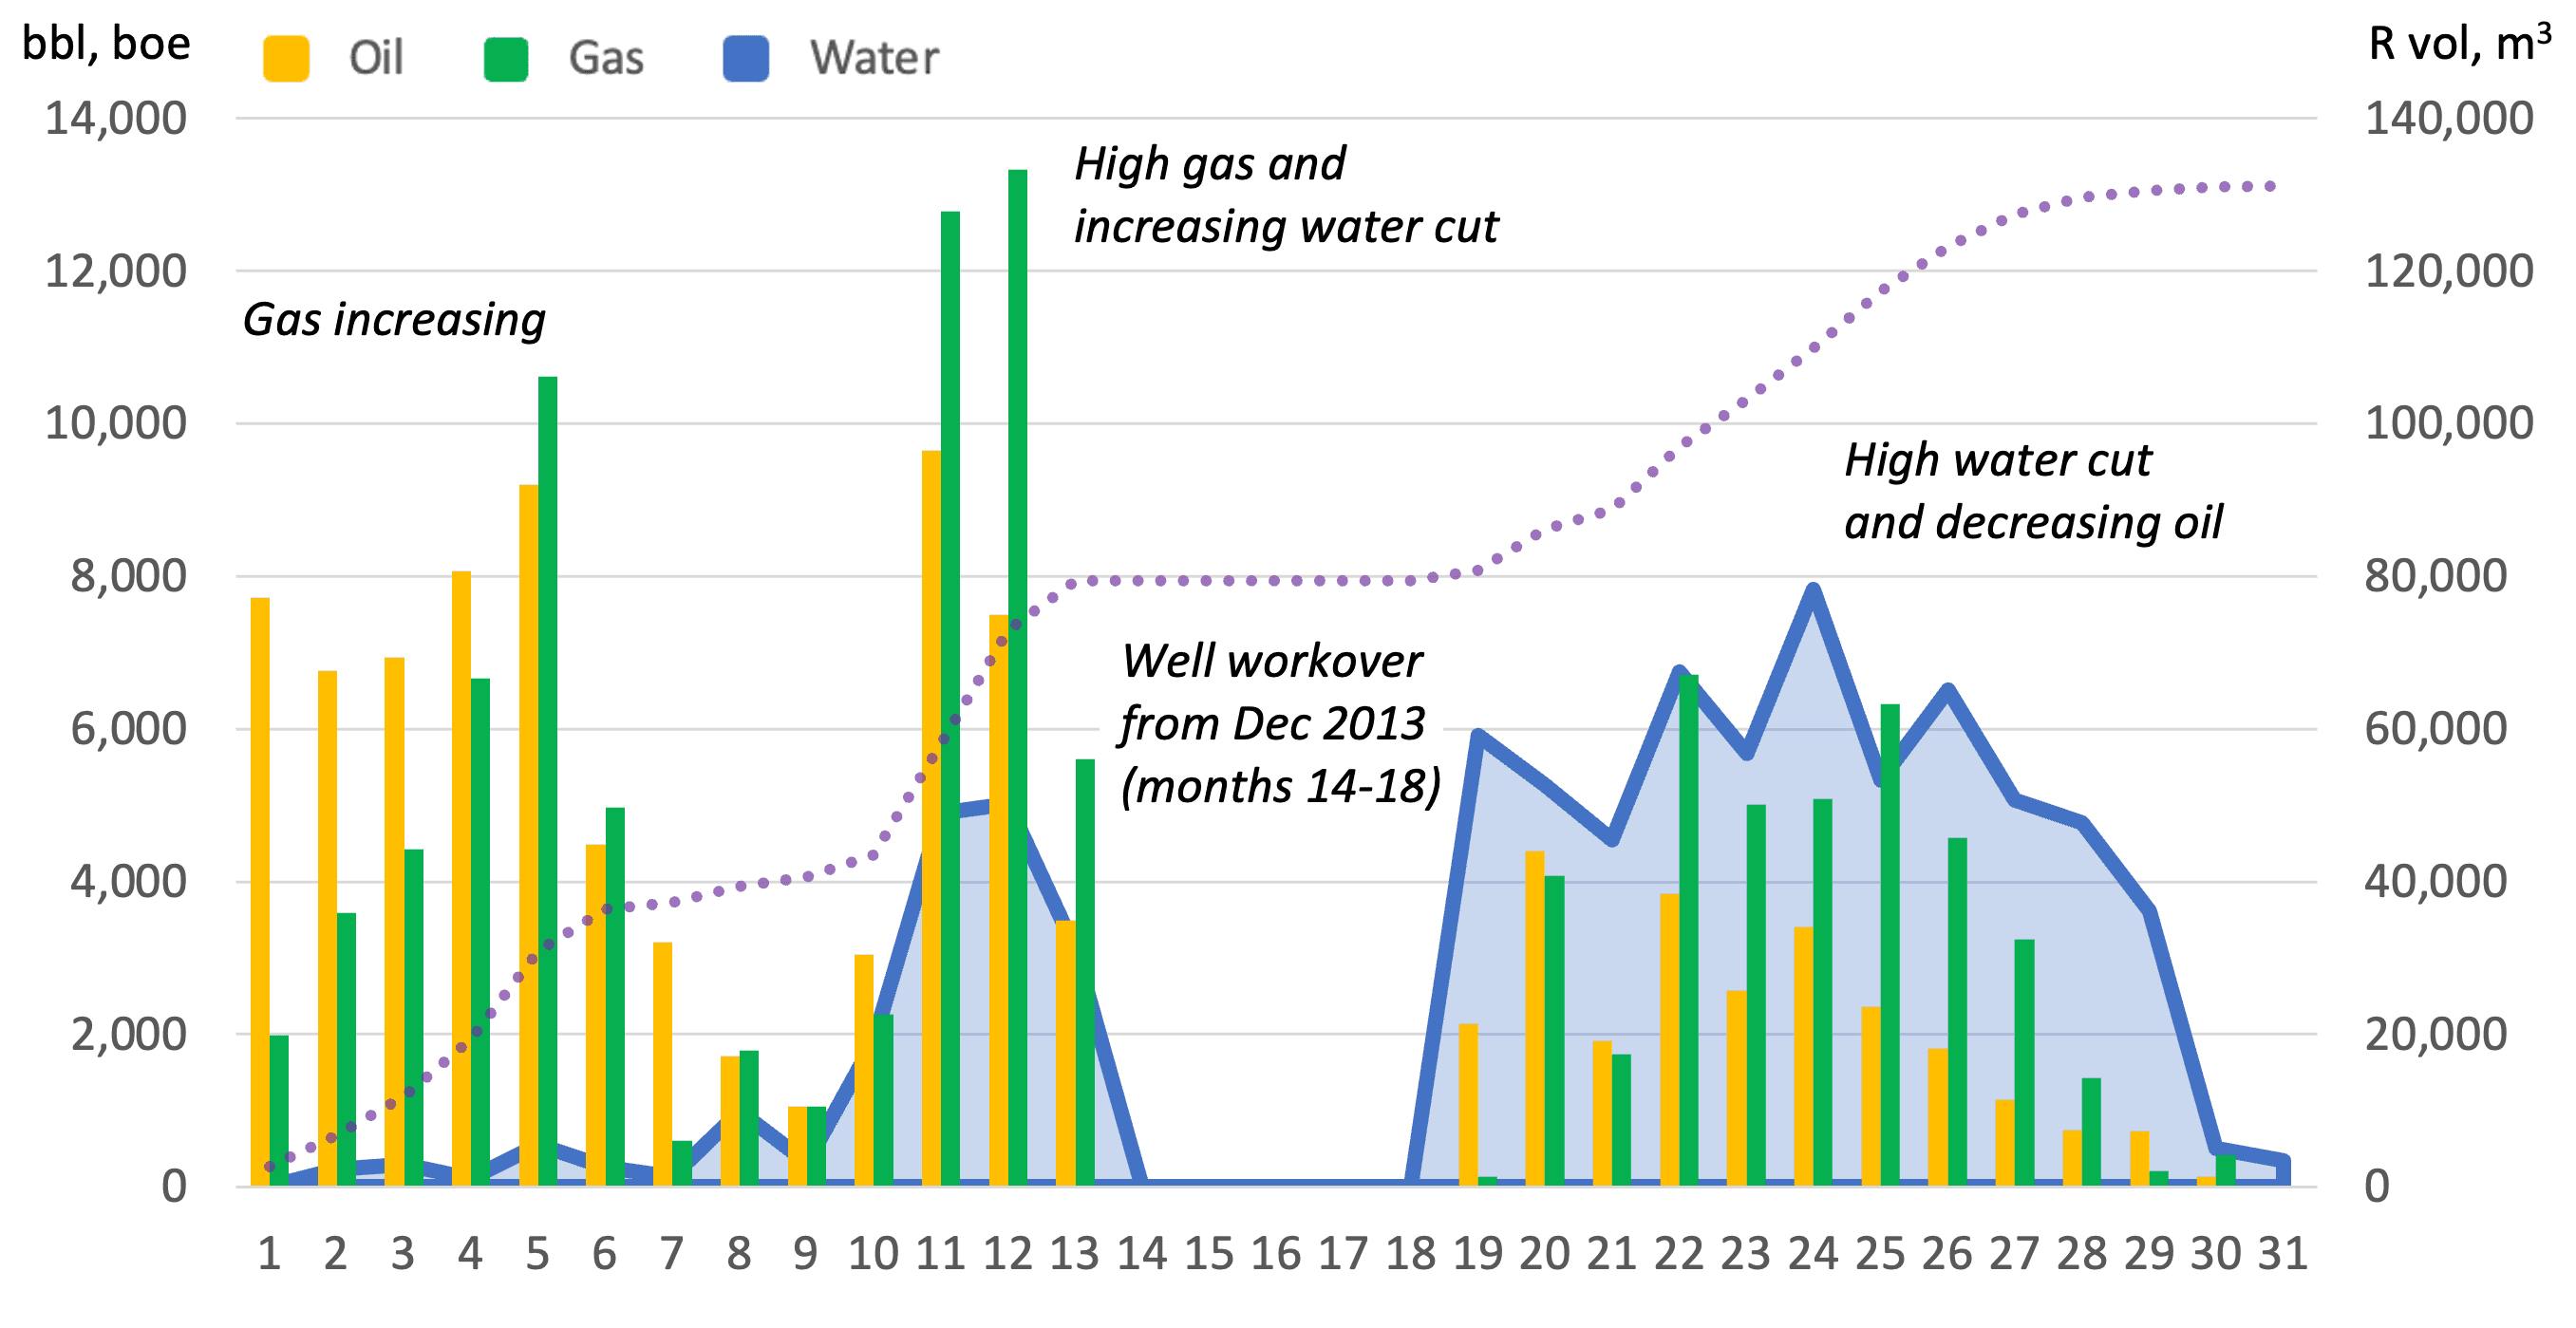
Figure 5. Production history in barrels of oil, water, equivalent gas, and produced reservoir volume.
Secondly, the field is located between two large faults, the Helmsdale Fault and Great Glen Fault, and has several smaller faults within the field boundary that segment the reservoir. These require a detailed geomechanical study to de-risk the prospect – Appendix F.
Capacity: The expected capacity of Lybster, based on the structural volume, is 2.1 Mt of CO2. – Table 4. This reasonable mid-range value assumes just half the field area, 3 km2, and an average reservoir thickness of 15 meters. A storage area of 3 km2 assumes the main fault for the field is sealing and CO2 storage is restricted to half the mapped field area. The full field area, 6.11 km2 (NSTA estimate), effectively doubles the capacity for mid-range values.
Combining the full-field area with high-range values for the other five variables quadruples the capacity. The full field area and high-range values for all variables furnishes an optimistic maximum capacity of 9.4 Mt. The low estimate, a pessimistic 0.35 Mt, uses low range values and halves the expected area again. The highly conservative minimum estimate of 100 kt is based on the produced volumes of oil, gas, and water.
Qualifying adjectives for capacity are as follows: ‘minimum’ is the lowest value calculated, a highly conservative production volume estimate. The structural volume estimates are defined as ‘low, ‘mid’, and ‘high’, based on reasonable range estimates for six variables; the dominant variable is the storage area. Note that while the outcomes resemble the common P90-P50-P10 approach, the data is too sparse to support a statistical analysis. This simply reflects the field’s short production history. The two methods are summarised in Appendix H.
Table 4. Structural volume variable range and applied values for capacity estimates
|
Variable |
Range |
Low, 0.35 Mt |
Mid, 2.1 Mt |
High, 9.4 Mt |
|---|---|---|---|---|
|
Storage area |
1.5 – 6 km2 |
1.5 |
3 |
6 |
|
Net thickness |
5 – 25 m |
9 |
15 |
21 |
|
Porosity |
8 – 22% |
0.11 |
0.15 |
0.19 |
|
Net to Gross |
56-80% |
0.6 |
0.68 |
0.76 |
|
CO2 Density |
700-750 kg/m3 |
710 |
725 |
740 |
|
Saturation |
50 – 75% |
0.55 |
0.625 |
0.70 |
Discussion
The Lybster field area has been intensively studied – Appendix H. While this report relies on Keenan’s detailed analysis of reservoir attributes such as porosity (Keenan, 2023), it corrects for the field area which was underestimated by an order of magnitude. The 2 Mt outcome is reasonable when compared to traps with a similar area such as Sleipner, Norway.
The alternative analysis, presented by Watt (Watt et al., in preparation), assumes a replacement volume for produced fluids. While this is a common approach to the capacity assessment of mature depleted fields such as Viking and Hamilton (Track-1 and Track-2 storage sites), the outcome is highly conservative for Lybster, a field with an unusually short production history. We favour the structural volume as a more reasonable indication.
The suite of suitability attributes also supports Lybster as a strong candidate for a licenced storage appraisal – Figure 6. This will apply the rigour necessary to mature the attribute scores from speculative to verified or identify gaps for further analysis. Our recommendation is that an appraisal licence include studies on fault integrity, geomechanics, and reservoir simulation.
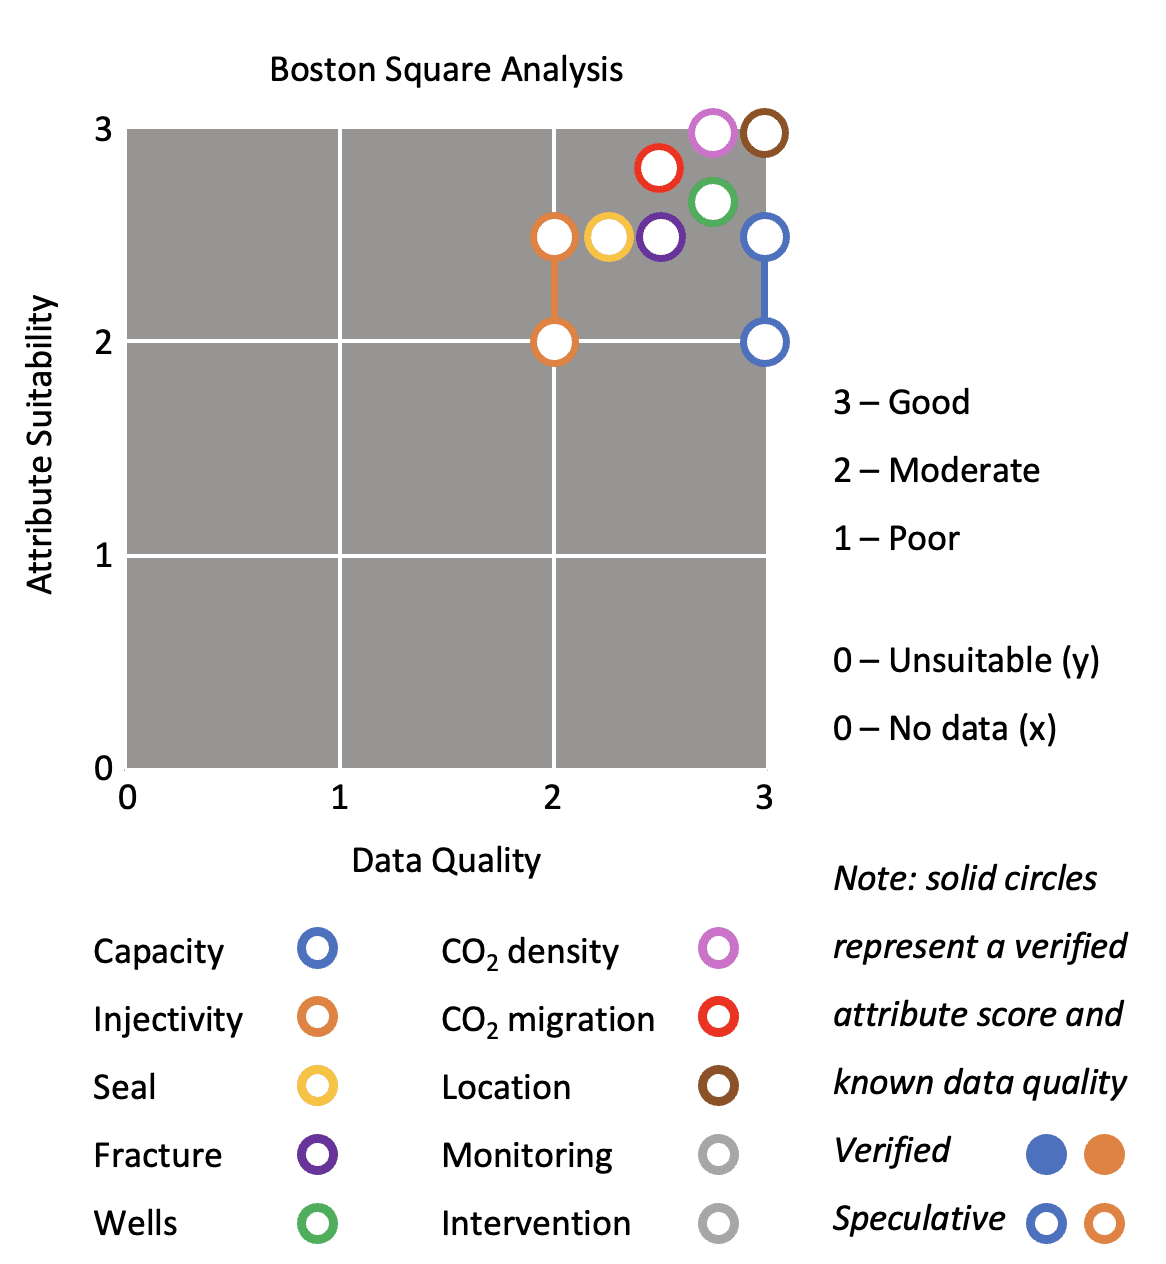
Figure 6. Boston Square analysis of attribute suitability for Lybster. A Boston Square is a simple scheme for scoring expert judgement from 1 to 3 devised by the Boston Consulting Group.
Forth Basin
The Forth Basin contains the Leven syncline, a geological structure in the Forth Estuary mapped on 2D seismic – Figures 7 and 8. Most proposals for CO2 storage assume injection of liquid CO2. This requires a geological seal above the reservoir to trap its buoyant rise. However, it is also possible to inject dissolved CO2 with large volumes of water, where the CO2-saturated water is denser than the porewater and sinks rather than rises. Research at the BGS and the University of Edinburgh shows that suitable geology to retain sinking dense CO2 may exist beneath the inshore waters of the Forth Estuary (Smith et al, 2011).
CO2-brine surface mixing
The CO2-brine dissolution approach was extensively modelled by Eke et al. (2011) and became a commercial reality in 2014 with the industrial-scale injection of 7 ktpa of CO2 from the Hellisheiði power plant, Iceland. While the physical limit for CO2 dissolution is 50 kg/m3, optimal chemical and physical parameters are controlled in the surface process facility. For Iceland, the outcome is 20 kg of dissolved CO2 per cubic meter of injected brine. This increases the volume of injected fluid by about 35x compared to a pure CO2 injection project like Sleipner. Reservoir pressure increases are minimised by extracting brine from the reservoir for mixing and return. This has worked for Iceland, with injection recently increasing from 7 ktpa to 12 ktpa. Future plans will scale to 40 ktpa before 2030. However, the geological setting, densely fractured young volcanic rocks, is quite different from the Leven Syncline.
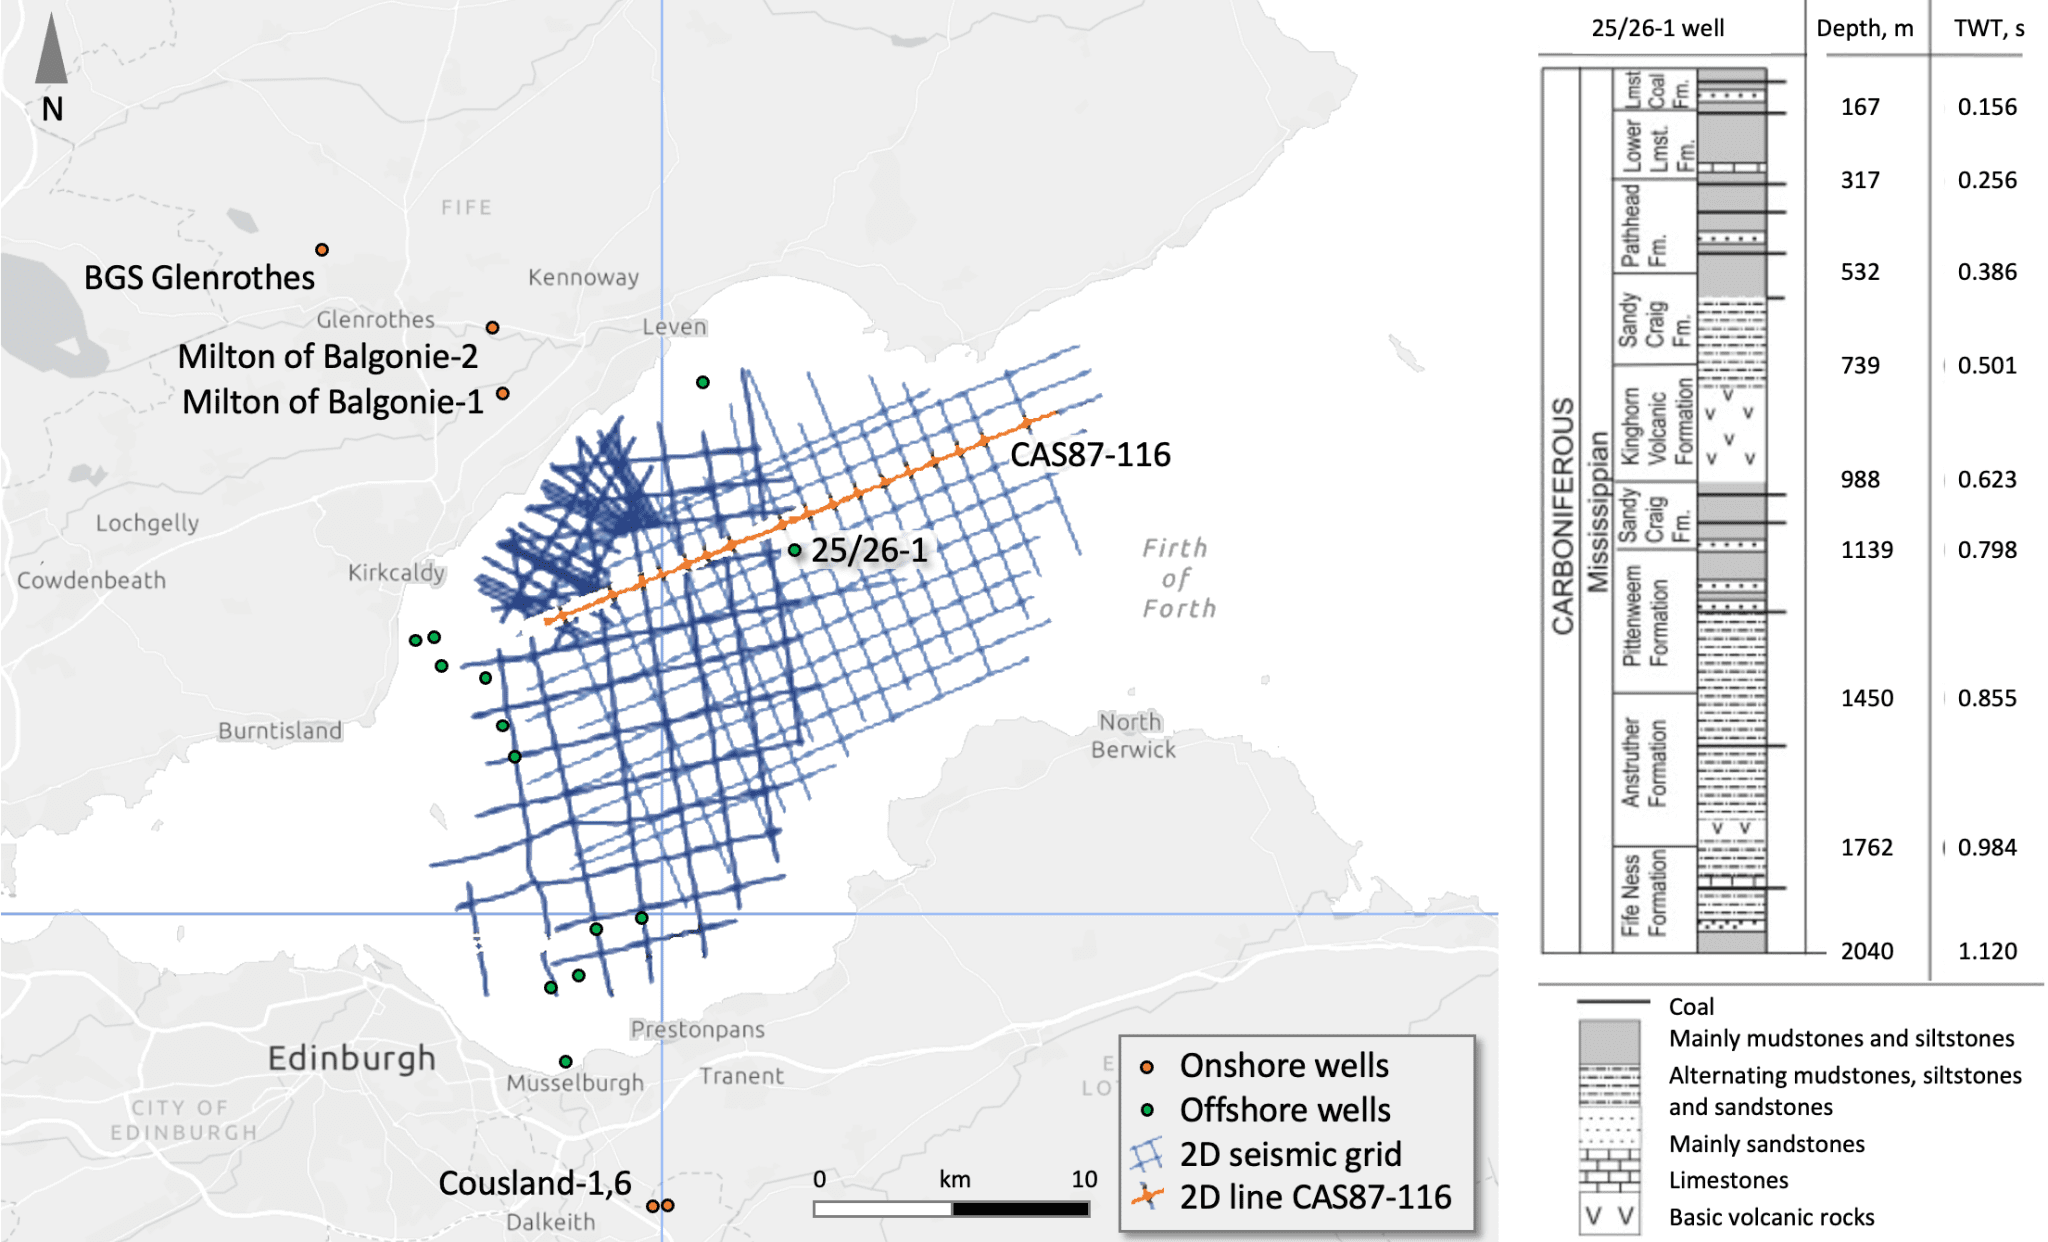
Figure 7. Forth Basin, location of 2D seismic data grid, interpreted line and exploration well 25/26-1.
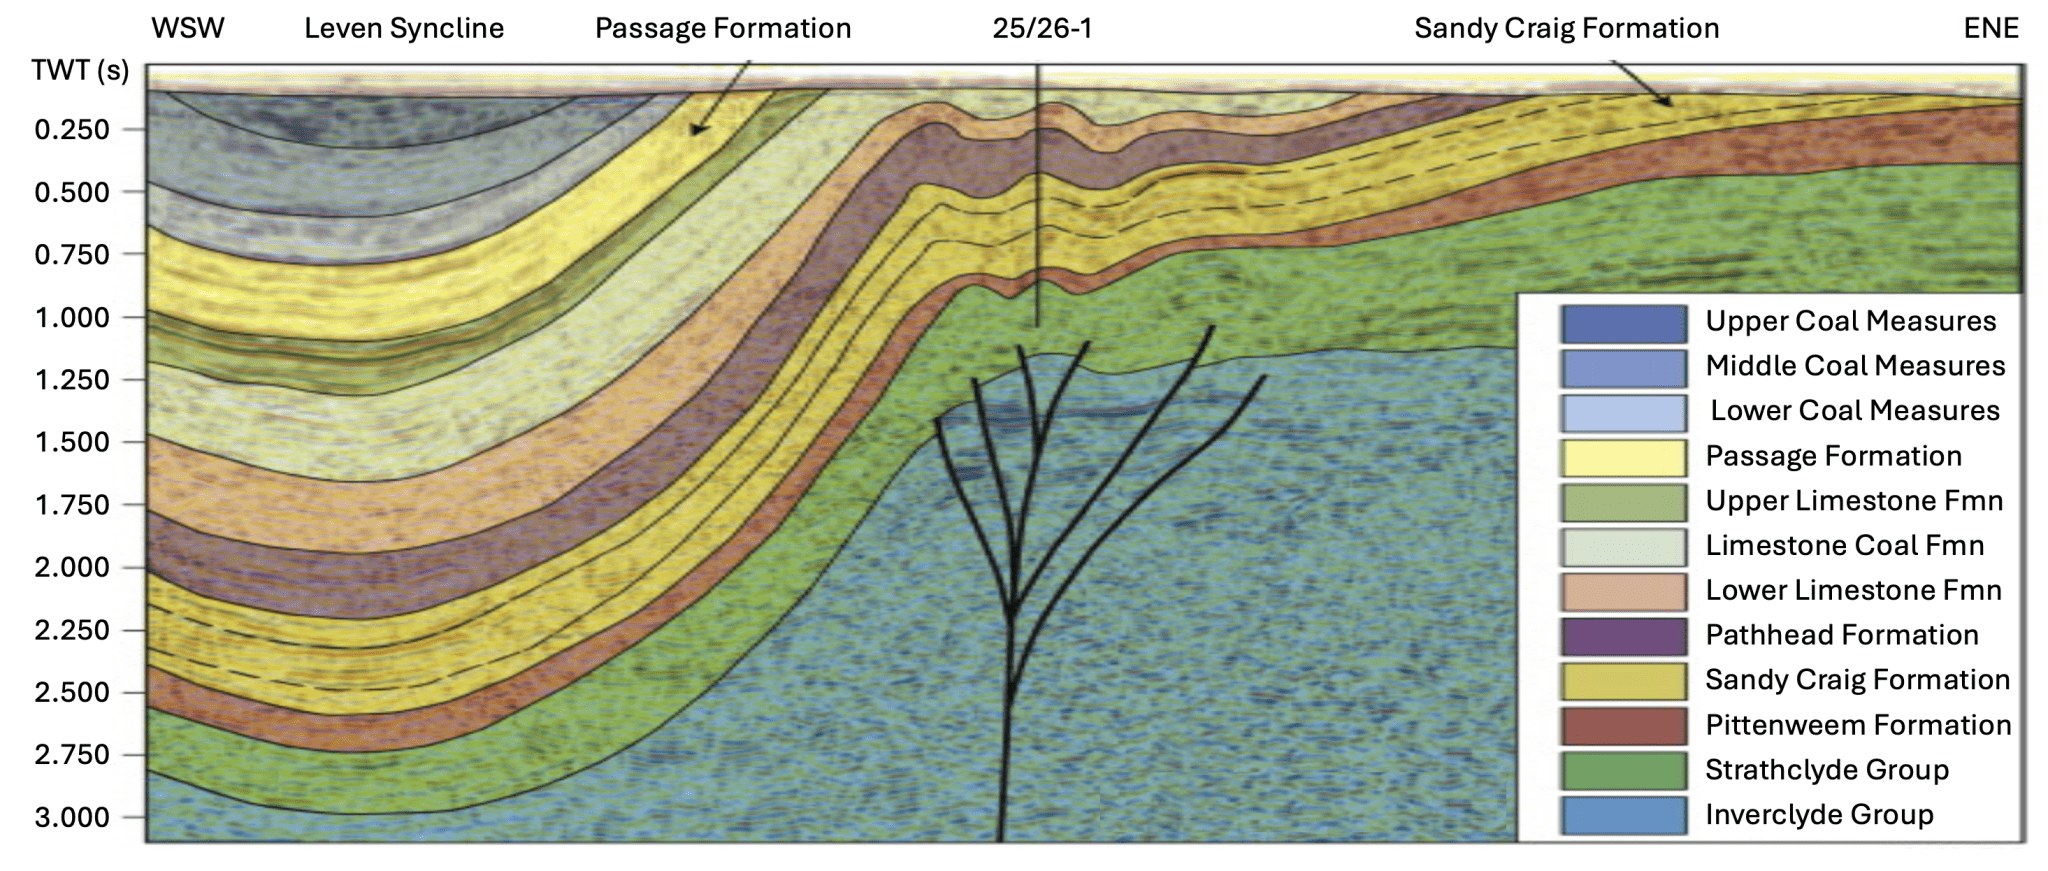
Figure 8. 2D seismic line CAS87-116, revealing the stratigraphy and structure of the Leven Syncline.
Suitability
The high volumes of brine injection associated with dissolved CO2 storage require a simple combination of a large regional aquifer with good reservoir quality and low structural complexity. The aquifer needs to provide a sufficient volume to help minimise pressure increases. Reservoir quality also minimises pressure increases. This implies above average porosity and permeability and thick continuous beds of high net-to-gross sandstones. Low structural complexity implies a simple geometry with a small number of faults that are transmissive, i.e. open to the lateral flow of brine, allowing the dissipation of injected fluids. These attributes are not clearly established for the Leven syncline – Figure 9.
A detailed analysis of the area (Monaghan et al. 2012) noted the poor data quality, lack of reservoir data, and structural complexity. These attributes are reflected in the low TRL status of the Forth Basin prospect.
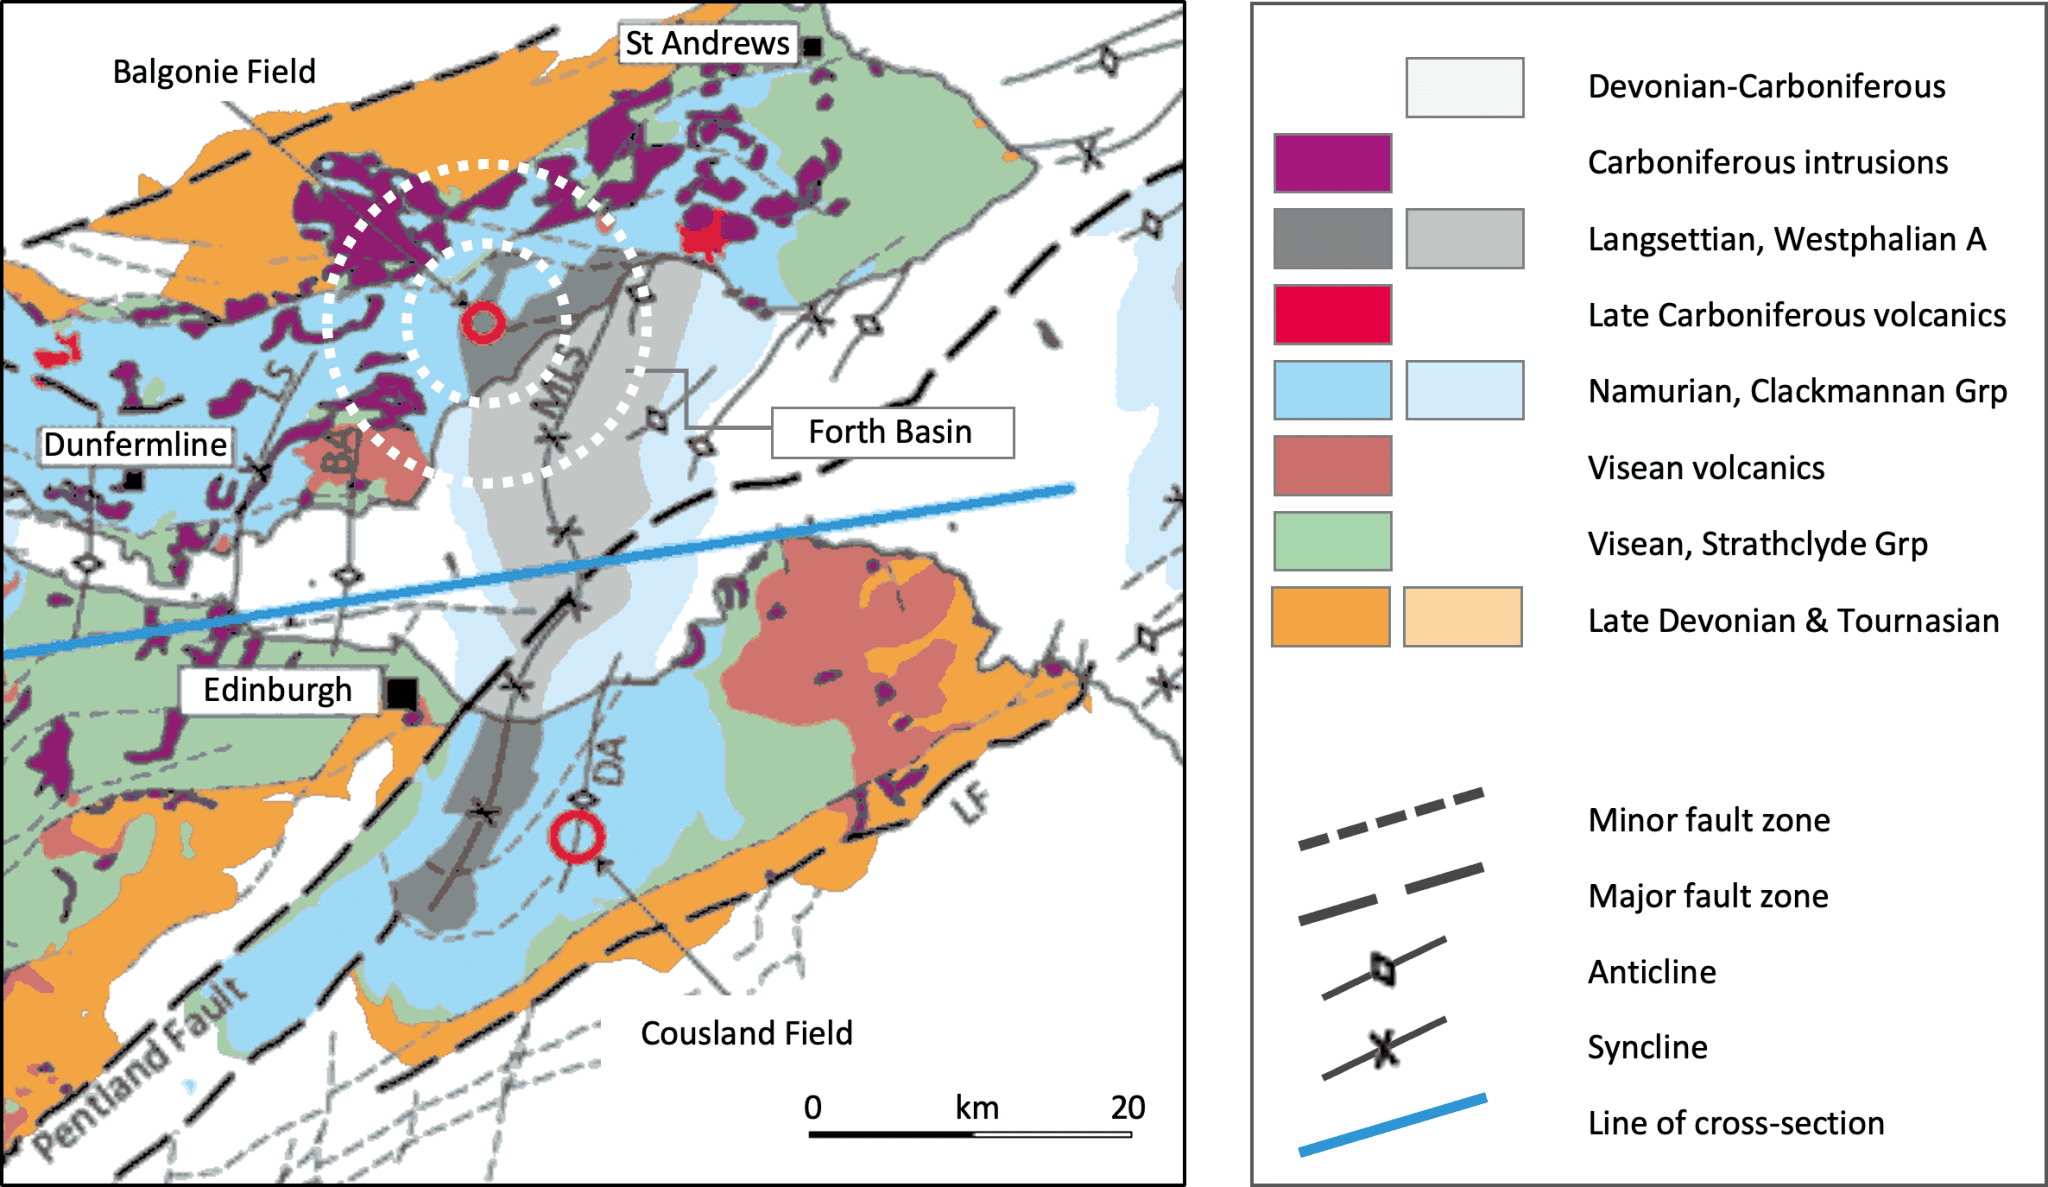
Figure 9. Forth Basin area regional geology, indicating the stratigraphic and structural complexity.
Sources of bio-CO2
Our analysis of over a hundred sources of bio-CO2 in Scotland produced a database of 98 sites with emissions that range from 3 to 360 ktpa – Figure 10. Four small distilleries, 1.6-2.8 ktpa, are included as these have already been selected for bio-CO2 capture. The total resource is 3.7 Mtpa. Almost all the sources, 91 sites, are grouped into five regional clusters – Figure 11.
Categories and Sectors
We have categorised the sources based on capture method: combustion, 89%, and separation, 11%. Separation at distilleries and anaerobic digesters is low-cost and high purity relative to post-combustion flue gas capture. The two categories are then split by process into nine sectors.
Biomass
Biomass, the largest sector at 46%, produces CO2 from the combustion of plant and animal waste. Biomass is often configured as combined heat and power (CHP). The 18 facilities in the database produce an average of 95 ktpa and total 1.7 Mtpa. The six largest sites, 150-360 ktpa, include Markinch, Steven’s Croft, and Morayhill. This accounts for 900 ktpa of bio-CO2 emissions. The smallest site, Gleneagles, emits 7 ktpa. Locations tend to be semi-rural.
Energy from Waste
Energy from Waste (EfW), the second largest sector, 29%, produces electricity and heat from the incineration of municipal waste, often in a CHP configuration. Roughly half of the emissions are bio-CO2 (Tolvik, 2024). The 13 sites emit a total of 1.1 Mtpa, average 84 ktpa. The five largest are amongst the top ten sources, total 0.6 Mtpa, average 126 ktpa. The largest, South Clyde Energy Centre, 158 ktpa, is planned for 2025. The smallest site, Binn, 38 ktpa, opens in 2026.
Anaerobic Digestion
Anaerobic digestion (AD) covers a range of dry and wet waste applications that produce raw biogas. AD tends to be small, with 39 sites in the database accounting for 0.5 Mtpa of bio-CO2, average 13 ktpa. The largest site, 44 ktpa, is the Girvan distillery. The smallest site, Crofthead farm, 3 ktpa. We identify five sectors where biogas is combusted on site:
- AD Landfill is the fourth largest sector overall after biomass, EfW, and distillery fermentation, with 18 facilities producing a total of 0.18 Mtpa, average 10 ktpa.
- AD Industrial is the second largest AD sector with 7 facilities producing 0.17 Mtpa, average 25 ktpa. Sites include distilleries, breweries, and pharma manufacturing.
- AD City Waste is the third largest AD sector with 6 facilities producing 0.08 Mtpa in total, average 14 ktpa. Sites process municipal wet streams such as food waste.
- AD Farming is the fifth largest AD sector with 6 facilities producing 0.04 Mtpa in total, average 7 ktpa. Sites process wet streams such as crop waste and silage.
- AD Sewage is the smallest bio-CO2 sector, with just 2 facilities in the database producing 0.02 Mtpa in total: Seafield, 16 ktpa, and Nigg, 8 ktpa.
Distillery Fermentation
Whisky distilleries produce CO2 during the mash fermentation stage. The CO2 can be easily separated using a simple wash process where pressurised water acts as a solvent. This generates a pure CO2 stream. Distillery fermentation (DF), 10%, is the third largest sector after biomass and EfW, with 20 sites producing 0.35 Mtpa in total, average 18 ktpa.
The three largest distilleries account for 0.2 Mtpa, average 66 ktpa; the remaining 17 sites account for 0.16 Mtpa, average 9 ktpa. The database includes four small distilleries: Tomatin, Speyburn, Tullibardine, and Balmenach, 1.6-2.8 ktpa. These are shortlisted along with Invergordon and North British for commercial bio-CO2 capture and storage (CCSL, 2024). Many of the 20 sites are located around Speyside as part of the Inverness cluster.
AD upgrading
AD biogas can be upgraded to biomethane by separating out the CO2 using a membrane filter. The biomethane is frequently sold directly into the natural gas grid. As with distilleries, this also generates a low-cost and high-purity stream of bio-CO2. AD upgrading is the seventh largest sector overall, 2%, with eight sites producing 0.07 Mtpa in total, average 8 ktpa. Sites include farms and industrial facilities located in semi-rural areas across the country.
Table 5. Bio-CO2 sources by sector. Note: the lowest cost sectors are highlighted in grey.
|
Sector, Bio-CO2 |
Category |
Sites |
Average |
Range, ktpa |
Total |
3.7 Mtpa |
|---|---|---|---|---|---|---|
|
Biomass |
Combustion |
18 |
95 ktpa |
7-360 |
1.70 Mtpa |
45.8% |
|
Energy from Waste |
Combustion |
13 |
84 ktpa |
38-158 |
1.10 Mtpa |
29.4% |
|
Distillery Wash |
Separation |
20 |
18 ktpa |
2-75 |
0.35 Mtpa |
9.52% |
|
AD Landfill |
Combustion |
18 |
10 ktpa |
4-32 |
0.18 Mtpa |
4.93% |
|
AD Industrial |
Combustion |
7 |
25 ktpa |
6-44 |
0.17 Mtpa |
4.67% |
|
AD City Waste |
Combustion |
6 |
14 ktpa |
6-24 |
0.08 Mtpa |
2.20% |
|
AD Upgrading |
Separation |
8 |
8 ktpa |
4-17 |
0.07 Mtpa |
1.76% |
|
AD Farming |
Combustion |
6 |
7 ktpa |
3-12 |
0.04 Mtpa |
1.08% |
|
AD Sewage |
Combustion |
2 |
12 ktpa |
8-16 |
0.02 Mtpa |
0.65% |
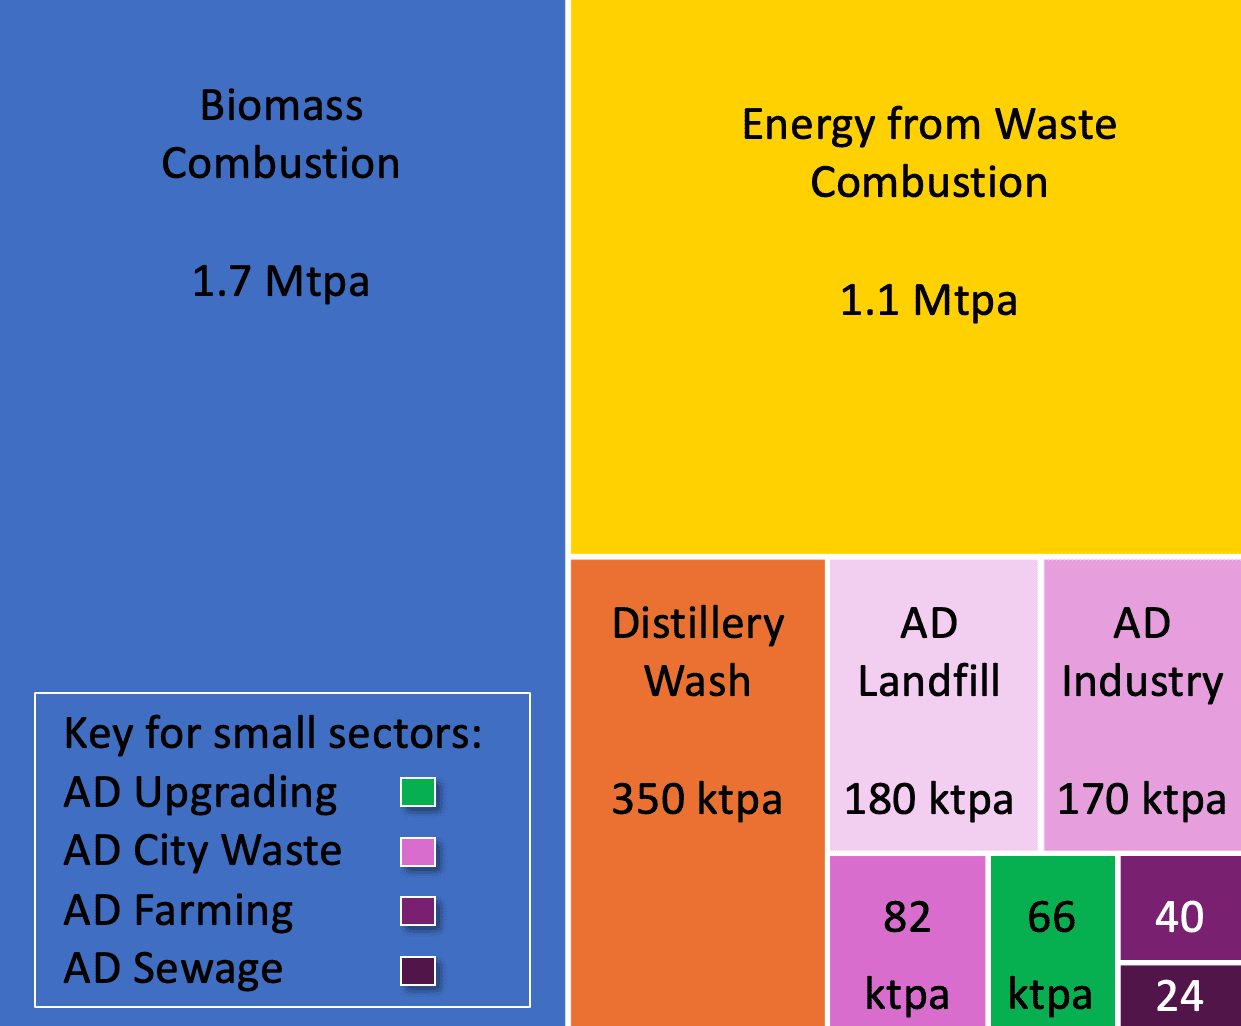
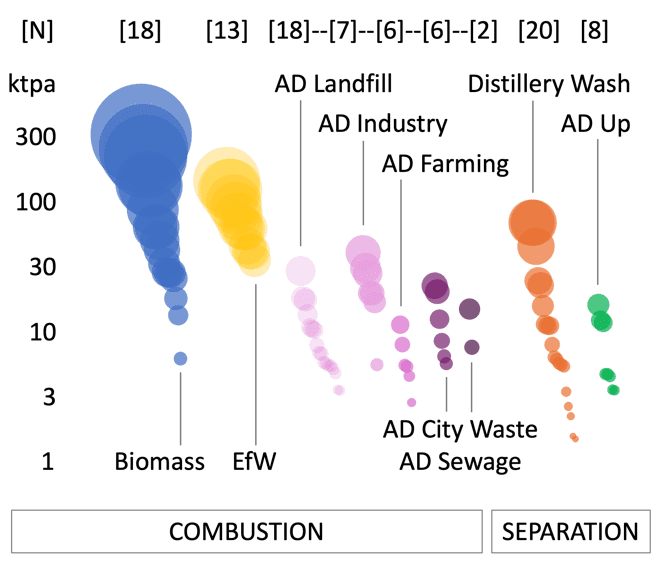
Figure 10. Bio-CO2 sectors. Distillery (orange) and AD Upgrading (green) are categorised as separation, yielding a low-cost CO2 source relative to post-combustion capture. Values in square brackets [18] represent the number of sources; area of circles represent the size of the source (ktpa).
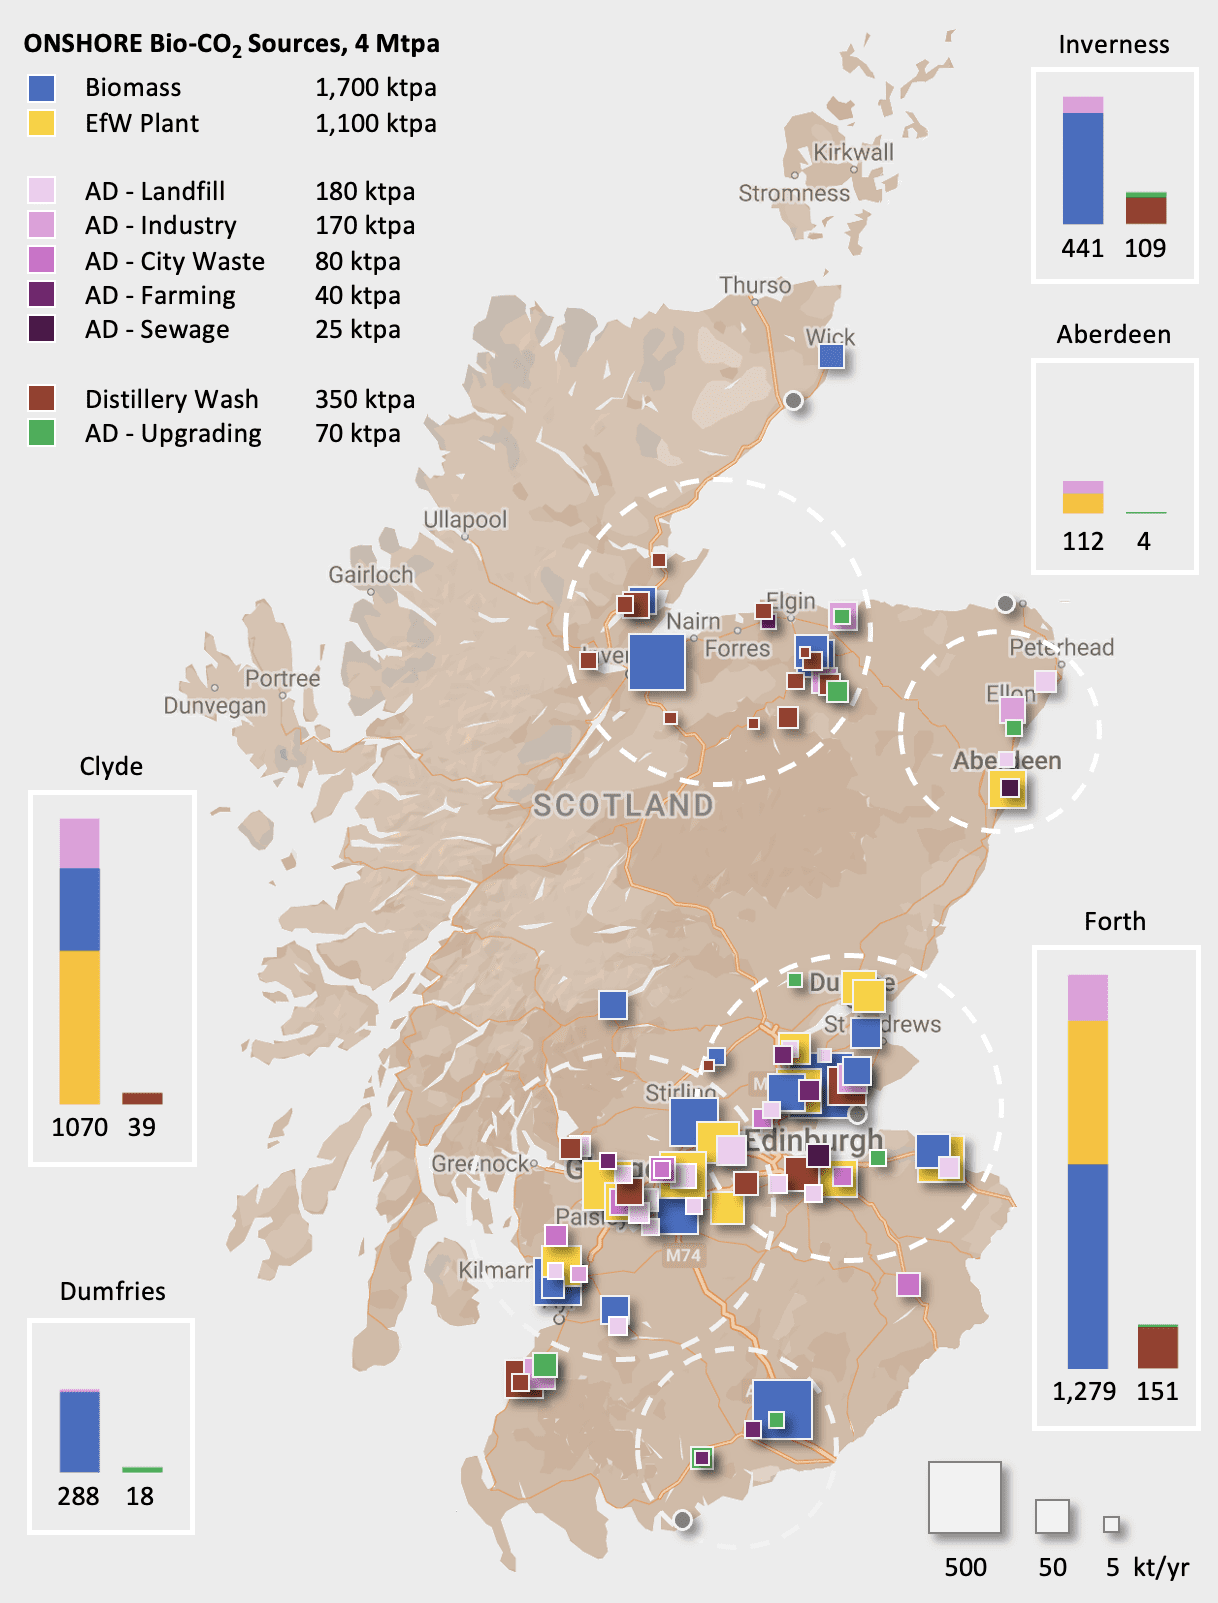
Figure 11. Onshore sources of bio-CO2 across Scotland. 91 of the 98 sites are located in five clusters.
Many low-cost distillery sources are located in the Inverness cluster, relatively close to the Lybster site. The five clusters are analysed by road distance from the nearest storage prospect in section 3.2. Also, note the overlap of the Forth and Clyde clusters at the terminus of the Feeder 10 pipeline. This highlights an interesting possible alternative to inshore storage, i.e. access to the Acorn offshore storage hub. This is discussed further in the summary.
Regional Clusters
We have grouped the sources into five clusters. The boundaries are marked by either a 100 km or 50 km diameter circle. Note, the sources east of Elgin are closer to Fraserburgh but included as part of the Inverness cluster given the primacy of Lybster as a storage candidate.
Inverness
The Inverness cluster, the third largest overall, falls within the Lybster catchment area. The cluster has 21 sites, producing 0.55 Mt of bio-CO2, and boasts a concentration of low-cost separation sources: 12 distilleries, 92 ktpa, and two AD upgraders, 18 ktpa. The average road distance to storage is high at 186 km. However, just over half of the cluster, 0.31 Mtpa, is within 150 km of Lybster: 5 distilleries, 43 ktpa, including the region’s largest distillery, Invergordon, 24 ktpa, which has been shortlisted for commercial CO2 capture; and 2 biomass plants: Morayhill, 323 ktpa, and Balcas, 28 ktpa, which is close to the Invergordon distillery. The remaining low-cost sources, 67 ktpa, are 200 to 240 km from Lybster by road.
Aberdeen
The Aberdeen cluster sits within the Fraserburgh catchment area, with six facilities producing 116 ktpa. The majority comes from five combustion facilities; the remainder from a small AD upgrading facility: Savock Farm, 4 ktpa. The largest source is the NESS EfW plant at 67 ktpa. The cluster has the third shortest average road distance to storage at 56 km.
Dumfries
The Dumfries cluster has five facilities producing 300 ktpa, mostly from the Steven’s Croft biomass plant, 0.28 Mtpa. The area includes two low-cost AD upgrading facilities producing a combined 18 ktpa. One of these, Crofthead, is already commercially capturing 13 ktpa, and has a separate CHP source, 3 ktpa, currently not captured. All the sites are within 70 km by road of the Solway Firth storage prospect. The cluster average at 48 km is the shortest overall.
Forth & Clyde
The Forth and Clyde clusters are closest to the Forth Basin storage prospect. These are the two largest clusters in our database, with a combined 59 sites producing 2.5 Mtpa. The area accounts for 69% of all combustion and 45% of all separation sources in the database; and includes some of the largest facilities including the Markinch and Caledonian biomass plants, 360 and 144 ktpa, and Cameronbridge distillery, 75 ktpa. Just over 0.84 Mtpa is within 50 km of the Forth Basin storage location, including Cameronbridge, 9 km, and Markinch, 10 km.
The North British distillery, 49 ktpa and 49 km by road from the storage location, is already commercially capturing CO2 for export to storage in Denmark. Low-cost separation sources account for 190 ktpa of bio-CO2 at an average road distance of 80 km from the storage location. It is worth noting the Feeder 10 terminus is located in the overlap of the two cluster boundary circles. Also of interest, are the significant local combustion clusters at Irvine, 290 ktpa, and Dunbar, 208 ktpa, which are 107 km and 109 km by road from the storage location.
Outliers
Seven outliers account for just 3% of all combustion, and 24% of all separation sources. The latter value reflects a concentration of low-costs sources in Ayrshire. This includes two facilities at the Girvan distillery: fermentation, 75 ktpa, and AD upgrading, 17 ktpa; and the neighbouring Ailsa Bay distillery, 7 ktpa. Combustion sources include Charlesfield AD, Borders, 18 ktpa, the Acharn biomass plant, Perthshire, 31 ktpa, and the Pulteney distillery, Wick, a small biomass plant, 19 ktpa. The latter is the closest source to Lybster.
Table 6. Bio-CO2 sources by cluster. Note: the sources outside clusters are highlighted in grey
|
Combustion |
Bio-CO2 |
Storage |
N |
Average |
Road |
Range, ktpa |
3.3 Mtpa |
|---|---|---|---|---|---|---|---|
|
Inverness |
441 ktpa |
Lybster |
7 |
63 ktpa |
197 km |
5-242 |
13% |
|
Aberdeen |
112 ktpa |
Fraserburgh |
5 |
22 ktpa |
57 km |
4-67 |
3% |
|
Forth |
1,362 ktpa |
Forth Basin |
25 |
51 ktpa |
46 km |
4-360 |
41% |
|
Clyde |
987 ktpa |
Forth Basin |
26 |
41 ktpa |
99 km |
5-158 |
32% |
|
Dumfries |
288 ktpa |
Solway Firth |
3 |
96 ktpa |
50 km |
3-279 |
9% |
|
Outliers |
112 ktpa |
Various |
4 |
28 ktpa |
86 km |
18-44 |
3% |
|
Separation |
Bio-CO2 |
Storage |
N |
Average |
Road |
Range, ktpa |
0.4 Mtpa |
|
Inverness |
109 ktpa |
Lybster |
14 |
8 ktpa |
181 km |
2-24 |
26 % |
|
Aberdeen |
4 ktpa |
Fraserburgh |
1 |
4 ktpa |
49 km |
4 |
1% |
|
Forth |
151 ktpa |
Forth Basin |
6 |
25 ktpa |
68 km |
2-75 |
36% |
|
Clyde |
39 ktpa |
Forth Basin |
2 |
19 ktpa |
114 km |
12-27 |
9% |
|
Dumfries |
18 ktpa |
Solway Firth |
2 |
9 ktpa |
46 km |
5-13 |
4% |
|
Outliers |
99 ktpa |
Various |
3 |
33 ktpa |
84 km |
7-75 |
24% |
Development timeframes
CCS is being rapidly deployed to meet demanding net zero targets. By our analysis, there are 32 projects across Europe with realistic timelines to storage by 2030 – Figure 12. Development timeframes have become crucial to delivering these targets, as policy makers seek to balance haste with due diligence. The exponential growth in demand for CDR credits is also exacerbating a supply imbalance for CO2 storage that early movers, notably Denmark (Stenlille), Iceland (Coda), and Norway (Northern Lights) are seeking to capitalise on. We observe that timeframes in these countries are the fastest in Europe at around five years.
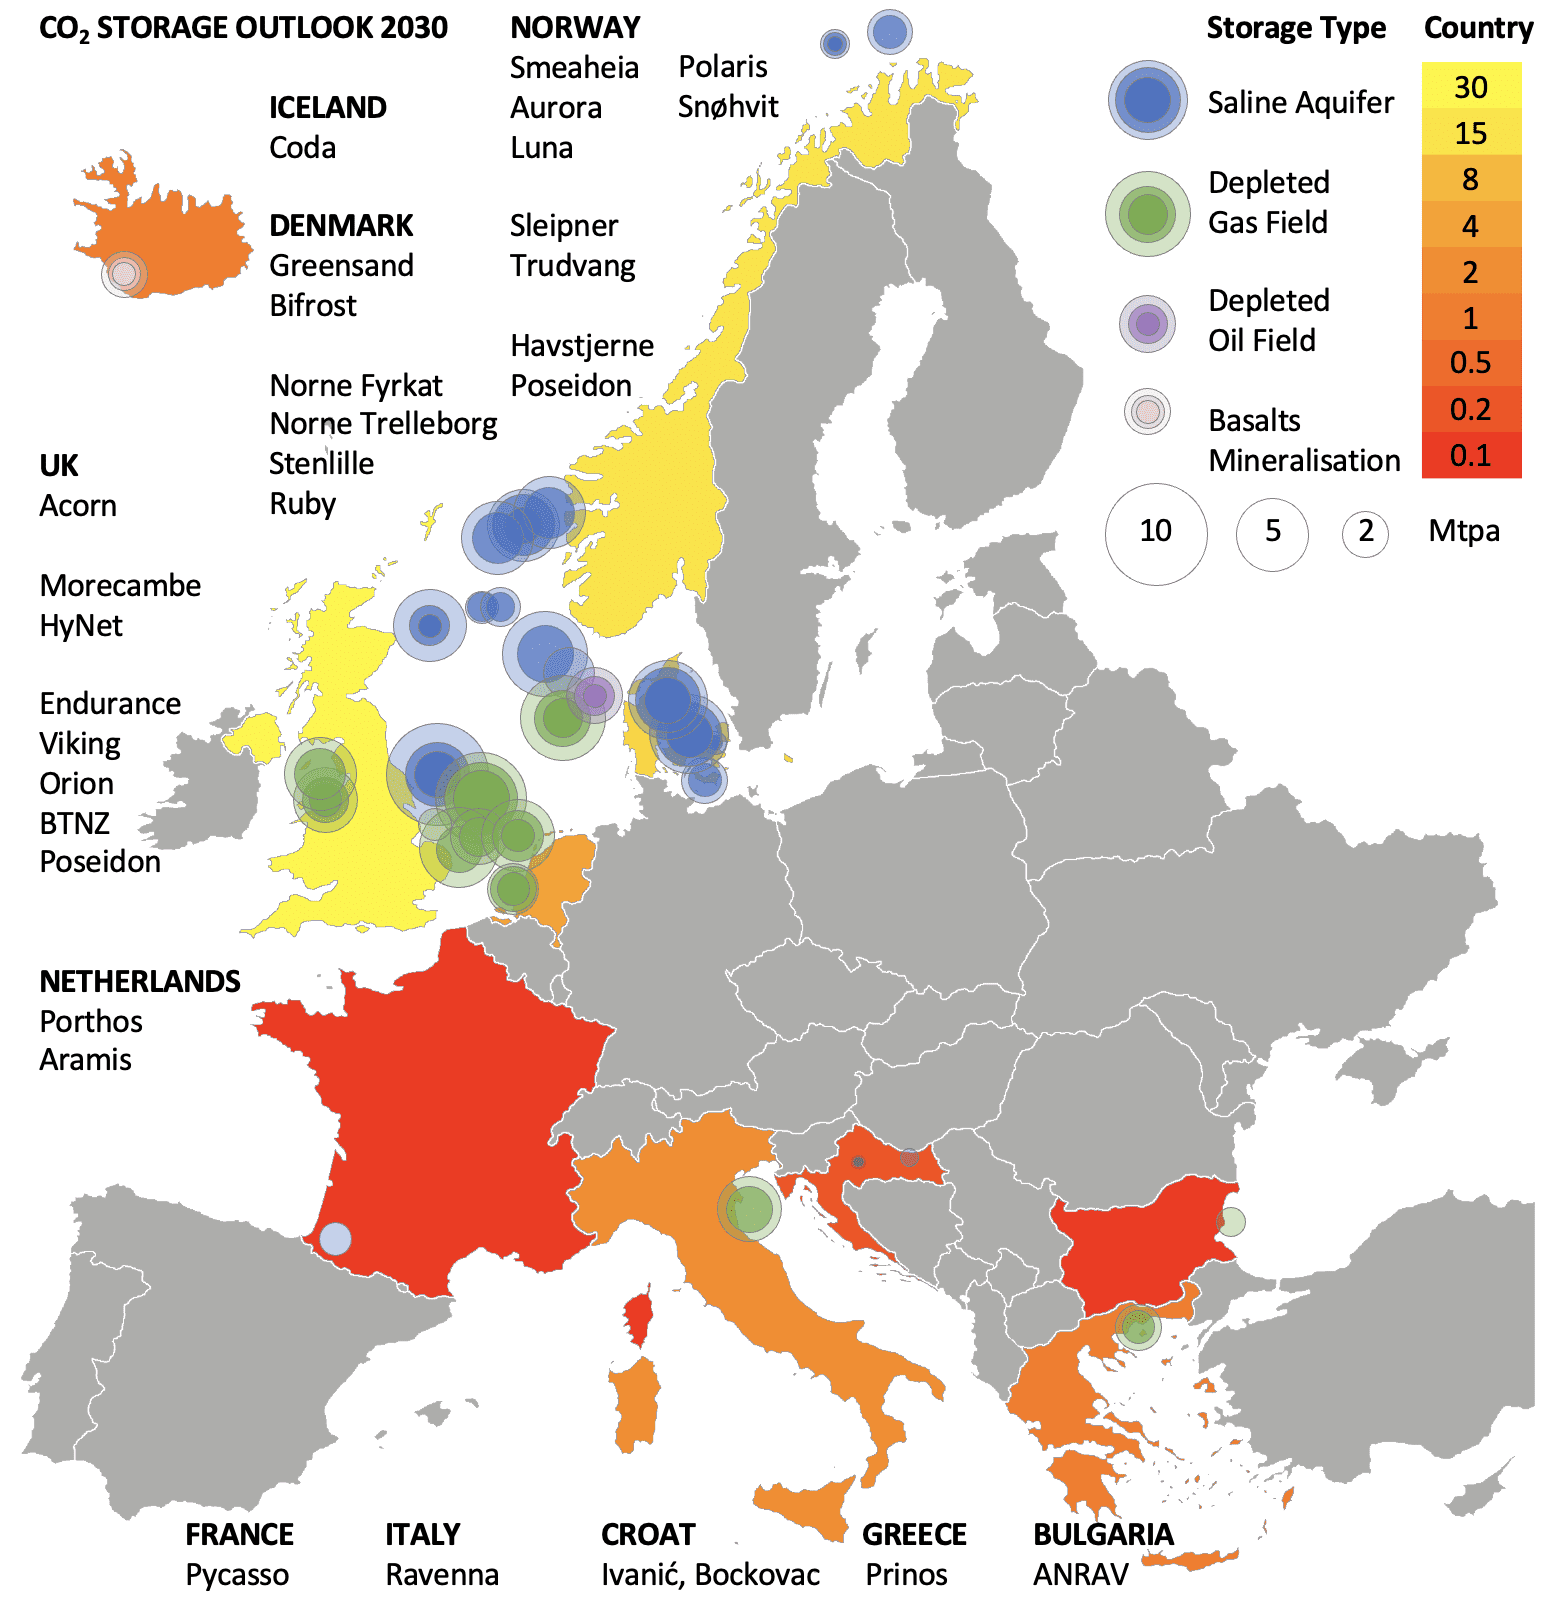
Figure 12. The outlook for European Storage, 2030. Seven countries have megatonne projects planned, with 64% of capacity in the North Sea. Countries in grey have no storage planned for 2030.
UK timelines
The NSTA, as the UK’s competent authority and carbon storage regulator, is instrumental in setting UK licensing timelines. The first UK carbon storage licensing round was held in 2022. The NSTA announced 21 accepted appraisal licences in September 2023, building on the experience of the previous seven licences. Each licence is tailored to the prospective storage site with a deadline for a storage permit application and specific requirements relating to the necessary maturation of the project for a permit application – Appendix D.
The first storage permits are expected no later than Q4 2024 for Endurance CS001 (East Coast Cluster) and Hamilton CS004 (HyNet North West). Assuming a two-year construction and commissioning period, first injection is expected no later than 2028 with minor delays possibly increasing that to 2030. It is worth noting that 21 of the appraisals are required to submit storage permit applications between 2026 and 2028, which may cause a significant bottleneck similar to Class VI well permitting delays at the Federal level in the USA – Appendix I.
Analysis of the 27 active licences indicates that the average appraisal time from early risk assessment to storage permit application is five years and three months. Examples of exceptionally short and long appraisals are the Scottish Cluster’s Acorn East licence (Storegga, two years) and the East Coast Cluster’s Bunter 42 expansion (BP, eight years). The former is supported by a decade of prior site characterisation. The latter is an exploration target that requires 3D seismic acquisition and an appraisal well. Allowing for construction and commissioning, storage projects expect to be operational, i.e. ‘on injection’, within eight years on average of an appraisal licence application.
EEA timeframes
Analysis for EEA projects is largely dependent on public statements of ambition. The outcomes are faster than the UK. The nine Norwegian projects average six years from initial application to expected operation. Denmark is relatively fast by comparison, averaging four years for its six projects. The two large Dutch projects, Porthos (2019) and Aramis (2021), expect to be operational within seven years. Pycasso, the French project launched in 2021, has the longest development period at ten years. The remaining projects for Bulgaria, Greece, Iceland, and Italy expect to be operational within five years of their start dates which range from 2021 to 2023. If the UK timings are indicative, ambitious EEA deadlines of less than six years for a third of the projects are likely optimistic and at risk of delays of one to five years. This may result a storage capacity substantially less than the EU target of 50 Mtpa.
Implications for inshore storage
Many storage projects are on timelines of around a decade characterised by three phases: a pre-licensing identification and application phase of approximately three years; an appraisal licensing phase that averages five years; a storage permit construction and commissioning phase of around two years. This is likely to hold true for Fraserburgh and the Solway Firth, the two less mature areas of interest identified in Chapter 2. Lybster is an exception, with several factors indicating a fast-track approach that could support a storage permit application within three years. This option is examined in the final chapter of this report.
Cost-revenue analysis
The following cost-revenue analysis for the capture, transport, and storage of bio-CO2 establishes to a good first approximation the potential value of developing onshore and inshore CCS in Scotland. The full chain cost is compared to available revenue from the recent emergence of a high-demand and low-supply voluntary CDR market.
Note that indicative costs for capture, transport, and storage are based on publicly available sources where possible. In the absence of published data, companies operating in Scotland, the UK, and Europe have been approached to provide a commercial estimate.
Capture
Capture is divided into two categories: combustion and separation. Combustion accounts for seven of the studied nine sectors and 89% of the bio-CO2, 3.3 Mtpa. This category costs more than separation as the capture is a post-combustion process on a low-purity and dilute flue gas stream, whereas separation from distilleries and biomethane upgraders is on a high-purity and concentrated CO2 stream that simply requires dehydration and compression.
The combustion sources in this study range from eight large biomass and EfW facilities, 130-360 ktpa, to twenty-five small AD sites, 3-12 ktpa. Post-combustion capture is sensitive to economies of scale, with many studies noting a wide range of capture costs that reflect the stream purity and size of the facility. For example, there is an average 43% increase in cost for an order of magnitude decrease in capture rate from megatonne to sub-megatonne projects (GCCSI, 2021).
The available literature focuses on large CCS applications, broadly defined as facilities emitting at least 100 ktpa (IEAGHG, 2024). A degree of generalisation is therefore necessary given that 89 of the 98 sources in this study emit less than 100 ktpa, with half the sources emitting less than 15 ktpa.
Where possible, we estimate a range for costs and assume the high cost given the predominance of small sources in our data.
Biomass is the largest sector in this study with sources averaging 95 ktpa. We estimate a low cost of £87 per tonne based on the levelised cost analysis of Lehtveer & Emanuelsson (2021) – Appendix J. We estimate a high cost of £128 per tonne based on analysis of emitters smaller than 100 ktpa by Beiron et al. (2022). We favour the high cost as representative – Table 5.
Energy from Waste is the second largest sector with average emissions of 84 ktpa. Two estimates were found with broadly similar costs: £81 and £109 per tonne (MVV, 2024; IEAGHG, 2024). We favour a high cost as the average plant capacity is small at under 200 ktpa of waste.
Anaerobic Digestion covers five sectors in the combustion category with low average emissions of 13 ktpa. We found no data on capture costs for AD combustion. We assume a low-cost of £128 per tonne from the biomass analysis, given the much smaller size of AD sources. In the absence of data, we conservatively assume a high cost of £136 per tonne based on a mean EfW cost, £95, multiplied by the order-of-magnitude scalar for combustion, 143%.
Separation produces highly concentrated streams of pure bio-CO2 (EBA, 2022). Distillery fermentation, average 18 ktpa, and AD upgrading, 8 ktpa, are the two sectors that use cryogenic distillation and membrane separation to capture the CO2. Global analyses provide a low-cost estimate of £30 (IEA 2021; NETL, 2023). In our opinion this reflects economies of scale for large bioethanol plants in the USA. A high-cost price of £60 per tonne is based on a commercial sales estimate for small emitters (E Nimmons, pers. comm., May 2024)[1].
Table 7. Estimated capture costs by sector, including % concentration of CO2 in emissions stream.
|
Sector, Bio-CO2 |
Category |
N |
Average |
Cost Range |
High Cost |
Stream |
|---|---|---|---|---|---|---|
|
Biomass Plant |
Combustion |
18 |
95 ktpa |
£87 – £128 |
£128 |
8-20% |
|
Energy from Waste |
Combustion |
13 |
84 ktpa |
£81 – £109 |
£109 |
6-12% |
|
AD Combustion |
Combustion |
39 |
13 ktpa |
£128 – £136 |
£136 |
10-20% |
|
Distillery |
Separation |
20 |
18 ktpa |
£30 – £60 |
£60 |
98% |
|
AD Upgrading |
Separation |
8 |
8 ktpa |
£30 – £60 |
£60 |
98% |
Transport
Truck transport is the simplest option, as rail transport of geographically dispersed sources would require onloading and offloading at rail heads with truck transport at both ends. A rail route north from Inverness, and clusters further south and east, terminates at Wick. No cost analysis of rail has been undertaken for this study.
Truck transport of CO2 is by a cryogenic T75 ISO tank as a liquid at -35°C and 22 bar. Each truck carries 20 tonnes. Assuming an injection rate of 100 ktpa and batch delivery over 6 days a week throughout the year, 16 truck loads per day are required. There is scarce literature on truck costs for Europe. However, a commercial estimate of £20 per tonne for a 100-mile round trip seems reasonable (E. Nimmons, pers. comm. May 2024) and is applied here – Appendix J. This is equivalent to £0.124 per tonne per km, which is similar to a recent cost estimate of £0.126 by Ricardo (2023) and $0.111 for the USA (Stolaroff et al., 2021). We presume that the slightly lower dollar estimate reflects lower fuel costs in America.
The average road distance to Lybster for the Inverness cluster is 191 km, with 87 ktpa available within 150 km. This includes 40 ktpa of low-cost CO2 from four distilleries; the remaining 47 ktpa are from two biomass sources, Balcas and Pulteney. The Inverness cluster has enough low-cost CO2 to supply 109 ktpa at an average road distance of 188 km, equivalent to £24/tonne.
With the exception of Savock Farm at Ellon, 4 ktpa and 300 km, the remaining low-cost sources are more than 360 km away. It follows that road transport costs for 100 ktpa over 10 years are £20-50 million with an opportunity to source all of the bio-CO2 from the Inverness cluster and low-cost sources at £24 million. It is worth mentioning that a hydrogen fleet would reduce life cycle emissions and road wear, being lighter than an electric vehicle equivalent (Low, 2024).
Storage
Three storage cost scenarios are considered. The most detailed is Lybster, outlined below. The second scenario is a first approximation for Fraserburgh and the Solway Firth. This is similar to Lybster but less mature and more challenging with respect to appraisal wells, seismic data, and location. The third scenario is a consideration of potential costs for the Forth Basin proposal, the least mature of the storage options.
Lybster
The cost analysis for Lybster assumes 100 ktpa of CO2 over a decade which would account for half of the expected capacity estimate of 2 million tonnes – section 2.2.1. This would potentially mature the understanding of the site towards a further decade of injection.
Buffer: The site will require tanks for the temporary storage of CO2 prior to injection. We assume four tanks with sufficient capacity for an injection rate of 100 ktpa, equivalent to an injection rate of 12 tonnes/hr. This allows for 10 days of well maintenance per year. While the production and injection of CO2 is continuous, transport occurs in discrete runs and is a batch process. Redundant capacity is required on-site to provide operational flexibility. Assuming 16 trucks a day and 125% capacity based on LNG shipping experience, 4 x 100 m3 onsite tanks would buffer flow to the wellhead. For comparison, the twelve Northern Lights tanks at Øygarden are 6 times the size to accommodate one shipload, 7,500 m3. The capital investment for the Lybster storage tanks and site works is assumed to be around £1 million.
Compression: The site will require a compressor to take the liquid CO2 to the required pipeline pressure of 150 bar for the well system and injection at reservoir conditions. We estimate this to require 120 kWh per tonne after Psarras et al. (2020) at an operational cost of £30 per tonne with no capital investment, assuming rental of the equipment from a service company. The operational cost over 10 years at 100 ktpa is estimated at £30 million.
Injection: The site also requires an injection well. The discovery well, 11/24-1, is unsuitable. The well is designated AB3 (NSTA, 2023), i.e. permanently abandoned and seabed cleared, with no infrastructure in place. Additionally, three cement barriers isolate the well. The re-purposing of 11/24-1 would be technically challenging and very expensive.
The production well, 11/24-3y, is currently suspended with the onshore surface infrastructure in place. The current drilling pad can be re-used and the well re-purposed. 11/24-3y is an extended reach well that has been designed to encounter a 173 m succession of the target reservoir sandstones compared to the 25 m of the vertical exploration well, 11/24-1. This favours good injectivity. It is estimated that the conversion cost of an onshore well to CO2 injection is approximately £1-2 million (IEAGHG, 2022). This is an order of magnitude cheaper than an offshore injection well at £10-15 million based on NSTA estimates of recent North Sea drilling costs at £5-10 thousand per meter (NSTA, 2023). We conservatively assume a combined conversion and maintenance cost for the well of £3 million.
Appraisal: The storage site requires an expert reinterpretation of the existing 3D seismic cube, including depth conversion and static model construction (three months) and dynamic simulation of the reservoir (nine months). This would match the known fluid production history and forward model the reservoir response to CO2 injection and storage (9 months). We estimate the cost of this appraisal study to be about £0.5 million. A related geomechanical study of similar duration and rigour is also estimated to cost £0.5 million. The budget for a two-year appraisal that includes both the modelling and geomechanical studies, a well repurposing study, and standard elements of the NSTA appraise-assess-define framework for appraisal licensing is estimated to cost approximately £3 million.
The cost estimates sum to a sub-total is £37 million. Assuming operational costs for the site of £250,000 per annum, the capital investment and operational costs sum to £40 million. Not addressed here are monitoring and verification, as these are highly dependent on the technologies chosen. The design of the monitoring programme is an important element of the appraisal licence. However, if we conservatively assume a monitoring cost of £20 million over the lifetime of storage and add £10 million for conformance and decommissioning, this indicates a storage cost of £70/tonne based on 100 ktpa over 10 years.
Fraserburgh and Solway Firth
These two prospective sites require an offshore installation and operation. Assuming suitable targets are discovered at 1,000-2,000 m depth, the well drilling cost would be £10-15 million. A compressor would need to be either located offshore on a small operational platform, or at the landfall end of a 16 km pipeline. While there is scant literature on short pipeline costs, we conservatively assume a cost of £50 per tonne based on the analysis of Johnsson et al. (2017). The 10 year 100 ktpa cost is £50 million. The cost of an offshore operational platform is tentatively estimated at £10 million. Note that no cost estimate was found for this element.
Appraisal costs reflect the need to reinterpret the existing seismic over the area at £2 million, plus the possibility of needing 100 km2 of new 3D seismic for exploration and appraisal at £5 million. Further appraisal requirements will likely increase the appraisal budget to at least £10 million. From the Lybster cost breakdown, we can add on the cost of temporary storage, £1 million, compression, £30 million, maintenance for the well, £3 million, and monitoring of the site, £20 million. It follows that the total cost for Fraserburgh and Solway Firth would be, to a very rough approximation, around £140/tonne, i.e. double the estimate for Lybster.
Forth Basin
No cost analysis is undertaken for the Forth Basin, as our recommendation is for this prospect to proceed as an experimental pilot study with a nominal injection rate of 10 ktpa. The site would require an injection well with the wellhead located onshore to reduce costs. However, the research budget would need to cover the cost of the well, and handling of the onshore dissolution of CO2 into brine extracted from the well. Any research proposal is likely to be costed at more than £10 million for the well alone. The brine extraction, mixing facility, and re-injection are likely to more than double the well cost. However, no data was found on the latter elements. As such, an accurate costing is beyond the scope of this study.
CDR market
The European Union and UK have yet to regulate a CO2 removal requirement. However, the voluntary market for carbon dioxide removal (CDR) is rapidly emerging, with rumours of Microsoft, Shopify, and Stripe buying credits valued at USD1,000 per tonne from Iceland’s Carbfix and Climeworks projects in 2021. Climeworks is offering public CDR subscriptions at USD1,500 per tonne (WP, 2024). These are based on direct air capture (DAC) and CO2 mineralisation in the young and reactive basalts of Hellisheiði, 20 km to the east of Reykjavik.
A different price signal for permanent storage has recently emerged in Europe. In 2023, the European Commission approved the Danish NECCS fund (DKK 2.6 billion, €350 million) for the permanent geological storage of CO2 from direct air capture and biogenic sources; the projects must be operational by 2026. In April 2024, Denmark awarded NECCS funding to three bio-CO2 companies to remove 1.1 Mt of CO2 between 2026 and 2032 – Table 8[2].
Table 8. Awarded NECCS funding for CDR and CCS in Denmark, April 2024.
|
Company, Country |
NECCS |
Storage |
Contract |
DKK / tonne |
GBP/tonne |
|---|---|---|---|---|---|
|
BioCirc biogas, DK |
2026-2032 |
Stenlille |
130.7 ktpa |
968.5 |
£110 |
|
Bioman biogas, DK |
2026-2032 |
Stenlille |
25 ktpa |
1,117.5 |
£127 |
|
Carbon Capture Scotland, UK |
2026-2032 |
Stenlille |
4.65 ktpa |
2,600 |
£297 |
These credits have been negotiated on the voluntary carbon market, and tentatively establish a low CDR value of £110. Ørsted, the Danish power company, are also contracted by Microsoft to capture 3.67 Mt of bio-CO2 over 10 years which will be exported to Northern Lights for a combined transport and storage cost of around €100 per tonne. The Ørsted credit value is unknown. However, given the much higher value of credits for geological storage in Iceland, we favour the high value of £297 as indicative of European CDR pricing in the near future.
Value proposition
Applying the high-cost prices for capture, transport, and storage, and assuming storage at Lybster, we can estimate a full chain cost. Low-cost bio-CO2 is sourced from the Inverness cluster. A combined capture and storage rate of 100 ktpa is assumed for a period of 10 years.
£60 per tonne for bio-CO2 from separation sources, primarily distilleries
£24 per tonne for transport for an average road distance of 188 km
£70 per tonne for storage from buffering tanks to decommissioning
- Full chain CCS cost estimate: £154 per tonne
- Voluntary market CDR credit revenue: £297 per tonne
- Net return on investment over 10 years: £143 million
Conclusions
The following section poses six questions that draw out the major themes and outcomes of our research. The answers are intended to highlight actionable policy directions that may support the rapid development of domestic CCS on small but lucrative bio-CO2 sources.
Can Scotland develop inshore bio-CO2 storage by 2030?
The short answer is yes. The key metrics are 3.7 Mtpa of available bio-CO2, including 109 ktpa of the lowest cost sources, mainly distilleries, within 188 km of the inshore Lybster prospect. This is a good source-sink match for a site that has an expected 2.1 Mt capacity. First injection by 2030 will require a rapid formal appraisal and regulated consents to permit storage.
The remaining prospects identified in this study are much less mature and characterised by locations that require a substantial investment to appraise. A realistic timeline for these prospects is 2035-2040 with no clear indication at this stage that the prospects are suitable.
How can this be funded?
There are several ways to fund the appraisal of Lybster, which we estimate will cost about £3 million and take three years. Commercial interest may be sufficient to raise capital. This may be through a capture company that is seeking storage, or as a joint venture between the capture company, whisky distilleries and their parent companies. A successful appraisal will lead to construction and commissioning, including site works such as tank installation and well engineering, which we estimate to cost £3-5 million. An approximate budget of £10 million is needed.
We note the strong narrative structure of decarbonising international brands within a cultural tradition. This may attract global corporations who wish to associate themselves with carbon dioxide removals that have a story to tell. As a strategic project for Scotland, the appraisal costs may be partly underwritten by government funding.
On commissioning, verified carbon storage certificates can be issued on the voluntary market at an estimated price of £300 per tonne. On injection, assuming a sustained injection rate of 100 ktpa and a 20% mark-down of storage to removal, the site would generate an annual revenue of £24 million. No subsidy would be needed once storage has commenced. This would contribute to both Scotland’s economic growth and a just transition to net zero.
How quickly can this be done?
The fastest appraisal-to-permit timelines in Europe are about three years. These fast-track appraisals rely on an aggressive pursuit of a commercial opportunity and a background of available data and mature understanding of the technical risk. Lybster has both the interest and the technical maturity. The missing piece is the necessary legislation to support a legal consent for the appraisal license and storage permit if successful. The legal advice is that the necessary consents may only require a transfer of existing UK regulations to Scottish law.
How much bio-CO2 capture is available?
In total, we have identified 3.7 Mtpa of available bio-CO2. This is far in excess of the initial requirement for inshore storage, which we estimate at 0.1 Mtpa. The 3.6 Mt surplus and its geographic concentration in the central belt suggests that offtake to Acorn via the Feeder 10 pipeline ought to be considered as a parallel strategy to inshore storage, noting that this could be a considerable time in the future – Figures 13 and 14.
Combustion source capture is relatively high cost at around £120 per tonne. Separation is much more valuable at £60 per tonne. Distilleries and AD upgraders are common at the low end of the range, making up nearly half of the smallest 27 sites that average 5 ktpa, and one-third of 22 sites that average 10 ktpa. Significantly, there are 14 separation sources near Inverness that may support 21 modular capture units assuming 3-5 ktpa per unit, i.e. sufficient to batch load 16 trucks at 20 tonnes per day for a 100 ktpa supply to Lybster.
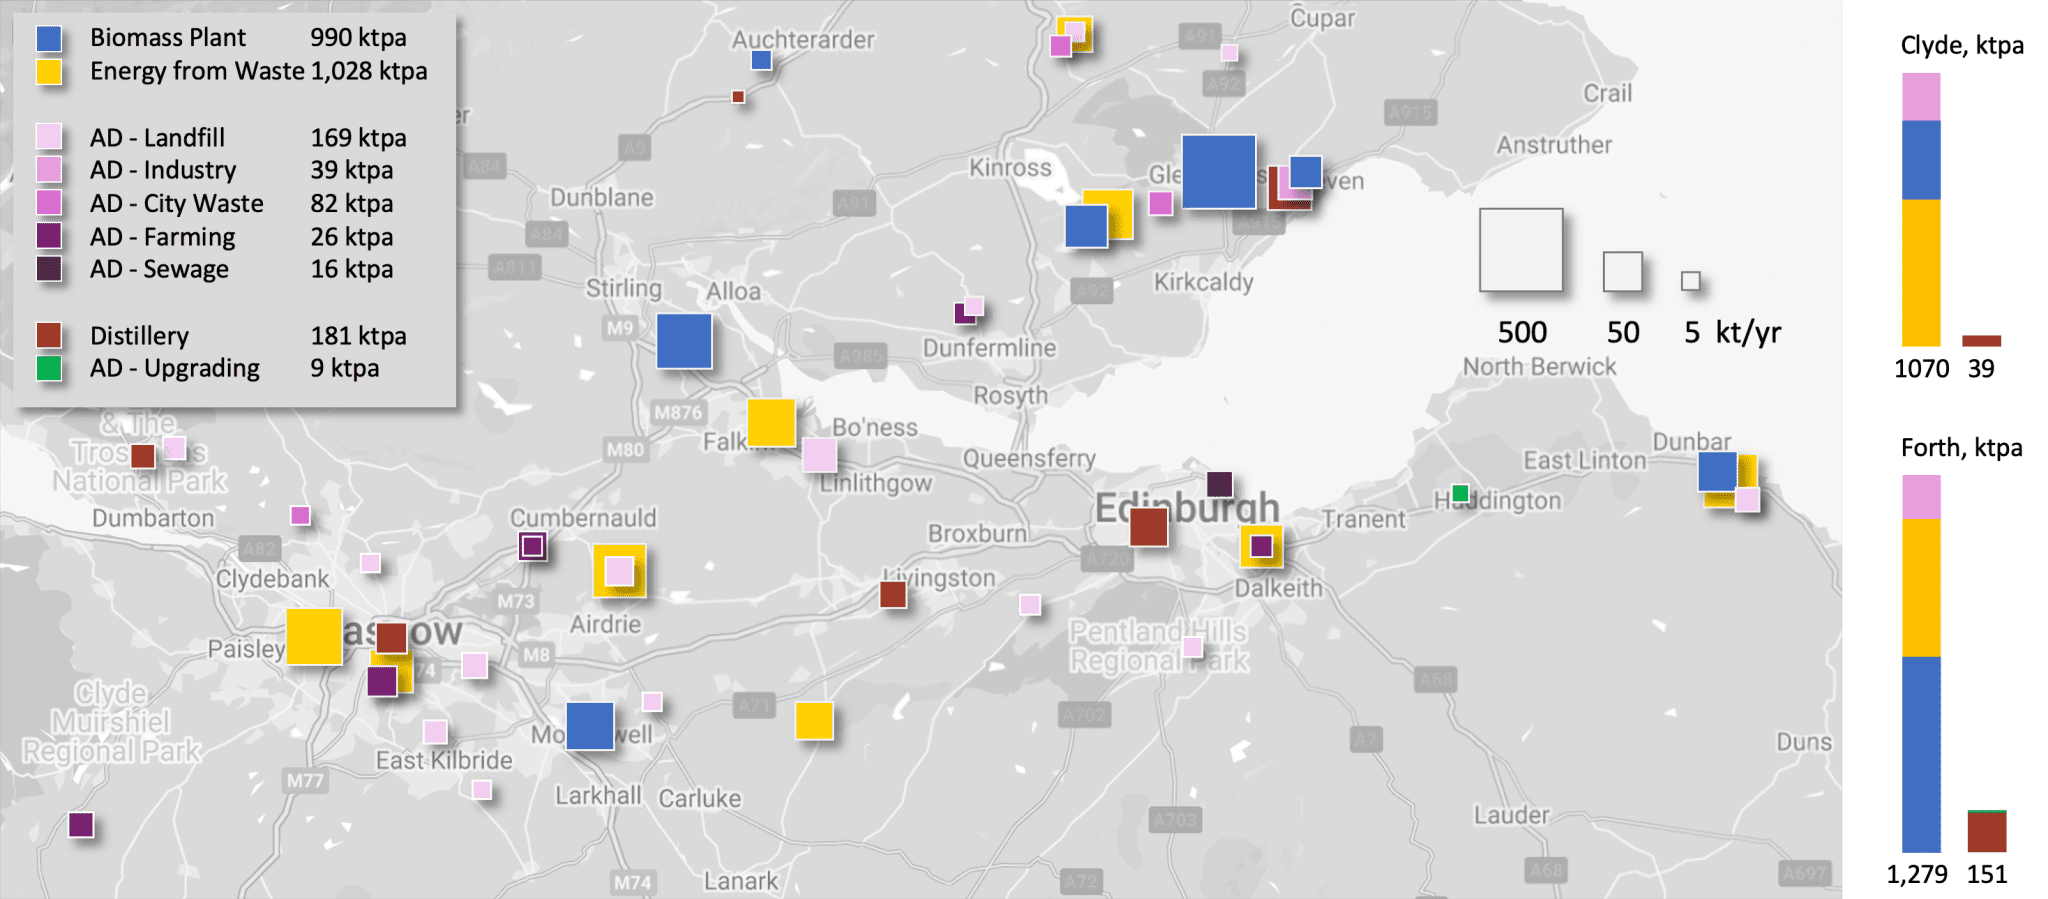
Figure 13. Central Belt sources: 2.3 Mt of combustion bio-CO2 is available, of which 0.3 Mt is from 28 small AD sites; another 190 ktpa of separation bio-CO2 from 6 distilleries and 2 AD biogas upgraders.
How much storage capacity is available?
Based on current data, our analysis found that only the Lybster prospect has potential commercially viable storage capacity – expected to be 2.1 Mt. This would be sufficient for 20 years of storage at an injection rate of 100 ktpa. This is not significant in terms of overall storage capacity in the North Sea or in terms of Scotland’s overall statutory climate targets but would provide an opportunity to showcase Scotland as a global frontrunner for CCUS technologies.
2.1 Mt of storage would generate £500 million in CDR revenue at 100 ktpa – an injection rate that is much lower than the technical limit for CO2 storage, which is generally thought to be around 700 ktpa. The low estimate is 0.35 Mt, which would result in only three to four years storage and a revenue of £72 million. The high estimate of 9.4 Mt would be more than sufficient to provide storage out to 2090 at a revenue in excess of £1.5 billion.
What policy actions need to be taken?
The legal opinion is that minor amendments to existing regulations are required to license storage appraisals and storage permits in the territorial waters of Scotland. To repeat the summary from Chapter 1: CO2 storage involves multiple activities under different licensing regimes. It may well be, however, that insofar as existing regulations could be relied upon, the process of modifying existing statutory instruments could be fast. This would really be a question for those with a better insight into the technical detail and political due process.
The government may also consider if it is helpful to fund the appraisal of Lybster partially or wholly, at an estimated cost of £3 million, which could commence immediately in anticipation of the required amendments being in place to sanction the outcomes and grant a storage permit. Assuming a construction and commissioning term of 1-2 years, the legislative changes would need to be in place by 2028 to support an on-injection outcome by 2030.
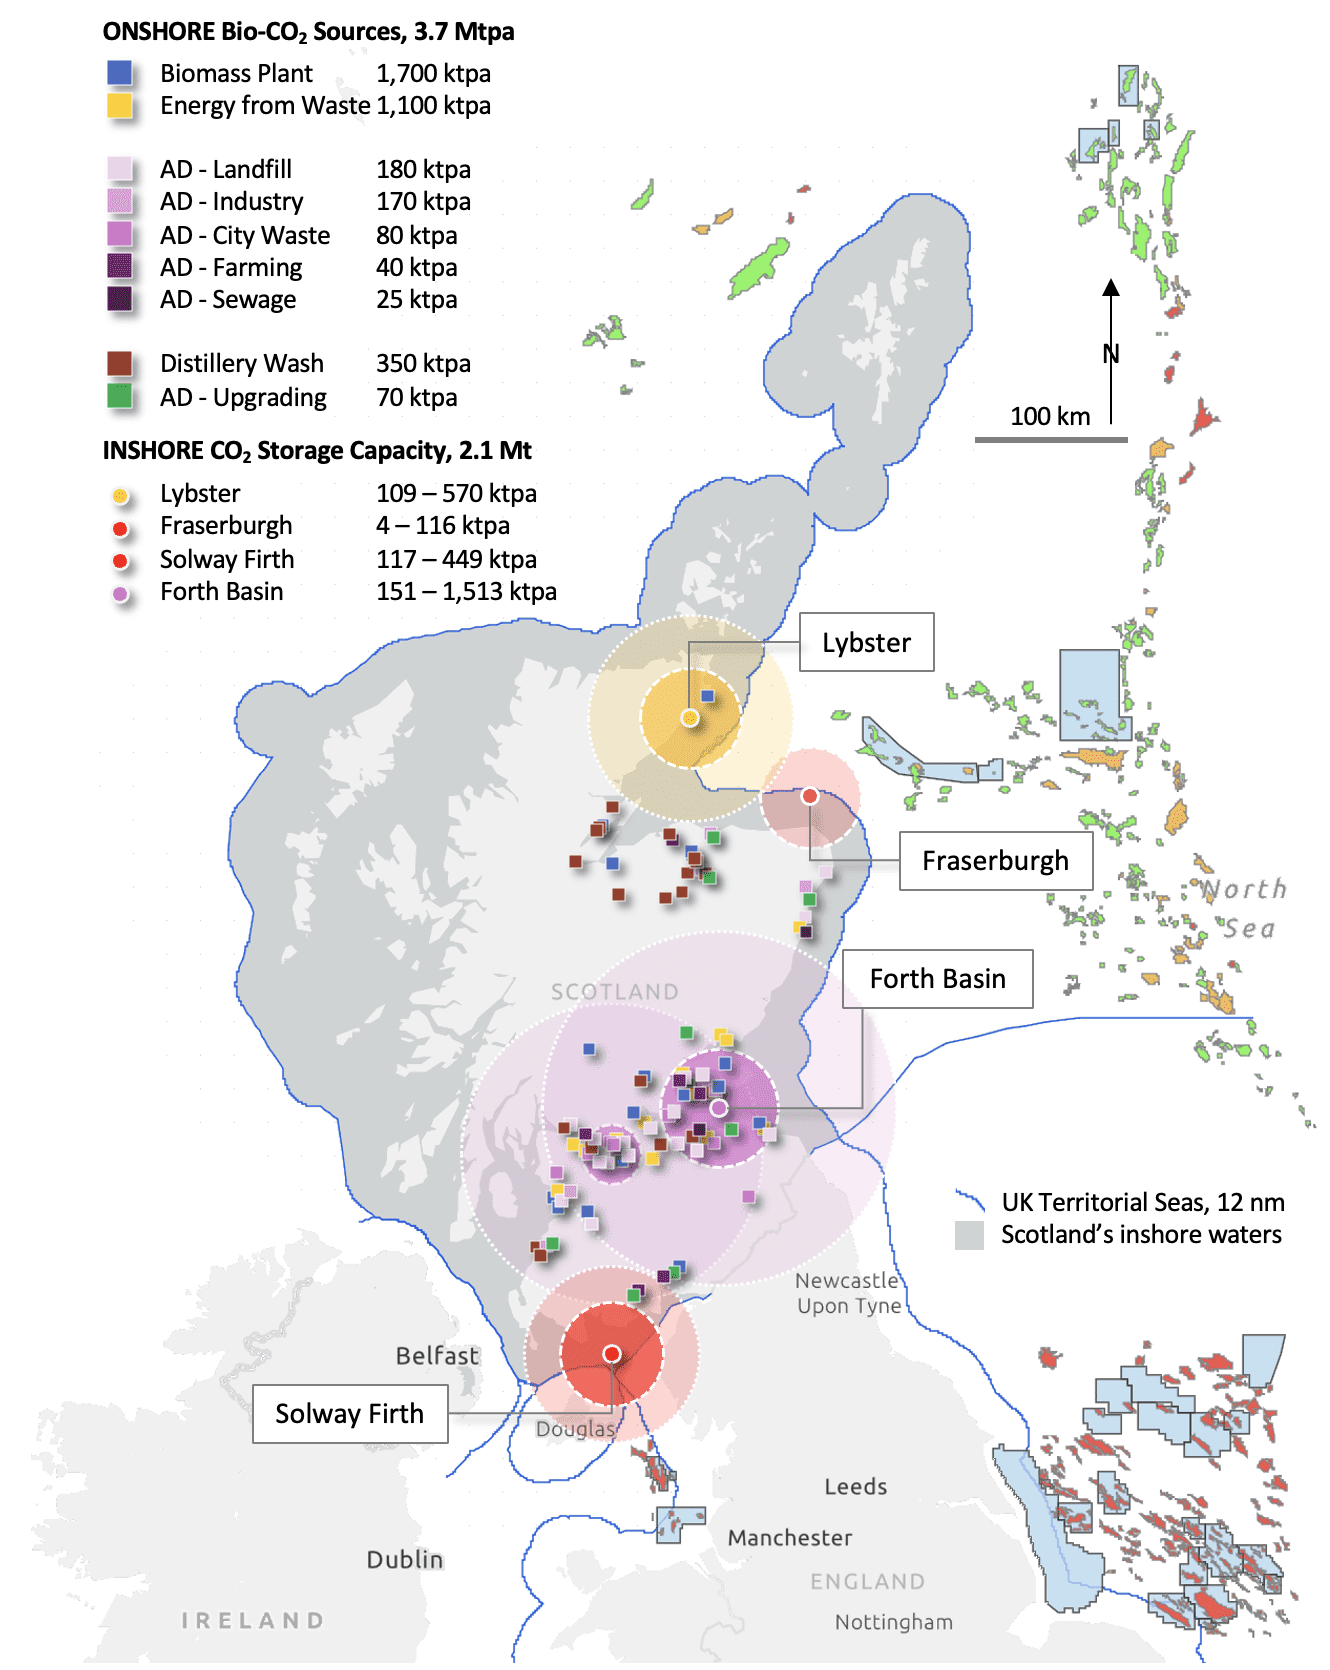
Figure 14. Storage prospects by maturity and available bio-CO2 from the 98 sources. The inner circle represents the available separation CO2; the lighter outer circle represents the combustion CO2. Note: the Clyde circles are not associated with a prospect but included for relevance to Feeder 10.
Vision
Storegga has proposed that Acorn will include a NET contribution (Storegga, 2022a). This was originally envisaged as a direct air capture project but timelines and capture costs for this technology suggest that bio-CO2 has a greater likelihood of supporting 2030 targets. We envision two bio-CO2 scenarios that potentially provide significant tax revenue to Scotland.
Scenario 1: Low-cost separation sources at £60 per tonne provide the highest profit and earliest opportunity for taxation. For Lybster, 100 ktpa is available from the Inverness cluster of distilleries. For Feeder 10 and Acorn, 200 ktpa is available from the central belt.
Scenario 2: More costly but larger combustion sources, primarily biomass and energy-from-waste plants at £120 per tonne provide 2 Mtpa of CO2 to Feeder 10. For Lybster, a large biomass plant, Morayhill, potentially doubles and then trebles the 100 ktpa injection rate if early well performance and capacity indications support expansion. This may include possible satellite prospects such as Knockinnon and Braemore.
Storage taxation: Assuming a 10% tax on storage only, this would harvest a nominal £7 per tonne on a storage cost of £70 per tonne – our estimate for Lybster; Storegga has published a transport and storage cost of £45 per tonne for Acorn (Storegga, 2022b). Taxing the full chain yields £15 on a CCS cost of £150. A tax on net profit would also yield £15 assuming a £300 credit.
Credit taxation: A yet more lucrative option would be to tax the CDR credit, yielding £30 on a nominal £300 per tonne – Figure 15. The supply-demand imbalance for permanent removals suggest high prices may be sustained for at least a decade as early storage capacity is primarily being booked to industrial clusters and fossil CO2, which is priced as a reduction on the ETS market.
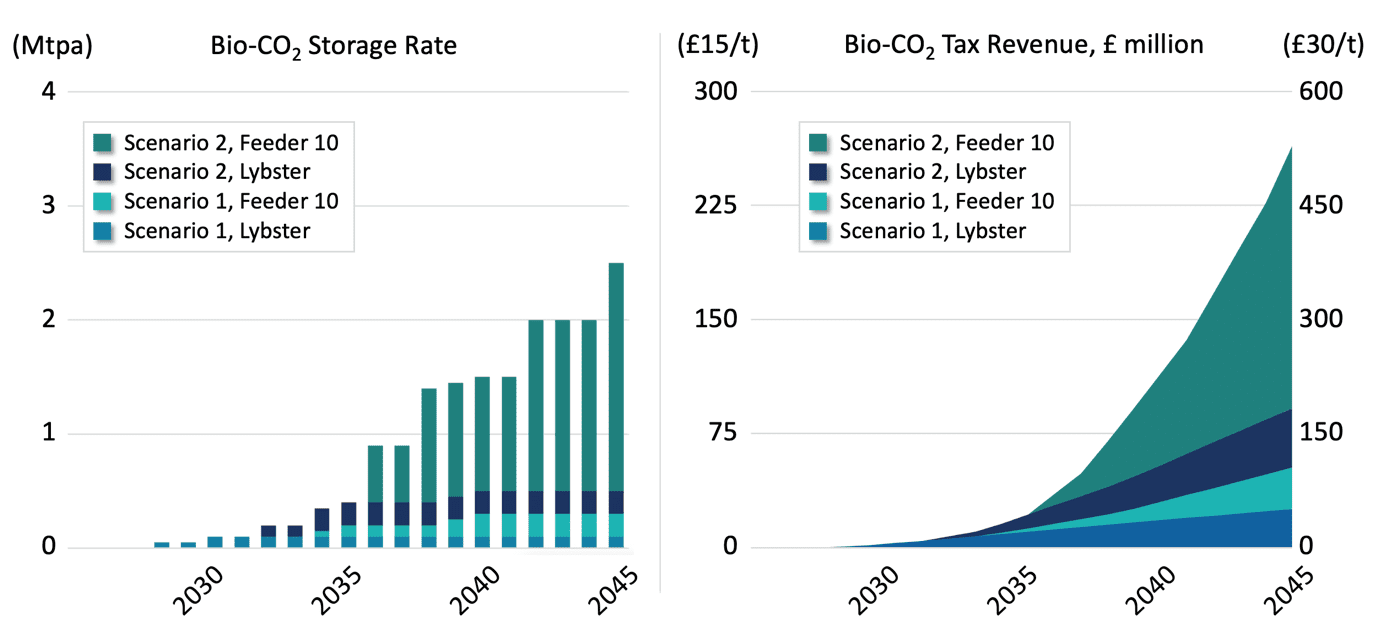
Figure 15. Storage rate and potential tax revenue for two described Lybster and Feeder 10 scenarios.
Worth noting is that a successful demonstration of profitable storage and permanent removals at Lybster would potentially catalyse a race to capture separation bio-CO2 from AD sources. This would drive decentralised farm-scale emissions control, upgrading of biogas to biomethane and displacing fossil methane from local energy networks and the grid where a connection is available.
A boutique demonstration of storage at Lybster also has the advantage of being driven by commercial incentives and timelines, with the possibility of positively disrupting the cluster timelines and NET outcomes, especially for the second scenario.
References
Beiron, J et al (2022). Carbon capture from combined heat and power plants – Impact on the supply and cost of electricity and district heating in cities. International Journal of Greenhouse Gas Control, 129.
BEIS (2024). BEIS: Heat Networks Planning Database (January 2024). Available at: www.data.gov.uk/dataset/8a5139b3-e49b-47bd-abba-d0199b624d8a/beis-heat-networks-planning-database (Accessed May 2024)
Brownsort, P (2018). Negative Emission Technology in Scotland: CCS for Biogenic CO2. SCCS. Available at: www.sccs.org.uk//Negative_Emission_Technology_in_Scotland.pdf
(Accessed May 2024)
CCSL (2024). Carbon Capture Sites. Carbon Capture Scotland Ltd. Available at: www.carboncapture.scot/capture-sites (Accessed May 2024)
CDR.fyi (2024). Trending on Track? 2023 Year in Review – CDR market continues to see explosive growth. Available at: www.cdr.fyi/blog/2023-year-in-review (Accessed Feb 2022)
Dee, S et al (2005). Best practice in structural geology analysis. First Break, 23, 4.
DESNZ (2024). Energy Trends: UK renewables – Renewable electricity capacity and generation for 2023. Available at: www.gov.uk/government/statistics/energy-trends-section-6-renewables (Accessed May 2024)
DUKES (2022). Digest of UK Energy Statistics (DUKES): Renewable Sources of Energy, DUKES Chapter 6: Statistics on Energy from Renewable Sources. Department for Energy Security and Net Zero. Available at: www.gov.uk/government/statistics/renewable-sources-of-energy-chapter-6-digest-of-united-kingdom-energy-statistics-dukes (Accessed May 2024)
EC (2007). Sustainable power generation from fossil fuels: aiming for near-zero emissions from coal after 2020. European Commission Communication, January 2007. Available at: eur-lex.europa.eu/legal-content/EN/TXT/?uri=celex:52006DC0843 (Accessed May 2024)
Eke, P et al (2011). CO2 brine dissolution and injection for storage. SPE Project F&C, 41-53.
ENDS (2024). ENDS Waste & Bioenergy. Available at: www.endswasteandbioenergy.com (Accessed May 2024)
Energyst (2023). Iona Capital invests in biogenic CO2 pioneers Carbon Capture Scotland. Available at: theenergyst.com/iona-capital-invests-in-biogenic-co2-pioneers-carbon-capture-scotland (Accessed May 2023)
GCCSI (2021). Technology Readiness and Costs Of CCS. Report. Available at: www.globalccsinstitute.com/wp-content/uploads/2021/03/Technology-Readiness-and-Costs-for-CCS-2021-1.pdf (Accessed May 2024)
Gibbins, J et al (2024). Evidence Review of Emerging Techniques for Carbon Dioxide Capture using Amine-Based and Hot Potassium Carbonate Technologies under the IED for the UK.
HSE (2024). Agency agreements, memoranda of understanding and concordats, and working arrangements protocols. Health and Safety Executive. Available at: www.hse.gov.uk/agency-agreements-memoranda-of-understanding-concordats/index.htm#pageContainer (Accessed May 2024)
IEAGHG (2024). Techno-Economic Assessment of Small-Scale Carbon Capture for Industrial and Power Systems. Report. Available at: ieaghg.org/publications/techno-economic-assessment-of-small-scale-carbon-capture-for-industrial-and-power-systems/ (Accessed May 2024)
Keenan, H (2023). The Lybster Field: A prospect for CO2 storage in the Inner Moray Firth, Scotland. MSc Thesis, Supervisor Gilfillan, S. School of GeoSciences, University of Edinburgh.
Lehtveer, M & Emanuelsson, A (2021). BECCS and DACCS as Negative Emission Providers in an Intermittent Electricity System: Why Levelized Cost of Carbon May Be a Misleading Measure for Policy Decisions. Frontiers in Climate, 3.
Low, J (2024). Pathways to decarbonising heat and transport in Scotland using hydrogen. PhD thesis, University of Edinburgh.
Monaghan, A et al (2012). New insights from 3D models at analogue CO2 storage sites in Lincolnshire and eastern Scotland, UK. Proceedings of the Yorkshire Geological Society, 59.
MVV (2024). Range €80-€110/tCO2 provided by MVV Environmental for a 700 ktpa capacity EfW in Mannheim, Germany. MVV Environmental pers comm.
NNFCC (2023). The Official Information Portal on Anaerobic Digestion. Available at: www.biogas-info.co.uk/resources/biogas-map/ (Accessed May 2024)
Ofgem (2024a). Renewables Obligation (RO) Annual Report 2022-23 – (Scheme Year 21). Available at: www.ofgem.gov.uk/publications/renewables-obligation-ro-annual-report-2022-23-scheme-year-21 (Accessed May 2024)
Ofgem (2024b). Renewables and CHP Register (2024). Accredited Stations. Available at: renewablesandchp.ofgem.gov.uk/Public/ReportManager.aspx (Accessed May 2024)
Patterson, J & Paisley, R (2016). CO2 EOR policy and regulations in Scotland, SCCS Report.
REPD (2024). Renewable Energy Planning Database (REPD): January 2024. DESNZ. Available at: www.gov.uk/government/publications/ (Accessed May 2024)
Ricardo (2023). Negative Emissions Technologies (NETS): Feasibility Study. Report. Available at: www.gov.scot/publications/negative-emissions-technologies-nets-feasibility-study/ (Accessed March 2024)
SEPA (2022). Scottish Pollutant Release Inventory 2022 Full data. Available at: www.sepa.org.uk/environment/environmental-data/spri/ (Accessed May 2024)
SG (2022). Securing a green recovery on a path to net zero: climate change plan 2018–2032 – update. Available at: www.gov.scot/publications/securing-green-recovery-path-net-zero-update-climate-change-plan-20182032/ (Accessed May 2024)
Smith, M et al (2011). CO2 aquifer storage site evaluation and monitoring. CASSEM Report.
Stolaroff et al (2021).
Statista (2024). Bioenergy. Available at: www.statista.com/outlook/io/energy/renewable-energy/bioenergy/worldwide (Accessed May 2024)
Storegga (2022a). Mitsui and Storegga Conclude Memorandum of Understanding on Commercialization of Direct Air Capture Technology. Press release, March 2022. Available at: storegga.earth/news/2022/press-releases/ (Accessed June 2024)
Storegga (2022b). Project Dreamcatcher – Low Carbon Direct Air Capture. Phase 1 Report. Available at: www.gov.uk/government/publications/direct-air-capture-and-other-greenhouse-gas-removal-technologies-competition (Accessed June 2024)
Su et al. (2023). Thermal integration of waste to energy plants with post-combustion CO2 capture. Available at: www.sciencedirect.com/science/article/pii/S0016236122028289 (Accessed May 2024)
Tolvik (2024). UK Energy from Waste Statistics – 2022. Available at: www.tolvik.com/published-reports/ (Accessed 4 June 2024)
UK Environment Agency (2021). Post-combustion carbon dioxide capture: emerging techniques. Available at: www.gov.uk/guidance/post-combustion-carbon-dioxide-capture-best-available-techniques-bat. Published: 2 July 2021, Last updated: 27 March 2024 (Accessed May 2024)
WP (2024). The world’s largest carbon-capture plant just switched on. Washington Post, 9 May 2024. Available at: www.washingtonpost.com/climeworks-mammoth-carbon-capture/ (Accessed 17 June 2024)
Watt, I et al (in preparation). Lybster CCS Prospect. Powerpoint summary presentation for Carbon Capture Scotland Limited. Supervisor Gilfillan, S. School of GeoSciences, University of Edinburgh.
Whisky Invest Direct (2024). Malt whisky distilleries in Scotland. Available at: www.whiskyinvestdirect.com/about-whisky/malt-whisky-distilleries-in-scotland
(Accessed: May 2024)
Appendices
Appendix A Background on the CCS Directive
Pioneering work on CCS legislation in the EU was undertaken by the UK with the implementation of the UK Energy Act 2008. The Energy Act established a national regulatory framework for offshore CO2 storage with sufficient flexibility to transpose the anticipated CCS Directive. Directive 2009/31/EC on the geological storage of carbon dioxide was adopted by the EU Council of Ministers in 2009. The CCS Directive was transposed to UK law in 2012 and also incorporated into the Agreement on the European Economic Area. The EEA includes significant storage activity in Norway and Iceland. Despite recent changes in EU membership, the CCS Directive provides a common framework across Europe for offshore CO2 storage.
The CCS Directive applies to onshore and offshore geological storage of CO2 within a country, including exclusive economic zones and continental shelves. Member States that choose to permit storage must carry out an assessment of their regional potential storage capacity. Member States retain the right not to allow storage in their territories. Member States are required to report to the Commission on the implementation of the CCS Directive every four years. The Commission shares the progress with the Parliament and the Council. The 3rd report noted that the CCS Directive had been transposed into the national law of sixteen Member States by 2017. As of the 4th report, released in October 2023, only nine countries, Germany, Estonia, Ireland, Cyprus, Latvia, Lithuania, Austria, Finland, and Slovenia, prohibit the geological storage of carbon dioxide. Germany, 23% of EU fossil CO2 emissions, announced a carbon management strategy in 2024 to support CCS and currently plans to export CO2 for storage, primarily via the Rhine-Delta Corridor. The 4th report concluded that the CCS Directive had been correctly applied from 2019 to 2023 across the EU, acknowledging progress in Europe on the development and exploration of CO2 storage sites, and support for storage projects in most European countries.
DG CLIMA have commissioned DNV to revise the CCS Directive guidance documents to reflect the current understanding of CCS and remove ambiguities identified during the development of the first CCS projects in the EEA. Outcomes of the revision can be expected in 2024. The revised guidance documents aim to support operators and competent authorities in the practical implementation of permitting storage.
Appendix B Analysis of UK licensing
The Energy Act 2016 assigned the role of regulator to the Oil & Gas Authority (OGA) including related infrastructure such as CO2 pipelines. The OGA issued seven CO2 storage appraisal licences between 2012 and 2022. The North Sea Transition Authority (NSTA) issued a further 21 appraisal licences in 2023.
The UK’s Oil & Gas Authority (OGA) has issued 28 storage appraisal licences since 2012[3], of which 27 are active, with most having been issued through the NSTA carbon storge licensing round in 2023. The OGA issued the first CO2 storage licence, CS001, in 2012[4]. The licence permitted BP to drill a single appraisal well in the Bunter aquifer, southern North Sea, to assess storage for White Rose, a post-combustion capture project on coal power at Drax. Prior to this, large CCS projects had been proposed for Scotland at Longannet (Scottish Power, coal, 2008) and Peterhead (BP, H2 and EOR, 2005). Neither progressed to a storage appraisal before funding support was withdrawn.
Licence CS002 was also issued in 2012, to Shell for the Goldeneye oil field and Peterhead project[5]. Both CS001 and CS002 progressed to FEED and were rumoured to be close to positive final investment decisions (FIDs) when funding was withdrawn with the cancellation of the £1bn CCS competition in 2015. These two licenses suggest an appraisal timeframe of around 4 years for these early projects. The publicly available CS001 and CS002 documents do not include a description of the technical requirements or staging of the appraisals.
The OGA extended CS001 in 2018 for the Endurance project and went on to issue CS003-CS007 by the end of 2021, prior to rebranding as the North Sea Transition Authority (NSTA) in March 2022[6]. The new licenses enabled storage appraisals for the Track-1 and Track-2 clusters, namely Endurance (BP), Acorn (Storegga), Hamilton (Eni), and Viking (Harbour Energy), as well as two Bunter prospects (BP). The latter, CS006 and CS007, appear to be build-out capacity for the Track-1 East Coast Cluster. We note that the Track licenses balance appraisals of saline aquifers, Bunter and Acorn, with appraisals of depleted gas fields, Hamilton and Viking. The second tranche of licences document the staging of appraisals, and the additional requirements associated with specific licenses – see Section 3 and Fig 6.2.
Overlooking the years of appraisal for Acorn and Endurance prior to 2021, the four storage appraisals associated with the Track-1 and Track-2 are identical at 4 years. The licence holders must apply for a storage permit or relinquish the area at the end of the appraisal. The less mature Bunter prospects, CS006 and CS007, are licensed for 6 and 8 years respectively. Both include 3D seismic acquisition and appraisal well drilling as additional requirements.
The NSTA became the UK competent authority and storage regulator in 2023. This extended the role of the NSTA to mentoring aspirant storage operators and stewarding offshore storage from the start of appraisal to the end of operational liability with the transfer of the site ownership to the state on closure, subject to meeting the terms of licence.
The seven early licenses prepared the ground for the NSTA to issue 21 licenses in 2023, CS008-CS028. Nominations closed in May 2022. The NSTA launched the licensing round in June 2022. Applications closed September 2022 and licences were offered in May 2023.
The outliers are CS011 (Storegga, Acorn East, 2 years) and CS025 (BP, Bunter Closure 42, 8 years). 25 of the licences are in the North Sea: 18 in the southern North Sea, 3 in the central North Sea, and 4 in the northern North Sea. There are 2 licences in the East Irish Sea.
Appendix C Questions and Answers on Scots Law
C1. How was the UK North Sea divided at devolution for the purpose of renewables?
There are essentially two boundaries between Scotland and England in the North Sea. One determines which courts would be responsible in the event of criminal or civil matters arising out of offshore oil and gas operations – the Civil Jurisdiction (Offshore Activities) Order 1987 and the Criminal Jurisdiction (Offshore Activities) Order 1987.
The other is derived from the arrangements made at the time of devolution to delineate those parts of the territorial sea and the EEZ that would be treated as waters adjacent to Scotland and those which would not for purposes of environmental protection and the regulation of fisheries – namely the Scottish Adjacent Waters Boundaries Order 1999.
The area subject to Scottish jurisdiction is less in the case of the 1999 Order. It is important to note, however, that the 1987 Orders were made under the Oil and Gas (Enterprise) Act 1982 (as well as under the Continental Shelf Act 1964) and confer jurisdiction on the civil and criminal courts respectively in relation to “relevant acts”, which are defined (now by s11(2) of the Petroleum Act 1998) as “activities connected with the exploration of, or the exploitation of the natural resources of…the [sea]bed…or the subsoil beneath it”. Note that section 11(3) is so worded as to make it clear that it applies to installations involved in CCS.
By contrast, the equivalent Orders dealing with civil and criminal jurisdiction in relation to offshore renewable installations which were passed in 2009 utilise the same boundaries as the 1999 Order insofar as they seek to reflect the division of powers in relation to such installations as between Westminster and the Scottish Ministers (see the Civil Jurisdiction (Application to Offshore Renewable Energy Installations etc) Order 2009, and the Criminal Jurisdiction (Application to Offshore Renewable Energy Installations etc) Order 2009).
One could argue that this arrangement is not very tidy, but there does not appear to be any active dispute about it. Were there ever to be Scottish independence, however, and the matter of the location of what would now become the international maritime boundary required to be resolved, existing boundaries drawn for internal administrative and jurisdictional purposes would not be determinative and could, indeed, provide arguments respectively for those seeking more northerly or southerly solutions—albeit interestingly that those specifically relating to offshore oil and gas installations would appear to suggest a more southerly boundary. It would essentially be a matter to be agreed between Scotland and the rest of the UK as part of an overall settlement involving the division of assets and liabilities.
C2. Is CO2 storage in Scottish territorial waters already in the Scottish competence under the Energy Act 2008? Does Scotland require additional legislation for storage, such as transposing or adopting the CCS Directive to Scots law?
Scottish Ministers are clearly established as the licensing authority in relation to CO2 storage for the territorial sea adjacent to Scotland by s18 of the Energy Act 2008. The Storage of Carbon Dioxide (Licensing etc.) Regulations 2010, however, do not apply to this area, insofar as they define a “licence” as a licence granted by the authority (now NSTA/OGA) in relation to “a controlled place which is not in, under or over the territorial sea adjacent to Scotland” (Reg. 1(3)). Further legislation would therefore be required were Scottish Ministers minded to operate as the licensing authority for this area, albeit that there would be good reasons simply to mirror the existing regulations.
C3. What are the Scottish Ministers responsible for within the 12 nm limit? Sea surface to seabed? All fish, water, and benthic quality from land outfalls into sea?
Given the way in which powers have been allocated between UK and Scottish bodies, it is not possible to give a once and for all answer to this question. In terms of international law, the UK as the coastal state, enjoys sovereignty in the territorial sea which includes the seabed, the subsurface and the water column (subject only to, for example, rights of innocent passage). How the UK decides to exercise that sovereignty, however, is a matter for it and this becomes complex in the context of devolution. Thus, while Scottish Ministers undoubtedly have responsibility for, say, environmental issues in the territorial sea adjacent to Scotland, this needs to be read in conjunction with the environmental responsibilities in the hands of OPRED in the context of oil and gas operations in the same space.
C4. Who has responsibility and rights for the sub-seabed, mineral oil and gas rights?
Oil and gas under the territorial sea adjacent to Scotland as with all such resources wheresoever located in the UK, onshore or offshore, are vested in the Crown. Whereas Scottish Ministers did receive licensing powers for oil and gas in the post-referendum settlement in the context of the Scotland Act 2016, this was explicitly only in relation to the “onshore area”, defined as lying “within the baselines” of the territorial sea (s47). Thus, licensing in relation to all offshore oil and gas, within the territorial sea and under the continental shelf, is a matter for the NSTA/OGA.
C5. Does Scotland need its own regulator and competent authority? Or can those services be purchased from the UK government?
Purchasing the services of the NSTA/OGA would still require there to be appropriate regulations covering the territorial sea adjacent to Scotland and may raise political considerations. For example, if it is seen as expedient to make use of the UK regulator for this function, the question would arise as to where else such an approach might be appropriate – industry generally would like to deal with fewer regulators and to have to adapt to fewer jurisdictional variations. This could, of course, be countered by pointing to the very specific nature of the issue at hand where the long experience of the NSTA/OGA and its predecessors is an important consideration. Another way of looking at this, however, would be to consider whether an agreement could be reached between, say, Marine Scotland and the NSTA/OGA to deal with carbon licensing in territorial waters adjacent to Scotland (again on the basis that appropriate regulations are in place for the territorial sea adjacent to Scotland). There is a precedent for such an approach, effected by Memorandum of Understanding between the HSE and OPRED[7] to form the Offshore Safety Directive Regulator (now OMAR) when that directive required a competent authority to deal with health and safety, and environmental risks under one roof. That, of course, involved two regulators at UK level, but there should be no objection to a similar arrangement between a UK and a Scottish regulator given the commonality of purpose and the desirability of a seamless approach.
C6. Is the natural fill of residual oil and gas in depleted gas fields owned by Scottish Ministers or retained by the Crown Estate?
Residual oil and gas remain vested in the Crown.
C7. Who holds liability for oil and gas field operations, for decommissioning, and for permanent abandonment within the 12 nm limit?
First and foremost, in the context of operations, attention will be focused on the licensee. In most cases, however, liability will be joint and several with co-venturers under a joint operating agreement. In relation to decommissioning, it is a matter of anyone who holds a section 29 notice under the Petroleum Act 1998 – again usually co-venturers, but the list is lengthened to minimise the risk that the state is left to tidy up if duty holders become insolvent. Things get more complicated in relation to any infrastructure left in place under an agreed derogation. There is no specific legislation or regulation on this matter; rather it is dealt with in the context of guidance notes issued from time to time by OPRED. Originally, the wording was as follows: “The persons who own an installation or pipeline at the time of its decommissioning will remain the owner of any residues”. More recently, it has been adapted to: “The persons/parties who own an installation or pipeline, or are a section 29 [notice] holder, at the time of its decommissioning will remain the owners of any residues and remains after decommissioning.” This is problematical on a couple of levels. For a start, either someone is the owner, or they are not. If they are merely a section 29 notice holder, they cannot without further ado suddenly become the owner. More fundamentally, there is an argument that the use of Crown Leases in the EEZ in relation to renewables and CCS constitutes an exercise of property rights in the seabed which raises the question of whether any infrastructure left in place is actually a fixture (in both Scots and English law) which belongs to the owner of the land (or seabed) to which it is attached. This has never been tested but is certainly arguable. By contrast, this would appear to be a much easier proposition to establish within the territorial sea where the Crown Estate has habitually claimed property rights and the courts have readily confirmed them. Thus, whatever is stated in the guidance notes (and, of course, essentially accepted by duty holders in the context of a decommissioning programme), property law may say something different.
C8. Does Scotland own the pore space for the Lybster field and Forth Basin?
If I am right in understanding that the Lybster field lies wholly within the 12 nm limit, then whereas the hydrocarbons in that field are vested in the Crown and those rights are exercised by the NSTA, the pore space is the property of the Crown, which property rights would be exercisable by the CES. Insofar as the Forth Basin aquifer is similarly located within the 12 nm limit, the pore space there would also be owned by the Crown and the property rights would be exercisable by CES. Note that this property law analysis also implies that CO2 injected into depleted reservoirs beneath the territorial sea would be owned by the Crown on the basis of the principle of annexation. Roddy Paisley and John Paterson wrote a report on CO2 in the context of EOR years ago in which the property dimension was more fully explored.
C9. Is Lybster administered under onshore or offshore regulation? UK or Scots law?
Insofar as the exploration for and production of hydrocarbons is involved, then the petroleum licensing at the time would have been a matter for the Secretary of State. Even now, insofar as the reservoir lies beyond the baselines for the territorial sea and thus within the territorial sea, the licensing in relation to such a reservoir would be a matter for NSTA/OGA. The siting and operation of the drilling rig onshore would then and now be a matter for the local planning authority. Thus, both UK law and Scots law are engaged as appropriate.
C10. Now that the Beatrice field is no longer in production, does Scotland own the field, which is partly in territorial waters and partly beyond the 12 nm limit?
This is a most interesting problem. The residual hydrocarbons in the field remain vested in the Crown. The pore space within 12 nm is owned by the Crown. The ownership of pore space beyond 12 nm is not clear, but from a practical perspective only the Crown has sovereign rights to act in respect of that pore space. The licensing authority within 12 nm is Scottish Ministers and beyond the NSTA/OGA. Ways forward? Some form of arrangement modelled on those for hydrocarbon reservoirs that cross boundaries. This returns us to the answer above where an MoU between Marine Scotland and NSTA/OGA was suggested.
C11. Are consents expected to be closely similar, or identical, to permissions and standards already enacted for offshore oil and gas licensing, appraisal, development, and production? Lybster must have already passed regulatory agencies inspections for oil production, water cut disposal, and gas flaring – will CO2 injection for storage be different or require a new inspection?
Given that different activities under different licensing regimes are involved, new consents would be required. It may well be, however, that insofar as existing data could be relied upon, the process would be faster. This would really be a question for those with a better insight into the technical processes.
Appendix D Timeframe analysis of European CO2 storage
Analysis of CO2 storage projects across Europe at various stages of development indicates that both the European Union’s 2030 CO2 storage target (50 Mtpa) and United Kingdom’s 2030 target (20-30 Mtpa) may be achieved if storage development deadlines are met and expected storage rates are slightly exceeded. The addition of large storage projects in Norway and Iceland will very likely be necessary to meet EU demand and provide a contingency against capacity shortfalls. Planned storage capacities for Norway, Denmark, and Iceland vastly exceed domestic emissions, indicating an ambition to establish large CO2 import markets.
On average, megaton-scale European projects store 2-4 Mtpa. At the national level, results range from Bulgaria (P10 optimistic, 0.8 Mtpa) and Greece (P50 expected, 1 Mtpa), to Iceland (P10 optimistic, 2 Mtpa) and Norway (P50 expected, 15 Mtpa). The data indicates that the European Economic Area (EEA) and United Kingdom are on track to deliver regional storage rates of 18-106 Mtpa by 2030, with an expected P50 forecast of 58 Mtpa, i.e. slightly less than the 70-80 Mtpa aggregated net zero target for the EU and UK. Regionally significant storage in the North Sea remains a mainstay for the Netherlands (P50 4.5 Mtpa), the UK (P50 22.5 Mtpa), and Denmark (P50 12.2 Mtpa, of which 3 Mtpa is offshore). The emergence of onshore storage ambitions for Denmark (4-14 Mtpa) is an interesting development. It is notable that the UK, Norway, and Denmark contribute 44% of total storage. Only six EU27 countries are planning megatonne-scale projects. Portugal, Spain, Germany, and Poland, 45% of EU CO2 emissions, have no large projects planned – Table D.1.
Table D.1. Storage rates for the 32 projects on track to potentially deliver storage by 2030.
|
NORWAY, EEA |
Start |
SRMS, Mtpa: |
P90 |
P50 |
P10 |
Storage |
Operator |
Type |
2040s, Mtpa |
|
Sleipner |
1996 |
On Injection |
0 |
0.8 |
1 |
Utsira Fmn |
Equinor |
SAQ |
0 |
|
Snøhvit |
2008 |
On Injection |
0.2 |
0.5 |
0.8 |
Stø Fmn |
Equinor |
SAQ |
0 |
|
Northern Lights |
2025 |
FID, PCI, CEF |
1.2 |
3.6 |
5 |
Johansen Fmn |
Equinor |
SAQ |
5 |
|
Smeaheia |
2028 |
EXP, EXL002 |
0 |
2.5 |
5 |
Sognefjord Fmn |
Equinor |
SAQ |
20 |
|
Havstjerne |
2029 |
EXP, EXL006 |
0 |
3 |
5 |
Sandnes, Bryne Fmns |
Wintershall DEA |
SAQ |
10 |
|
Trudvang |
2029 |
EXP, EXL007 |
0 |
0.8 |
1.5 |
Utsira Fmn |
Sval Energi |
SAQ |
10 |
|
Barents Blue |
2030 |
EXP, EXL003 |
0 |
1 |
2 |
Stø Fmn |
PUN |
SAQ |
9 |
|
Luna |
2030 |
EXP, EXL004 |
0 |
2.5 |
5 |
Johansen Fmn |
Wintershall DEA |
SAQ |
5 |
|
Poseidon |
2030 |
EXP, EXL005 |
0 |
0 |
2.5 |
Rødby Formation |
Aker BP |
SAQ |
5 |
|
UNITED KINGDOM |
Start |
SRMS, Mtpa: |
P90 |
P50 |
P10 |
Storage |
Operator |
Type |
2040s, Mtpa |
|
NEP, Endurance |
2027 |
FIP, Track 1 |
4 |
7 |
10 |
Bunter Fmn |
BP |
SAQ |
23 |
|
HyNet |
2027 |
FIP, Track 1 |
2 |
3 |
4 |
Hamilton Fields |
Eni |
DGF |
10 |
|
Acorn |
2027 |
FIP, Track 2 |
0.5 |
1 |
3 |
Captain, Wick Fmn |
Shell |
SAQ |
10 |
|
Viking |
2028 |
FIP, Track 2 |
3 |
5 |
8 |
Victor, Viking A Fields |
Harbour Energy |
DGF |
15 |
|
BTNZ |
2030 |
pre-FEED |
0 |
2 |
4 |
Hewett Field |
Eni |
DGF |
10 |
|
Morecambe |
2030 |
pre-FEED |
0 |
3 |
5 |
Morecambe Fields |
Spirit Energy |
DGF |
20 |
|
Poseidon |
2030 |
pre-FEED |
0 |
1.5 |
3 |
Leman Field |
Perenco |
DGF |
40 |
|
Orion |
2031 |
pre-FEED |
0 |
0 |
1 |
Amethyst, W Sole Fields |
Perenco |
DGF |
6 |
|
DENMARK, EU |
Start |
SRMS, Mtpa: |
P90 |
P50 |
P10 |
Storage |
Operator |
Type |
2040s, Mtpa |
|
Greensand |
2026 |
FIP |
0.5 |
1.5 |
3 |
Nini Fields |
INEOS Energy |
DOF |
8 |
|
CO2RYLUS |
2026 |
FIP |
0.1 |
0.2 |
0.5 |
Stenlille, Gassum Fmn |
GSD |
SAQ |
0.5 |
|
Bifrost |
2029 |
FEED, PCI |
0 |
1.5 |
3 |
Harald Fields |
TotalEnergies |
DGF |
10 |
|
Norne Fyrkat |
2027 |
pre-FEED, PCI |
2 |
4 |
6 |
Gassum, Gassum Fmn |
Fidelis, ROSS |
SAQ |
10 |
|
Norne Trelleborg |
2027 |
pre-FEED, PCI |
2 |
4 |
6 |
Havnsø, Gassum Fmn |
Fidelis, ROSS |
SAQ |
10 |
|
Ruby |
2028 |
EXP |
0 |
1 |
2 |
Rødby, Bunter Fmn |
BlueNord |
SAQ |
10 |
|
NETHERLANDS, EU |
Start |
SRMS, Mtpa: |
P90 |
P50 |
P10 |
Storage |
Operator |
Type |
2040s, Mtpa |
|
Porthos |
2026 |
FID, PCI, CEF |
1 |
2 |
2.5 |
P18-2,4,6 Fields |
TAQA |
DGF |
2.5 |
|
Aramis |
2028 |
FEED, PCI, CEF |
1 |
2.5 |
5 |
L10, L04-A, K14-FA |
Neptune |
DGF |
22 |
|
ITALY, EU |
Start |
SRMS, Mtpa: |
P90 |
P50 |
P10 |
Storage |
Operator |
Type |
2040s, Mtpa |
|
Callisto, Ravenna |
2027 |
FEED, PCI |
0 |
2 |
4 |
Porto Corsini Field |
Eni |
DGF |
16 |
|
ICELAND, EEA |
Start |
SRMS, Mtpa: |
P90 |
P50 |
P10 |
Storage |
Operator |
Type |
2040s, Mtpa |
|
Coda Terminal |
2026 |
FIP, IF |
0.5 |
1 |
2 |
Kapelluhraun lava field |
Carbfix |
BAS |
3 |
|
GREECE, EU |
Start |
SRMS, Mtpa: |
P90 |
P50 |
P10 |
Storage |
Operator |
Type |
2040s, Mtpa |
|
Prinos |
2026 |
FEED, PCI, IF |
0 |
1 |
2 |
Prinos, Epsilon Fields |
Energean |
DOF |
3 |
|
CROATIA, EU |
Start |
SRMS, Mtpa: |
P90 |
P50 |
P10 |
Storage |
Operator |
Type |
2040s, Mtpa |
|
GT CCS |
2031 |
pre-FEED, PCI |
0 |
0 |
0.3 |
Bockovac |
Nexe |
SAQ |
0.7 |
|
Ivanić Grad |
2026 |
Pre-FEED |
0 |
0.1 |
0.2 |
Ivanić Grad Field |
MOL Group |
EOR |
0 |
|
FRANCE, EU |
Start |
SRMS, Mtpa: |
P90 |
P50 |
P10 |
Storage |
Operator |
Type |
2040s, Mtpa |
|
Pycasso |
2030 |
Pre-FEED, PCI |
0 |
0 |
1 |
Lacq Gas Field |
Teréga |
DGF |
5 |
|
BULGARIA, EU |
Start |
SRMS, Mtpa: |
P90 |
P50 |
P10 |
Storage |
Operator |
Type |
2040s, Mtpa |
|
ANRAV |
2028 |
Pre-FEED, IF |
0 |
0 |
0.8 |
Galata Field |
Petroceltic |
DGF |
1.3 |
Appendix E UK Licensing timeframe
Table E.1. UK licence timing from CS001 to CS028 (2012-2023).
|
First proposed project | |||||||||||||||||||||||
|
2002 |
2003 |
2004 |
2005 |
2006 | |||||||||||||||||||
|
DTI: Energy White Paper 2003 |
| ||||||||||||||||||||||
|
|
|
|
|
| |||||||||||||||||||
|
BP “Beyond Petroleum” |
|
| |||||||||||||||||||||
|
Peterhead gas, Miller EOR |
|
| |||||||||||||||||||||
|
UK Competitions | |||||||||||||||||||||||
|
2008 |
2009 |
2010 |
2011 |
2012 |
2013 |
2014 |
2015 |
2016 |
2017 | ||||||||||||||
|
DECC: Energy Act 2008 |
|
CCS Directive 2009 transposed |
|
BEIS: Clean Growth Strategy | |||||||||||||||||||
|
|
|
|
|
OGA: Offshore Carbon Storage Licensing, Storage of Carbon Dioxide Licensing Regulations | |||||||||||||||||||
|
£1bn Competition #1 |
|
|
|
|
|
|
| ||||||||||||||||
|
Longannet coal |
£1bn Competition #2 |
|
| ||||||||||||||||||||
|
|
[Drax, Statoil] BP, CS001 |
White Rose, Bunter 42/25 & 43/21 | |||||||||||||||||||||
|
|
|
[SSE] Shell, CS002 |
Peterhead, Goldeneye: ERA – CH – AS |
| |||||||||||||||||||
|
First six licences | |||||||||||||||||||||||
|
2018 |
2019 |
2020 |
2021 |
2022 |
2023 |
2024 |
2025 |
2026 |
2027 |
2028 |
2029 |
2030 | |||||||||||
|
|
2050 Net Zero target 2019 |
|
DESNZ: Energy Act 2023, CCUS Market Creation 2023 |
|
|
| |||||||||||||||||
|
|
|
|
|
|
NSTA: Offshore Carbon Storage Regulator & Competent Authority | ||||||||||||||||||
|
Cluster Sequencing Process |
Track 1 |
|
Track 2 |
|
|
|
|
|
|
| |||||||||||||
|
CS001* NEP, Endurance: CH |
Endurance (T1): ERA – CH – AS- PA |
CX |
ENDURANCE OPERATIONAL | ||||||||||||||||||||
|
CS003* |
Acorn: CH |
Acorn (T2) South: ERA – CH – AS – DF – PA |
Central: CH – – PA |
ACORN SOUTH OP |
CENTRAL OP | ||||||||||||||||||
|
|
Eni, CS004 |
HyNet NW: Hamilton (T1): ERA – – DF – PA |
CX |
HAMILTON OPERATIONAL | |||||||||||||||||||
|
|
|
[BP] Harbour, CS005 |
Viking (T2): ERA – CH – AS – DF – PA |
CX |
VICTOR OPERATIONAL | ||||||||||||||||||
|
[TotalEnergies, Equinor] BP, CS006 |
Bunter Closures 39 & 40: ERA – Seismic AQ – Well – CH – AS – DF – PA |
CX |
39 & 40 OP | ||||||||||||||||||||
|
[TotalEnergies, Equinor] BP, CS007 |
Bunter Closures 36 & 37: ERA – Well – Seismic AQ – Well – CH – AS – DF – PA |
CX | |||||||||||||||||||||
NSTA Carbon Storage Licensing Round #1
|
|
|
|
|
2023 |
2024 |
2025 |
2026 |
2027 |
2028 |
2029 |
2030 | |
|
|
|
|
|
DESNZ: Energy Act 2023, CCUS Market Creation 2023 | ||||||||
|
|
|
|
|
NSTA: Offshore Carbon Storage Regulator & Competent Authority | ||||||||
|
|
|
|
| |||||||||
|
|
|
Eni, CS008 |
BTNZ, Hewett: ERA – Seismic RP & AQ – Well – CH – AS – DF – PA |
CX |
HEWETT OP | |||||||
|
[Wintershall Dea, CCL] Perenco, CS009 |
Poseidon, Leman: ERA – Seismic RP – Injectivity – Wells VSP – – PA |
CX |
LEMAN OP | |||||||||
|
|
[Centrica] Spirit, CS010 |
Morecambe: ERA – Seismic AQ – – Injectivity – Firm TR & TS – – PA |
CX |
MOR’E OP | ||||||||
|
|
[Harbour, Shell] Storegga, CS011 |
Acorn East: ERA – – PA |
CX |
ACORN EAST OPERATIONAL | ||||||||
|
|
[Harbour, Shell] Storegga, CS012 |
East Mey Sub Areas 1 & 2: ERA – CH – AS – DF – Sub Area 1 PA |
SA2 PA |
CX | ||||||||
|
|
|
EnQuest, CS013 |
Magnus: ERA – CH – Assess – Define – Permit Application |
CX |
MAGNUS OP | |||||||
|
|
|
EnQuest, CS014 |
Thistle: ERA – CH – Assess – Define – Permit Application |
CX |
THISTLE OP | |||||||
|
|
|
EnQuest, CS015 |
Tern: ERA – CH – Assess – Define – Permit Application |
CX |
TERN OP | |||||||
|
|
|
EnQuest, CS016 |
Eider: ERA – CH – Assess – Define – Permit Application |
CX |
EIDER OP | |||||||
|
|
[SEEL, CCL] Perenco, CS017 |
Orion, Amethyst East: ERA – Seismic RP & AQ – Firm TR & TS – CH – AS – DF – PA |
CX | |||||||||
|
|
[SEEL, CCL] Perenco, CS018 |
Orion, West Sole: ERA – Seismic RP & AQ – Firm TR & TS – Injectivity – CH – – PA |
CX | |||||||||
|
|
|
[W’Dea] Synergia, CS019 |
Camelot, Bunter Closure 18: ERA – Seismic RP & AQ – Well – – PA |
CX |
CAMELOT OP | |||||||
|
|
|
Neptune, CS020 |
Proteus, Bunter Closure 05: ERA – Seismic RP – Well – CH – PA |
CX |
PROTEUS OP | |||||||
|
|
[Exxon] Neptune, CS021 |
Bunter Closure 13: ERA – Seismic AQ & RP – Well – Firm TR & TS – CH – – PA |
CX | |||||||||
|
|
|
Neptune, CS022 |
Caister, Bunter Closure: ERA – Seismic AQ & RP – Well – Firm TR & TS – CH – – PA |
CX | ||||||||
|
|
|
[BP] Harbour, CS023 |
Vulcan: ERA – Seismic RP – Firm Geomech & Fault & Core – CH – AS – DF – PA |
CX | ||||||||
|
|
|
[BP] Harbour, CS024 |
Audrey: ERA – Seismic RP – Firm Geomech & Fault & Core – CH – AS – DF – PA |
CX | ||||||||
|
|
|
[Equinor] BP, CS025 |
Bunter Closure 42: ERA – Seismic RP & AQ -Well – Characterise – Assess – Define – Permit Application | |||||||||
|
|
|
[Exxon] Shell, CS026 |
Sean: ERA – Seismic RP – Well – Characterise – Assess – Define – PA |
CX | ||||||||
|
|
|
[Exxon] Shell, CS027 |
Indefatigable: ERA – Seismic RP – Well – Characterise – Assess – Define – PA |
CX | ||||||||
|
|
|
[Exxon] Shell, CS028 |
Bunter Area 3S & N:ERA – Seismic RP & AQ -Well S (N) – CH S (N) – AS – – PA |
CX | ||||||||
Appendix F AOI inventory of 3D seismic and wells
AOI 1 – Lybster field area
Q11: 3D RE07112025 2007
(Proprietary, IGas PLC)
- 11/25-2 1986 dry hole 3713 m
- 11/25-1 1984 dry hole 3307 m
- 11/24b-4 2019 dry hole 963 m
- 11/24-3z,y,x,w,v, producing well
- 11/24a-2z 2004 dry hole 2098 m
- 11/24-1 1996 oil well 1884 m
AOI 1 – Beatrice area
Q11: 3D TB973D0001 1997
Q11: 3D BN803F0001 1985
(Proprietary, Repsol Sinopec)
- 11/30a-B9Z 1984 oil well 2398 m
- 11/30-7 1978 oil show 2192 m
- 11/30a-10 1990 dry hole 3461 m
- 11/30-5 1977 oil well 2372 m
- 11/30a-A26Z 1988 producer 2083 m
- 11/30-2 1976 oil well 2220 m
- 11/30a-8 1982 oil well 2495 m
- 11/30z-C2 1985 oil well 2266 m
- 11/30-4 1981 dry hole 2391 m
AOI 1 – Jacky area
- 12/21-5 1987 dry hole 2722 m
- 12/21-2 1983 oil show 3459 m
- 12/21c-6 2007 oil well 2233 m
AOI 1 – Wick area
Q12: 3D GE863F0001 1986
(Speculative, Schlumberger)
- 12/16-1 1988 dry hole 3659 m
- 12/16-2 1993 dry hole 1554 m
AOI 1, South of GE86
- 12/21-3 1984 oil show 4174 m
- 2D: 12-81-145 NW-SE
- 2D: BN/12-81-126 SW-NE
- 12/21-1 1969 dry hole 1590 m
- 2D: 12-81-144 NW-SE
- 2D: 12-86-10 SW-NE
- 12/22-3 1986 dry hole 2190 m
- 2D: A12-85-03 NWW-SEE
- 2D: A12-85-10 NW-SE
AOI 1 S of Lybster, W of Beatrice
- 11/29-1 2008 dry hole 2483 m
- 2D: 302A NW-SE
- 2D: 105A SW-NE
AOI 2 – Forth Basin area
Q25: 2D CN872D1010 1987
(Proprietary, ConocoPhillips)
- 25/26-1 1990 dry hole 2040 m
AOI 3 – Fraserburgh area
Q18: 3D PGS18002MOF 2019, Release 2029
(Speculative, PGS Exploration Ltd)
- 18/05a-1 1982 dry hole 1984
- 2D: CNS-83-125 NW-SE
- 2D: A18,19-82-25A W-E
- 18/05-2 2007 dry hole 1763 m
- 2D: A18,19-82-25 W-E
- 2D: A18,19-82-20 N-S
- Q19: 3D YC06A01902 2007
- (Proprietary, CENTURY Exploration Ltd)
- 19/01-1 1992 dry hole 3425 m
- 2D: A18,19-82-31 E-W
- 2D: A18,19-82-28A N-S
AOI 4 – Solway Firth area
Q112: 3D ES943F0001 1994
(Proprietary, ExxonMobil)
- 112/15-1 1996 dry hole 2715 m
- 2D WG932D0001 Line 151 NW-SE 1993
- 2D WG932D0001 Line 149 SW-NE 1993
- 111/15-1 1995 dry hole 1981 m
- 2D: BG942-13 SW-NE
- 2D: BG96-112-19 NW-SE
Lybster is Old Norse for “slope farmstead”. The field was named after the local village, an important herring port in the 19th Century. Premier Oil drilled the discovery well, 11/24-1, in 1996. This was one of a series of exploration successes in the 1980s and 1990s including the Fife and Angus fields, Central North Sea. The vertical discovery well tested up to 2,000 bopd of 36°API oil and was suspended. Premier was also party to the offshore extension of Wytch Farm in 1994. This made the Dorset oil field the largest onshore asset in Western Europe. The development required a five km extended reach well, the first of its kind in the UK.
Lybster was acquired by Caithness Petroleum in 2008 and, like Wytch Farm, developed from land with a 5 km extended reach well, 11/24-3z – Figure F.1. Lybster and Wytch Farm are the only onshore-offshore extended reach well developments in the UK. The Lybster structure is crossed by a northeast-southwest trending fault. The appraisal well and a short side-track tested the western half of the field which proved uncommercial. The well was re-entered in 2010 and side-tracked across the fault to twin the discovery well.
The assessment of oil fields, like storage prospects, require high quality subsurface data, with 3D seismic and well data being commonly cited as key datasets for the suitability and capacity assessment of a site. The Lybster field, in addition to its near-shore location, has both.
The well plan and production strategy for the oil field were based on a 3D reservoir model built from the RE07 seismic survey. Multiple interpretations are possible depending on the wells chosen for depth conversion of the seismic. For example, compare Figure F1 with Figure F2. While the models are similar, depths differ for the field area by as much as 60 metres.
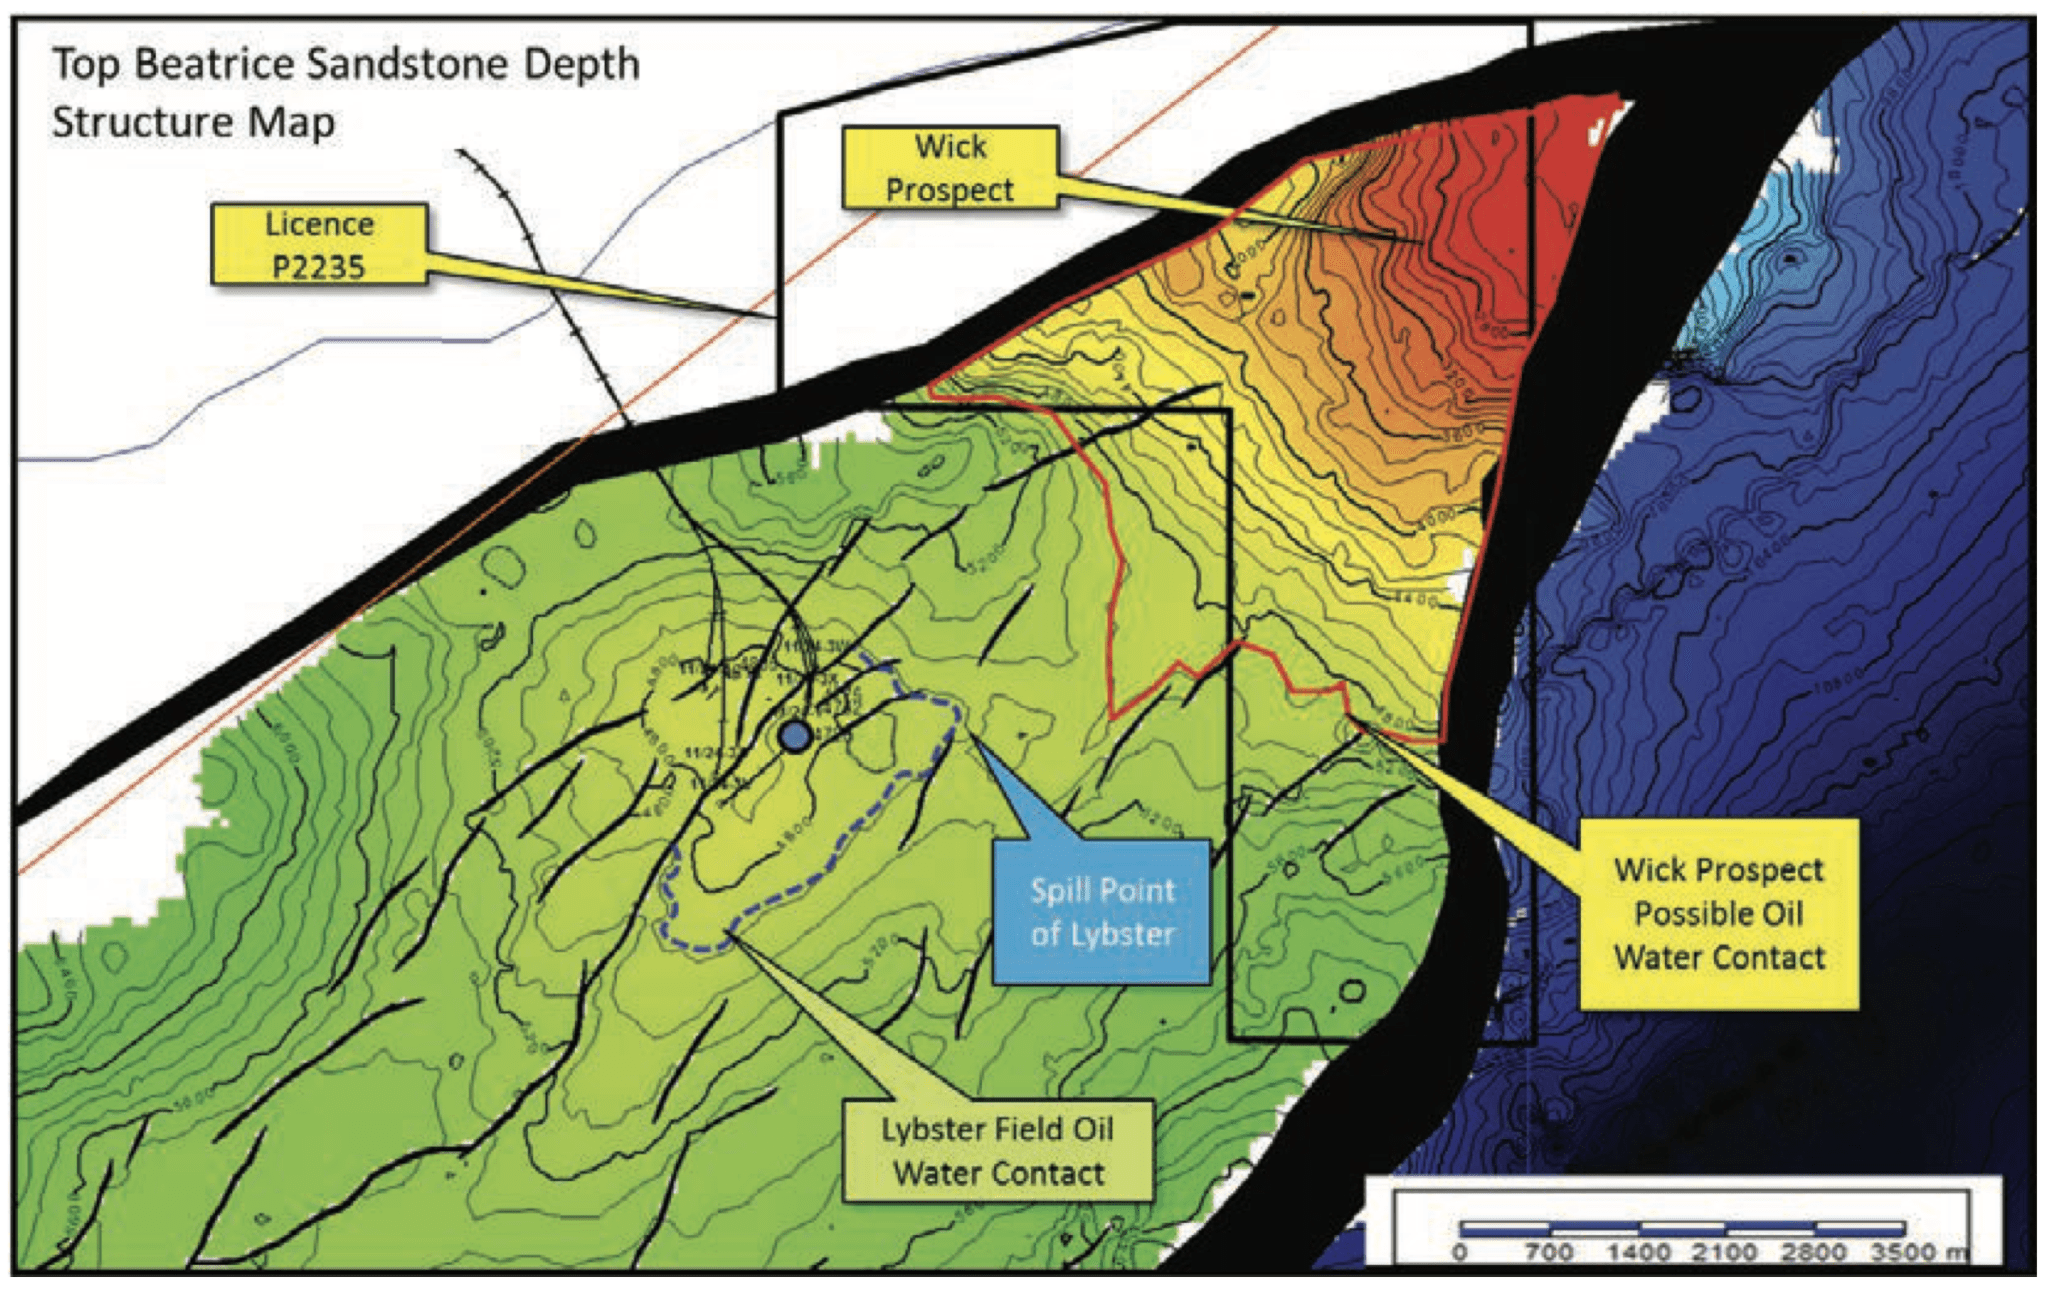
Figure F.1. A ‘top surface’ model for the RE07 3D survey by an oil company (Corallian Resources, 2018).
In the model below, the inferred oil-water contact (white line, dashed) differs from the field outline (red line). This suggests the depth conversion of the Keenan model differs from the oil company interpretation. The Keenan depth conversion of seismic two-way-time is based on a single well log and challenging, as noted by Keenan (2023). The depth uncertainty was not estimated but is likely to be of the order of tens of meters which would impact on an accurate geometric assessment of capacity and precise location of the spill point to the north.
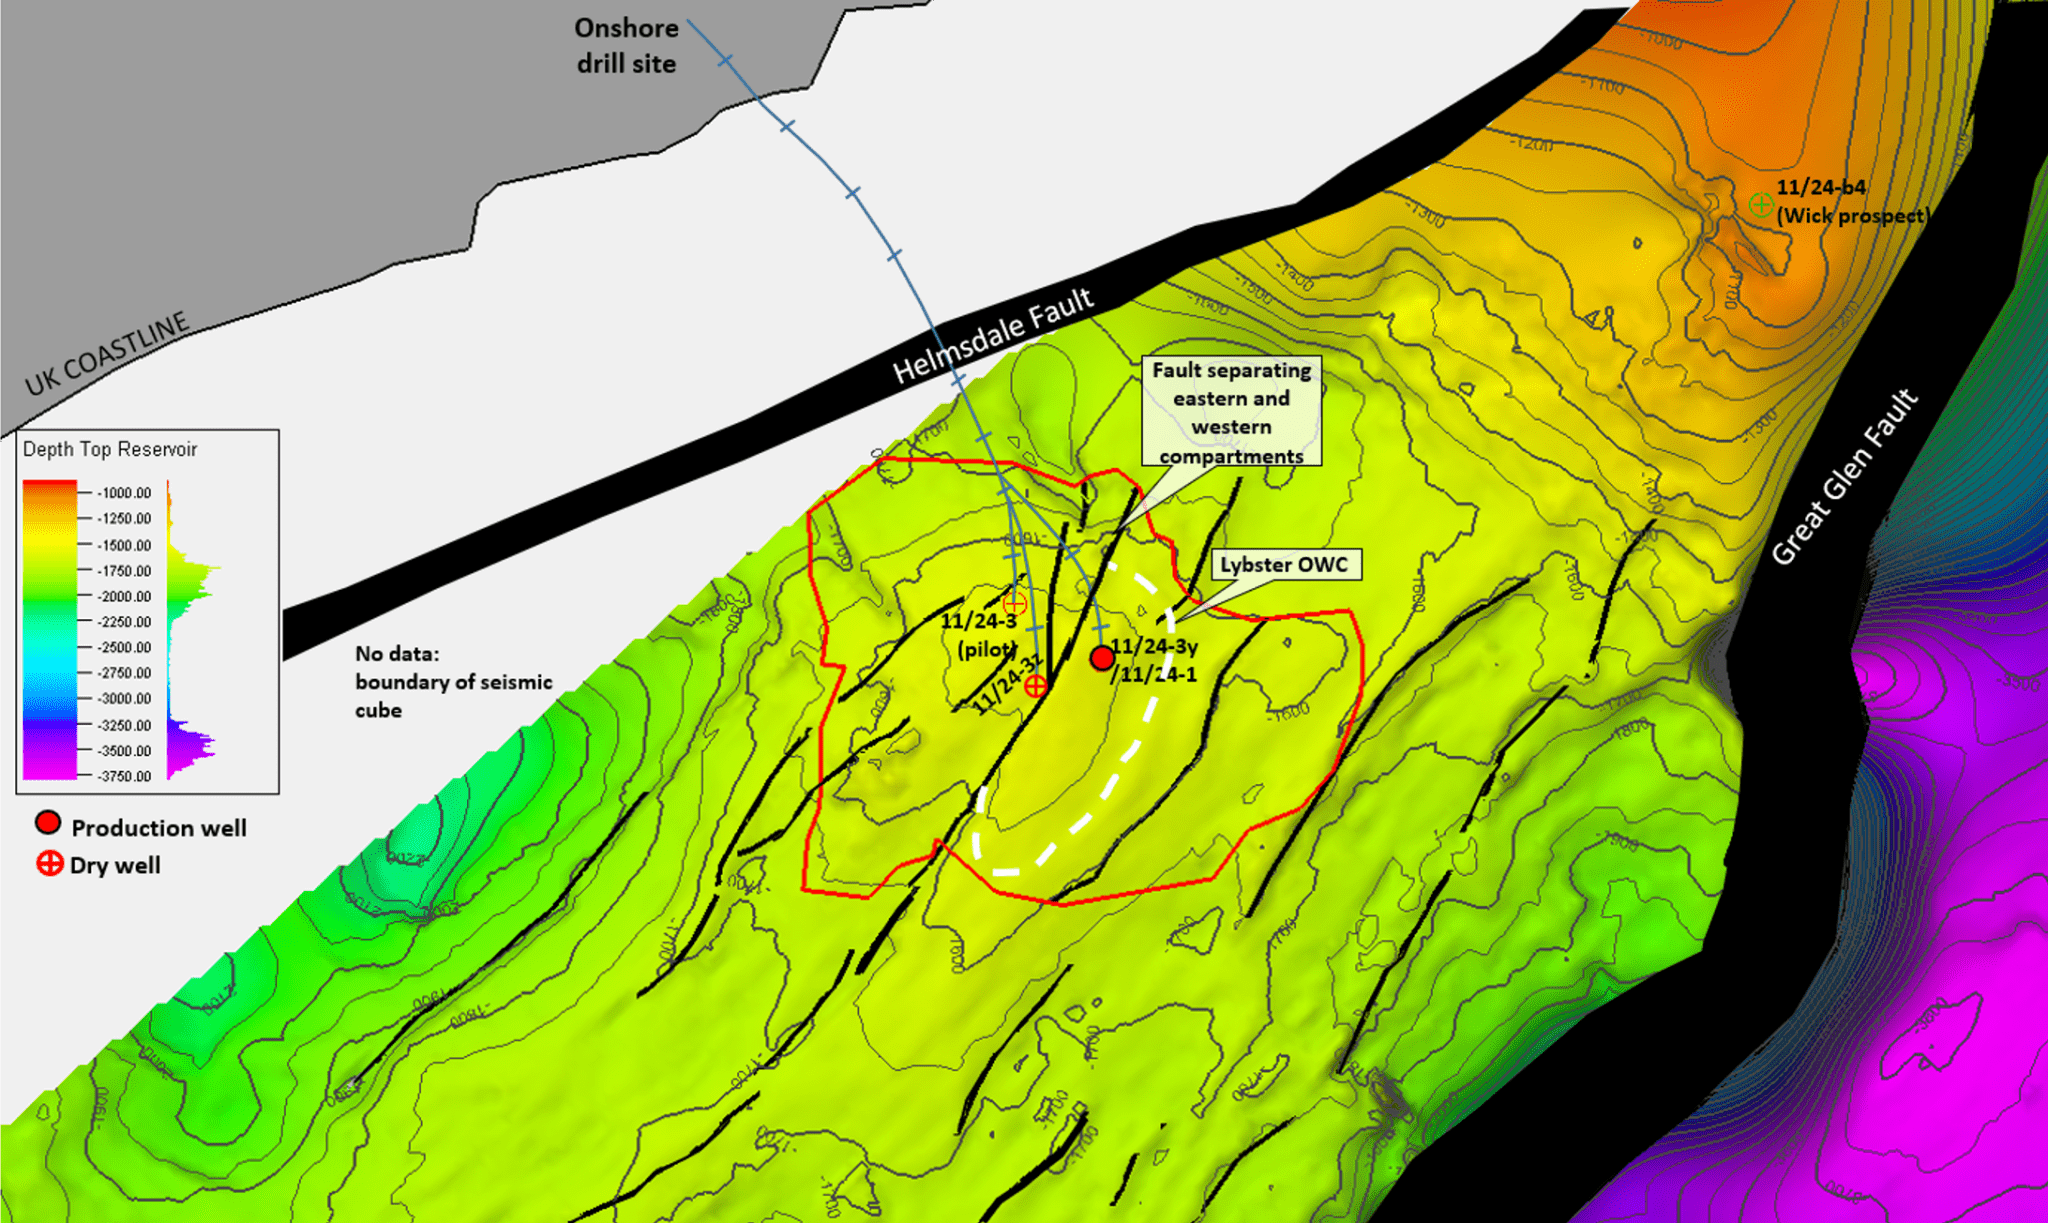
Figure F.2. A ‘top surface’ reservoir model for the RE07 3D seismic survey area by Keenan (2023).
Geological setting: The onshore Lybster area is unconformably overlain by Middle Devonian flagstones. These extremely hard, thinly interbedded siltstones and sandstones form a top to the more prospective and younger Jurassic formations below. The flagstones caused the 11/24-3 well drillers significant challenges in 2008, slowing the early hole progress, as documented in the well completion report.
The Devonian flagstones are underlain by Cretaceous carbonates and calcareous mudstones, organic rich Jurassic mudstones, coals and siltstones, Triassic sandstones and Permian sandstones, mudstones, and minor salts. Late Jurassic rifting in the North Sea resulted in large normal faults and relatively deep marine basins. At the time of this tectonic activity the Great Glen Fault and Helmsdale Fault were active as normal faults. The field is a four-way dip closed structural trap that formed at a flexure point in response to tectonic inversion of the Inner Moray Firth area. A fault separates the field into an unproductive western compartment and a proven oil-bearing eastern compartment.
The main reservoir, the Beatrice Formation, is 10-20 m thick and composed of a shallow marine sandstone sequence that lies between the Brora Coal Formation and the Heather Formation, which is of Middle Jurassic age. The upward-coarsening sandstones of the Beatrice Formation have been interpreted as marine barrier-bar and offshore-bar environments. The ‘B’ Sand is interpreted as distributary channel environment.
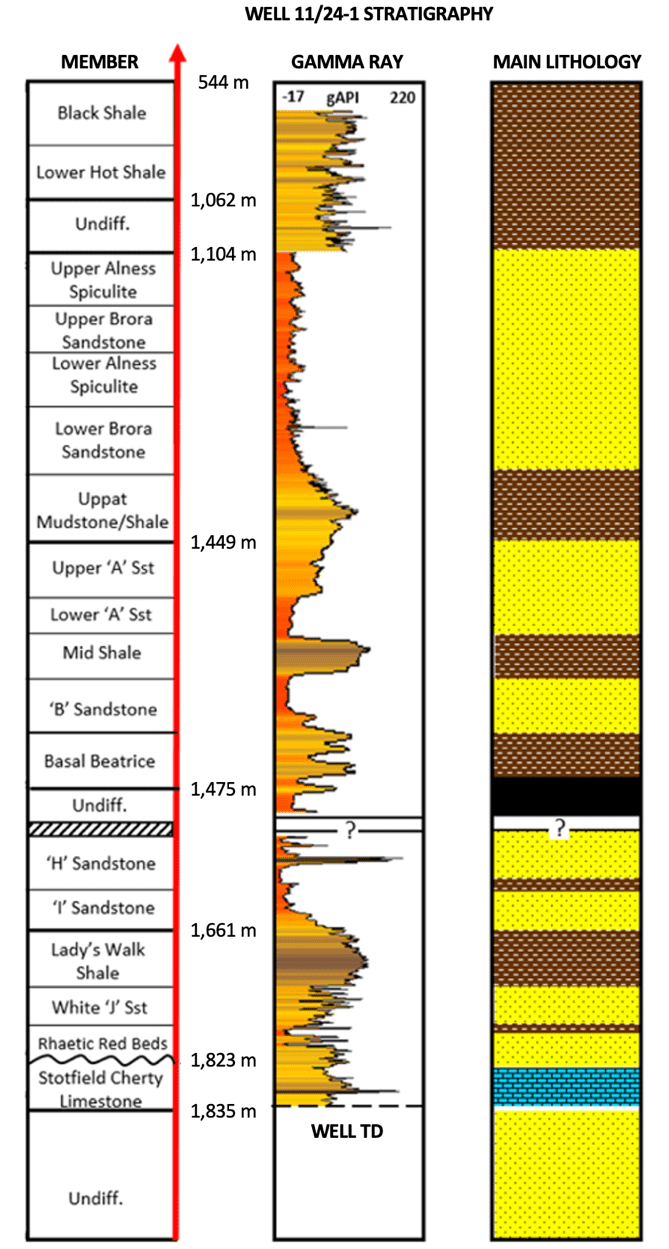 Appendix H Production history
Lybster was in production from June 2012-December 2014, with a five month pause from July-November 2013. Production averaged 184 bopd for the first 13 months, and 64 bopd for the last 13 months. Oil was transported by road tanker to Immingham for sale. An average of 0.989 mmscfpd of associated gas was flared. The field was sold to IGas in 2013. A rapidly changing production profile in Q2 2013 saw the gas cut double and water cut increase more than ten-fold from an average daily 57 m3 to over 690 m3. This led to the July 2013 well intervention. Oil production resumed in December 2013 with a declining profile from 142 bopd in January to 25 bopd in September 2014. Associated gas dropped to an average of 0.883 mmscfpd. The daily water cut doubled, increasing to 1,244 m3 in May 2014.
Field: Lybster oil field
Operator: IGas, 2013 – present
Location: Inner Moray Firth, North Sea
Category: Small, 250k barrels OOIP
Discovery: 11/24-1
Water Depth: 39 m
Discovered: Premier Oil, Repsol
Discovery: 20 Sep – 22 Oct 1996
Reservoir: Beatrice formation
Trap 4-way dip closure, 1-2°
Res Lithology Sandstones, thin shales
Reservoir Top 1,433 m / 4,700 feet
OOIP GIIP 250 kbbl, 2000 mmscf
OWC, FWL 1493 m / 4,898 feet
Quadrant/ block: 11/24
Area: 6.11 km2
Discovery: 1 exploration well
Appraisal: 1 ERW + 2 side-track
First Production: 11/24-3z, Aug 2011
Liquids: oil + flare + water
Reservoir: Mesozoic sandstones
Primary: A and B Sands
Figure G.1. Discovery well 11/24-1 summary
Poro-Perm: 15%, 200 mD
Reserves: proven – probable – possible
Oil & Condensate: 147-62-48 kbbl
Sales Gas: 734-310-243 mmscf
Oil equivalent: 274-115-90 kboe
Produced volumes
Oil (sold): 97,992 bbl
Gas (flared): 108,582 boe
Water (treated): 79,940 bbl
CO2 storage
Seal, primary: Uppat Shale, 23 m thick
Seal complex: KCF Shale, 1065 m thick
Capacity (min) – produced volume: 95 kt
Capacity (low) – structural volume: 0.35 Mt
Capacity (mid) – structural volume: 2.1 Mt
Capacity (high) – structural volume: 9.4 M
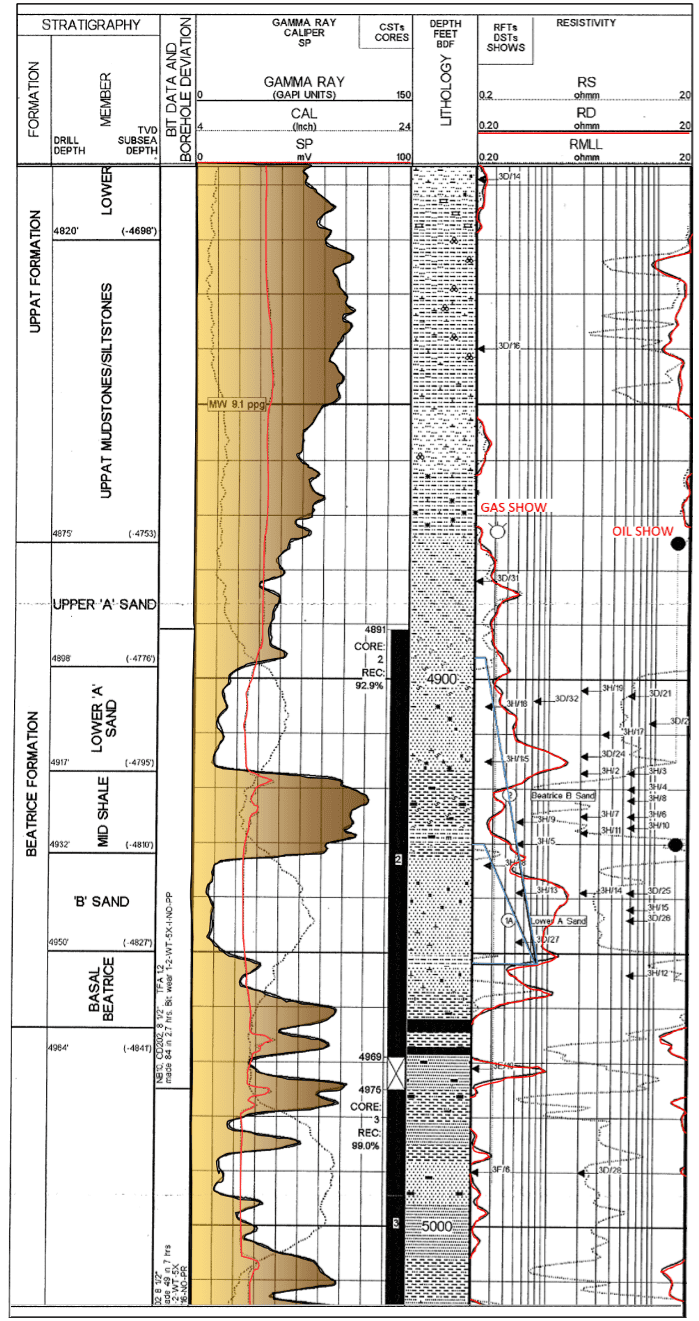
Figure G.2. Well 11/24-1 log for reservoir section and overlying seal.
Appendix I Lybster CO2 Storage Assessment
A series of interpretation techniques have been applied to establish the storage capacity and storage suitability of Lybster. The North Sea Transition Authority (NSTA) and British Geological Survey (BGS) are the primary sources for the seismic and well data that inform the analysis.
The study area is defined by the boundary of RE07112025, a 3D seismic survey acquired in 2007 across quadrant-blocks 11/24 and 11/25, encompassing an area of 306 km2 – Fig 4.1. 3D seismic is the most effective data for accurately characterising subsurface structures and reservoir connectivity (Dee, et al., 2005). The survey defines the Lybster study area as it represents the limit of the subsurface that can be geologically mapped with confidence. Site characterisation also relies on existing well data from the field and surrounding area. These provide depth-conversion calibration points for 3D models based on the seismic. Well data are provided by the North Sea Transition Authority (NSTA) and British Geological Survey (BGS) through their open access data resources.
Table I.1: Summary of wells in area and available data.
G, S, D stands for gamma, sonic, density; CS for check shot.
|
Well ID |
Type |
Depth, m |
Bottom hole Fm |
Composite |
G, S, D |
Core |
CS |
|---|---|---|---|---|---|---|---|
|
11/24-1 |
Vertical |
1920 |
Lossiemouth Fm |
Yes |
Yes |
Yes |
No |
|
11/24a-2 |
Vertical |
2111 |
Lossiemouth Fm |
Yes |
Yes |
Yes |
Yes |
|
11/24a-2z |
Deviated |
2190 |
Lossiemouth Fm |
Yes |
Yes |
No |
No |
|
11/24b-4 |
Vertical |
1000 |
Brora Coal |
Yes |
Yes |
No |
No |
|
11/25-1 |
Vertical |
3347 |
Old Red Sstn (Devonian) |
Yes |
Yes |
Yes |
No |
|
11/25-2 |
Vertical |
3749 |
Old Red Sstn (Devonian) |
Yes |
Yes |
Yes |
No |
|
11/29-1 |
Vertical |
2626 |
Top Lady’s Walk Shale (L Jurassic) |
Yes |
Yes |
No |
N/A |
|
11/30-7 |
Vertical |
2250 |
Lossiemouth Fm (Top Triassic) |
Yes |
Yes |
Yes |
N/A |
|
12/16-2 |
Deviated |
1583 |
Brora Coal |
Yes |
Yes |
No |
N/A |
|
12/21-3 |
Deviated |
4236 |
Old Red Sstn (Devonian) |
Yes |
Yes |
Yes |
N/A |
|
12/21-5 |
Deviated |
2760 |
Stotfield Chert |
Yes |
Yes |
No |
N/A |
|
12/26-2 |
Deviated |
1706 |
Base Kimmeridge Clay (U Jurassic) |
Yes |
Yes |
Yes |
N/A |
|
12/26-3 |
Deviated |
3156 |
Old Red Sstn (Devonian) |
Yes |
Yes |
No |
N/A |
Five exploration wells are located within the study area, including the Lybster discovery well, 11/24-1. A further seven wells were selected from the surrounding region, based on location and data quality, to establish the stratigraphic and structural relationship between the field and its surrounding geology. Table I.1 documents the studied wells. Each of the wells penetrate beyond the mid Jurassic strata that contains the oil field reservoir. However, few wells extend beyond the Upper Triassic, setting the stratigraphic floor for the evaluation above the Permian basement.
Premier Oil drilled the ‘wildcat’ discovery well, 11/24-1, in 1996. Production tests flowed 415-1850 barrels of oil per day from the Jurassic Beatrice Sandstones. The field was further developed in 2008 when Caithness Petroleum drilled an extended reach well, L11/24-3 and side-track, L11/24-3Z from onshore.
Both the well and side-track showed minimal oil. Caithness Petroleum re-entered L11/24-3 and drilled a second side-track, L11/24-3y, to intersect 11/24-1, the discovery well – Fig 3.2. The new side-track successfully proved hydrocarbon reserves, and in 2011 Caithness Petroleum re-entered the well to start production in 2012. The field was purchased by IGas in 2013, followed by a 5-month workover period to improve the well. However, the workover failed to prevent an increasing gas-oil ratio, and increasing water cut. IGas suspended production from the well in 2014 during a period of low oil prices.
I1 Site characterisation | Attribute suitability
Injectivity: The production history suggests good injectivity – Figure 6. The field area is in hydraulic connection with the regional aquifer. The measured permeability, 200 mD (range 10-4,000 mD) reflects the observed reservoir lithologies which are predominantly darcy-permeability sandstones with minor interbedded siltstones. Reservoir thickness is adequate at 5-25 m and the reservoir units, the Beatrice A and B Sands, extend across the basin.
Seal: The history of oil and gas retention for many millions of years at Lybster and Beatrice is evidence for a highly suitable seal. The Uppat Shale is 23 m thick in well 11/24-1. The caprock was not sampled at Lybster but a 13 m core is available from Beatrice, well 11/30a-8. The shale was described as homogeneous but not tested for permeability – Appendix F.
Faults: The main fault that bisects the field is considered to be sealing as the western half of the field contains no hydrocarbons. A number of smaller associated faults lie within the field boundary. Two risks associated with faults, leakage and seismic reactivation, need to be de-risked at appraisal with a fault analysis study including a geomechanical assessment.
Wells: The discovery well, 11/24-1, was plugged with three cement isolation barriers, abandoned, and cleared to seabed in 1996. As such, it does not represent a leakage risk but cannot be repurposed for CO2 injection. The production well, 11/24-3y, is suspended with its surface infrastructure in place. A dedicated study on the suitability for repurpose as a CO2 injector needs to be to a condition of an appraisal licence.
CO2 density: The field depth, 1,430 m, is ideal for dense phase CO2 storage. The reservoir temperature and pressure, 47 °C and 15 MPa, mean that the reservoir CO2 density will be 725 kg/m3. This will make it highly miscible with the residual oil, 726 kg/m3. The CO2 will trap between the existing natural gas cap, 110 kg/m3, and porewater below, 1030 kgm3. This sandwich configuration is an ideal fluid trap for a depleted oil field. The oil-free area to the west of the fault will function as saline aquifer store with about 90% of the supercritical CO2 rising to trap beneath the caprock, and about 10% dissolving into the surrounding porewater.
Migration: The four-way dip trap geometry is ideal for preventing lateral migration. The structural spill point is to the northeast of the field at 1,500 m: a saddle to the up-dip Braemore prospect. The expected capacity, 2 Mt, assumes no fill beyond the oil-water contact at 1490 m. The appraisal licence will require a site boundary that is likely to be defined by the structural spill point and dynamic simulation of the expected plume extent.
Location: The near-shore location and proximity to sources of high-value bio-CO2, primarily from local distilleries, makes the location exceptional. Access by road places requirements and limits on annual injection rates relating to trucked loads and on-site temporary storage.
Monitoring: Not assessed. The monitoring location for the storage area is in shallow waters of around 40 m depth. This will require a suite of geophysical equipment suited to the local environment. The appraisal licence will require a plan for monitoring storage that focuses on the injection well and remote monitoring from the surface.
Intervention: Not assessed. The requirements and cost of intervening in the case of poor well performance or unexpected migration out of the storage complex has not been assessed.
I2 Site characterisation | Capacity estimate
Structural Volume
Storage area 3 km2 (Assumes only half the field area of 6 km2 is available)
Net thickness 15 m (Assumes an average value from the range: 5-25 m)
Porosity 15% (Assumes an average value from the range: 8-22%)
Net to Gross 68% (Estimated from the gamma ray log for 11/24-1)
CO2 density 725 kg/m3 (Dense phase at ambient reservoir conditions)
Saturation 62.5% (Assume an average value from the range: 50-75%)
High CO2 capacity, optimistic: 9.4 Mt = 6E06 x 21 x 0.19 x 0.76 x 740 x 0.70 kg
Mid CO2 capacity, expected: 2.1 Mt = 3E06 x 15 x 0.15 x 0.68 x 725 x 0.625 kg
Low CO2 capacity, pessimistic: 0.35 Mt = 1.5E06 x 9 x 0.11 x 0.6 x 710 x 0.55 kg
Produced Volume
Produced reservoir fluids 131,227 m3 (Oil: 14%, Gas: 76%, Water: 10%)
CO2 density, reservoir conditions 725 kg/m3 (Pressure: 15 MPa, Temp: °47 C)
Minimum and highly conservative: 95.1 kt = 131,227 m3 x 725 kg/m3
STRUCTURAL VOLUME: A structural volume estimate of storage capacity assumes the pore space is available for CO2. A mid-range value of 2.1 Mt indicates the potential for a reasonably sized CO2 storage project. The limitations and range assumptions for the pore volume estimate should be accounted for within the low estimate which assumes the smallest area and poorest reservoir quality, representing a minimum capacity of 350,000 tonnes of CO2.
PRODUCED VOLUME: The fluid replacement capacity for a produced field is often useful in establishing a reliable ‘proven’ storage capacity estimate, based on known volumes which have been produced from the reservoir. However, the Lybster field was in production for a surprisingly brief period, which means that a production volume estimate will be extremely low, and hardly representative of the available pore volume. A storage capacity of 95,100 tonnes is estimated from produced volumes of oil, gas, and water using this method.
I3 Site characterisation | Stratigraphic analysis
An assessment of the stratigraphy was completed using composite logs, geophysical logs, core photographs, and published studies (Thomson & Underhill, 1993; Richards, et al., 1993; Tamas, et al., 2022). Where data gaps existed within the study area, wells from the surrounding region with a similar stratigraphy were looked at as analogues for Lybster.
The Lybster site assessment uses standard criteria established in previous CO2 storage projects (Chadwick, et al., 2008; Alcade, et al., 2021; IEAGHG, 2022). Lybster attributes are assessed using a traffic light, where green indicates favourable properties, red indicates unfavourable properties, and orange indicates intermediate values. Table I2 documents the outcomes for storage criteria.
Table I.2: Traffic light assessment of reservoir and seal attributes for CO2 storage
|
Parameter |
Value |
Aspect of storage |
|
Depth |
1433 m |
Storage capacity |
|
Thickness (net) |
15 m, 5 – 25 m |
Storage capacity, injectivity |
|
Porosity |
15%, 8 – 22% |
Storage capacity |
|
Permeability |
200 mD, 10 – 4000 mD |
Injectivity |
|
CO2 density |
725 kg/m3, supercritical |
Storage capacity |
|
Rock type |
Sandstone with siltstones |
Storage efficiency |
|
Seal lithology |
Low permeability mudstone |
Containment |
|
Seal thickness |
23 m in well 11/24-1 |
Containment |
Secondary reservoir: The Brora Sandstone and Alness Spiculite members display good reservoir characteristics as indicated by their low-gamma ray values and lithologies, but poor permeability within the two formations suggests a reservoir quality unsuitable for CO2 storage.
Secondary seal: The Kimmeridge Clay Formation exists as a thick regional succession of fine siltstones and mudstones above the Uppat Mudstones. A stable gamma-ray curve in all well logs is indicative of a homogenous, low-porosity formation, suitable for a secondary seal.
I4 Site characterisation | Structural analysis
A four-way dip closure, or dome, associated with an anticlinal structural deformation traps buoyant CO2 and tightly constrains the migration of CO2 within the crest of the structure. The main fault which crosscuts the field area is identified as a potential leakage pathway and requires further investigation to de-risk the site, but its proven history of trapping hydrocarbons is a positive indicator.
The Lybster structure formed at a flexure point during tectonic inversion of the Inner Moray Firth area. A fault segments the field roughly in half: a western compartment with no oil as proven by wells 11/24-3 and 11/24-3z; and an eastern compartment where the Beatrice Sandstones are oil bearing.
The Uppat Mudstones are an effective top seal, preventing upward migration. The adjacent structural high at the Braemore prospect, and patterns identified across the in-line seismic profile, suggest a series of anticline-syncline pairs along strike, parallel to the coastline.
The continuation of the reservoir along strike presents the possibility of increased storage capacity. Injecting down-dip of the trap and into the water-leg of the reservoir on the migration path but outside the structural closure increases the storage capacity with a proven trap at the end of the migration path.
I5 Site characterisation | Production Data
Existing exploration and production well data from Lybster allows for a detailed analysis of the reservoir pressure conditions and residual fluids within the field, both of which are significant for CO2 storage capacity calculations. The Lybster field is hydrostatically pressured with open boundaries to a regional aquifer, the Beatrice Formation. This is as a positive indicator for CO2 storage as a reservoir with open boundaries allows for the displacement of pore fluids and the dispersion of injected-related pressure. This increases the storage capacity compared to a field with closed boundaries.
Production data suggests the field contains a column of residual natural gas. This is also favourable for CO2 storage as gas is more compressible than oil or water, increasing storage capacity. As CO2 is denser than natural gas at reservoir conditions, 724 kg/m3 vs 110 kg/m3, the CO2 will occupy the bottom of the reservoir when injection stops with the remaining natural gas at the top of the reservoir. This acts as a gas barrier which reduces the risk of CO2 leakage through the top seal.
Table I.3: Historic production data for Lybster oil field.
|
Year |
Month |
Oil, bbl |
Reservoir, m^3 |
Gas, mscf |
Gas, boe |
Reservoir, m^3 |
Water, m^3 |
Water, bbl |
Reservoir, m^3 |
Reservoir, m^3 |
|---|---|---|---|---|---|---|---|---|---|---|
|
2012 |
June |
7,724 |
1,424 |
11,160 |
1,983 |
1,196 |
0 |
0 |
0 |
2,620 |
|
2012 |
July |
6,762 |
1,247 |
20,235 |
3,596 |
2,945 |
37 |
233 |
37 |
6,849 |
|
2012 |
August |
6,938 |
1,279 |
24,862 |
4,418 |
3,765 |
47 |
296 |
47 |
11,941 |
|
2012 |
September |
8,064 |
1,487 |
37,505 |
6,665 |
5,937 |
17 |
107 |
17 |
19,381 |
|
2012 |
October |
9,202 |
1,697 |
59,753 |
10,618 |
9,849 |
88 |
554 |
88 |
31,016 |
|
2012 |
November |
4,491 |
828 |
27,969 |
4,970 |
4,590 |
41 |
258 |
41 |
36,476 |
|
2012 |
December |
3,202 |
590 |
3,390 |
602 |
272 |
21 |
132 |
21 |
37,359 |
|
2013 |
January |
1,717 |
317 |
10,065 |
1,789 |
1,641 |
157 |
988 |
158 |
39,474 |
|
2013 |
February |
1,057 |
195 |
5,933 |
1,054 |
963 |
50 |
314 |
50 |
40,682 |
|
2013 |
March |
3,038 |
560 |
12,713 |
2,259 |
1,980 |
302 |
1,900 |
303 |
43,525 |
|
2013 |
April |
9,649 |
1,779 |
71,901 |
12,777 |
12,004 |
778 |
4,894 |
781 |
58,090 |
|
2013 |
May |
7,491 |
1,382 |
74,974 |
13,323 |
12,792 |
798 |
5,019 |
802 |
73,066 |
|
2013 |
June |
3,485 |
643 |
31,536 |
5,604 |
5,345 |
493 |
3,101 |
495 |
79,549 |
|
2013 |
Jul-Nov |
0 |
0 |
0 |
0 |
0 |
0 |
0 |
0 |
79,549 |
|
2013 |
December |
2,132 |
393 |
742 |
132 |
0 |
940 |
5,913 |
944 |
80,886 |
|
2014 |
January |
4,403 |
812 |
22,919 |
4,073 |
3,684 |
838 |
5,271 |
842 |
86,224 |
|
2014 |
February |
1,912 |
353 |
9,747 |
1,732 |
1,563 |
724 |
4,554 |
727 |
88,866 |
|
2014 |
March |
3,837 |
708 |
37,752 |
6,708 |
6,434 |
1073 |
6,749 |
1078 |
97,086 |
|
2014 |
April |
2,573 |
474 |
28,181 |
5,008 |
4,835 |
903 |
5,680 |
907 |
103,302 |
|
2014 |
May |
3,403 |
628 |
28,605 |
5,083 |
4,822 |
1244 |
7,825 |
1250 |
110,001 |
|
2014 |
June |
2,359 |
435 |
35,598 |
6,326 |
6,202 |
848 |
5,334 |
852 |
117,490 |
|
2014 |
July |
1,812 |
334 |
25,709 |
4,569 |
4,468 |
1035 |
6,510 |
1040 |
123,332 |
|
2014 |
August |
1,138 |
210 |
18,223 |
3,238 |
3,182 |
807 |
5,076 |
811 |
127,535 |
|
2014 |
September |
742 |
137 |
8,052 |
1,431 |
1,381 |
759 |
4,774 |
762 |
129,815 |
|
2014 |
October |
730 |
135 |
1,165 |
207 |
133 |
575 |
3,617 |
578 |
130,660 |
|
2014 |
November |
132 |
24 |
2,331 |
414 |
408 |
80 |
503 |
80 |
131,173 |
|
2014 |
December |
0 |
0 |
0 |
0 |
0 |
54 |
340 |
54 |
131,227 |
Appendix J Sources methodology
The database comprises a list of candidate bio-CO2 sources. The methodology calculates CO2 emissions for these sites based on publicly available data[8] (see below). Facilities include those that are already operational, under construction, or at FID and expected to come online before 2030. Facilities from across the various sources and source types are identified from a combination of the following publicly available sources:
• Renewable Energy Planning Database (REPD, 2024)
• BEIS Heat Networks Planning Database (BEIS, 2024)
• Ofgem Renewables Obligation Annual Report (Ofgem, 2024a)
• Ofgem Accredited Stations (Ofgem, 2024b)
• Whisky Invest Direct (WID, 2024)
• The Official Information Portal on Anaerobic Digestion (NNFCC, 2023)
• UK Energy from Waste Statistics 2022 (Tolvik, 2023)
• Scottish Environment Protection Agency SPRI (SEPA, 2022)
• ENDS Waste & Bioenergy (ENDS, 2024)
• Project and facility websites
• Local authority planning portals
Estimating the amount of bio-CO2
The threshold for inclusion is 3 ktpa of bio-CO2. This is based on consultation with current commercial bio-CO2 capture operations in Scotland (Carbon Capture Scotland Ltd, 2024). The methodology follows a top-down calculation similar to Brownsort (2018), using installed or generating capacity, and assumptions to estimate total CO2 emissions from biogenic sources. The following section outline the methodology and key assumptions for each source type.
Biomass combustion
Biomass combustion is determined from three sources and categorised into two groups: biomass combustion for heat and Combined Heat and Power (CHP). The REPD (2024) is updated quarterly and includes data on installed capacity for all UK renewable electricity and CHP projects. For heat provision, a capacity factor of 56.7% (Dukes, 2022) and a heat efficiency of 80% are used. For CHP, the same capacity factor of 56.7% and an electrical conversion efficiency of 35% are used. All biomass feedstock is assumed to be wood with a specific CO2 emission of 0.39kg/kW, despite chicken litter being the main feedstock for one site, Lochgelly.
Energy from Waste
EfW facilities are calculated based on plant waste processing capacity data collected from project or facility websites, ENDS Waste & Bioenergy (ENDS, 2024), and, where necessary, local authority planning portals. Emissions arising are modelled on a ratio of 0.944:1 tCO2 per tonne of waste processing capacity, i.e. 0.944 tCO2 produced for every tonne of waste. Plants are assumed to operate at 50% of plated capacity during the first year of operation and at 95% for the rest of their operational lifetime. It is assumed that 50% of emissions arising from EfW is biogenic in origin following the generally accepted UK industry baseline, although it is accepted that this figure could be conservative and is certainly subject to change.
Fermentation
Two factors are considered: firstly, the production of pure alcohol intended for use in beverages; and secondly, the ratio of CO2 to pure alcohol produced during fermentation.
Actual volumes of alcohol produced by specific breweries and distilleries are not publicly available. Hence, plant capacity data are used to estimate bio-CO2 emissions. Figures for the amount of pure alcohol produced at grain whisky distilleries in Scotland is derived from distillery capacity data and by applying a process capacity factor of 90%. Malt whisky production is similarly assessed, with the difference of applying a capacity factor of 75%, reflecting the smaller scale and less industrial nature of this production.
To estimate the ratio of CO2 to alcohol that is produced, the methodology assumes that fermentation of one molecule of glucose produces two molecules of ethanol and two molecules of CO2 in a 1:1 molar ratio. By adjusting this ratio for the molecular weights of ethanol (46g/mol) and CO2 (44g/mol), and for the density of ethanol (0.789kg/litre), it is determined that 0.755kg CO2 is produced per litre of pure ethanol.
Biogas and biomethane
Plant capacity data for AD biogas and biomethane upgrading are acquired from the NNFCC AD portal (NNFCC, 2023). This provides comprehensive information on the CHP generation capacity and biomethane injection capacity of AD biogas plants. Emissions are estimated assuming maximum capacity from generation capacity data, with a presumed capacity utilisation factor of 80% for AD plants – a high-capacity factor suggested by the NNFCC (2023).
For AD biogas combustion, emissions are calculated based on an assumed mid-range energy conversion efficiency of 37.5%. Efficiency is typically 35-40% for electricity and 40-45% for heat. A typical biogas composition with a CH4/CO2 ratio of 55:45 by volume is assumed. The methane energy content is presumed to be the higher heating value (HHV), 55.53 GJ/t, while gas densities were determined from values reported in the literature, 0.668 kg/m3.
Biomethane upgrading emissions are calculated using the same assumptions and sources as for biogas above but with a separate capacity factor of 47.7%. The calculations for biomethane upgrading provide two values: the first value is for the CO2 that is separated from the raw biogas, which would typically be discharged at the upgrading site. The second value is for the CO2 from the combustion of the upgraded biomethane, which would usually be released downstream where the biomethane is ultimately burnt. Only the CO2 discharged at the upgrading facility is within the scope of this study.
Landfill and sewage
CO2 emissions are calculated based on the installed capacity data for each plant over the period 2022-2023 (Ofgem, 2024a). Average Scottish capacity factors (DESNZ, 2024) are 33% for landfill gas and 53% for sewage gas. The same assumptions and methodology as outlined for biogas above are used for a landfill gas composition ratio of 50:50 of CH4/CO2 by volume.
Scotland’s bio-CO2 resource 2024-2035
The total amount of bio-CO2 in Scotland averages 3.7 Mtpa between 2027-2035 – Table J.1.These projections are based on facilities that are known to have reached at least the FID stage and they assume unchanged operational profiles based on the most recent publicly available data. Given Scotland and the UK’s ambitions for bioenergy, coupled with global forecasts for the sector (an annual growth rate of 3.56% is expected (CAGR 2024-2028) (Statista, 2024)), available volumes of bio-CO2 could increase.
Table J.1: Bio-CO2 forecast. The increase to 2027 is due to 6 new energy-from-waste plants coming online. The reduction post-2030 is due to Baldovie 1, an EfW plant, coming offline.
|
Year |
2024 |
2025 |
2026 |
2027 |
2028 |
2029 |
2030 |
2031 |
2032 |
2033 |
2034 |
2035 |
|
Mtpa |
3.15 |
3.38 |
3.64 |
3.72 |
3.72 |
3.72 |
3.72 |
3.68 |
3.68 |
3.68 |
3.68 |
3.68 |
Post-combustion adjustment factor
A minimum capture rate of 95% applies across all sources. This follows the UK Environment Agency Best Available Technique (BAT) (UK Environment Agency, 2021) guidance for post-combustion capture plants, although it should be noted that capture rates higher than 95% are achievable. High rates can be economically viable and are desirable from a climate mitigation perspective (Gibbins et al., 2024). For EfW, this can be as high as 99.72% with only a marginal cost penalty (Su et al., 2023). A 95% capture rate applies to biomethane upgrading facilities and distilleries. This is likely to be conservative for distillery capture, which achieves around 97% [9].
North America and the EU both enacted net zero by 2050 in 2021. Canada and the USA share similar 2030 ambitions to decarbonise by 40-to-50% from 2005 levels. This is much less ambitious than the EU (55%) and UK (68%) 2030 targets which are from 1990 levels. The USA and Canada saw peak annual emissions in the mid 2000s at 6 Gt and 0.8 Gt respectively, whereas the EU and UK emissions peaked at 5 Gt and 0.8 Gt in the early 1990s.
Carbon capture in North America is characterised by early regional movers but slow overall progress on storage. This has resulted in legislation to accelerate the deployment of CCS in response to the enacted net zero targets. The following section briefly reviews the region to highlight relevant projects and policy actions. As with Europe, the early regional projects have been vertically integrated and located in states and provinces strongly associated with fossil fuel extraction: Alberta, Saskatchewan, North Dakota, Louisiana, and Texas.
USA
In 2021, the Biden administration set a goal of 500 million tonnes of annual carbon abatement by 2050. The intermediate target is 85-170 million tonnes of annual carbon capture and storage by 2030. This new target is incentivised by the Infrastructure Investment and Jobs Act 2021 (IIJA) and Inflation Reduction Act 2022 (IRA). IIJA and IRA are intended to support investment decisions on 6 large commercial capture projects and 4 DAC hubs by 2030. The new incentives have created a rush for storage that has resulted in a bottleneck of Class VI permits applications for CO2 injection wells. As of April 2024, there are 128 applications under review, 56% of which were submitted in the previous 12 months. The EPA has issued 4 permits since 2010.
The IRA increases pre-existing credits under Section 45Q of the Internal Revenue Code from $50 to $85 per ton for CCS, and from $50 to $180 per ton for DAC with permanent storage. The 45Q tax credits expire after 12 years of operational capture and only apply to projects that begin construction before 2033. The credits are transferable between the capture entity and another entity, creating a carbon trading market.
In addition to 45Q, IIJA provides $12bn of funding for capture (30%), DAC hubs (30%), storage testing and validation (20%), transport infrastructure (17.5%), and 1% for storage permitting. The funds potentially reduce the CAPEX of large DAC and CCS projects by up to 75%.
In the USA, CO2 storage requires an Environmental Protection Agency (EPA) Class VI permit for an injection well under the federal Underground Injection Control (UIC) program[10]. States can apply for UIC primacy to expedite the licensing process. This may take years but transfers the primary enforcement authority from the EPA to the State. Only two States have been granted primacy. North Dakota applied for primacy in 2013 and was approved in 2018. Wyoming formally applied in 2019 and was approved in 2020, but that process was preceded by years of dialogue with EPA.
As of April 2024, the EPA have issued four Class VI permits, two of which are active, both at the Archer Daniels Midland ethanol plant, Illinois. For both, the time from application submission to issuance was three years, though the entire permitting process took around six years. There are currently 128 applications under review, 56% of which were submitted within the last 12 months.
Pursuant to the UIC program, EPA has promulgated regulations and established minimum federal requirements for six classes of injection wells (Class I to Class VI). Each well class is based on the type and depth of the injection activity and the potential for the injection activity to impact underground sources of drinking water.
In 2010, EPA established Class VI, the most recently created UIC well class, for wells used to inject CO2 into deep subsurface geologic formations for long-term underground storage—a process known as “geologic sequestration.” By comparison, Class II wells inject fluids associated with oil and natural gas production for enhanced oil recovery. Currently, there are approximately 180,000 active Class II wells but only two active Class VI wells in the United States as of 2022. 80% of Class II wells are used for enhanced oil recovery.
Thus, project proponents seeking to inject CO2 for permanent geologic sequestration must obtain a permit from EPA to drill and operate a Class VI well. A geologic sequestration project is defined by the extent of the area of review (AoR), which is the region surrounding the well where underground sources of drinking water may be impacted by the injection activity. A permit applicant must delineate the AoR to predict the movement of the injected CO2 and displaced fluids using a model that considers the geologic conditions and operations.
The permit application must present a detailed evaluation of site geology, the AoR, and how the modelling inputs reflect site-specific geologic and operational conditions, well construction design, plans to monitor the site, and other required activities. Permit applications are multifaceted and address all aspects of the geologic sequestration project to ensure that underground sources of drinking water are protected. They are comprehensive, and contain maps and cross sections, modelling results, water quality data, analyses of core samples and well logs, engineering schematics, and financial information.
All of the permit application information submitted and reviewed is interrelated, and the information collected to meet one requirement may inform or be informed by other submittals or analyses. Therefore, project proponents need to ensure that, collectively, all of the information submitted is consistent, supports a determination of site-suitability, and affords protection to underground sources of drinking water.
Appendix L Cost-revenue analysis
Cost of trucking
£20 per tonne estimate for 320 km round-trip from Carbon Capture Scotland Ltd.
A, annual 100,000 tonnes
P, payload 20 tonnes
L, distance 160 km
T, trip = 2L 320 km
N, trucks per day 16
D, drivers 16
F, fuel diesel 152 pence per litre
C, fuel consumption 33 litres per 100 km
B, fuel burn per km £0.50 per km
Cost per year of 16 trucks amortised over 10 years: £25,000 x 16 = £400,000
Cost of fuel at £0.50/km for one year: 100,000/20 x 320 x 0.5 = £800,000
Wages for 16 drivers over one year: 50,000 x 16 = £800,000
Total = £2,000,000
Cost per tonne for 100,000 tonne annual payload = £20
Cost of biomass capture
Based on the levelised cost analysis by Lehtveer & Emanuelsson (2021):
LCOC = ((CAPEX×CRF) / FLH) + OPEXfix + OPEXvar + CFuel + CTransportation + CStorage – CElectricity
By neglecting the cost of electricity, and determining the transport and storage costs separately, the LCOC simplifies to the cost of capture:
CCapture = (CAPEX×CRF)/FLH + OPEXfix + OPEXvar + CFuel
- CAPEX, capital expenditure €3.31 million per MW
- OPEXfix, fixed operating expense €105,000 per MW per year
- OPEXvar, variable operating expense €2.1 per MWh
- CRF, Capital Recovery Factor CRF = (i*(1 + i)*n) / ((1 + i)*(n – 1)
- i, interest rate 5%
- n, lifetime of the technology 40 years
- FLH, Full Load Hours 8000 hours per year
- CFuel,th , fuel cost for biomass €30 per MWhth
- Carbon intensity 0.4 tonne/MWhth
- η, plant efficiency 27%
CRF = (0.05*(1+0.05)40) / ((1+0.05)40−1) = 0.0583
CAPEX and OPEX
Annualized CAPEX: CAPEXannual = (CAPEX×CRF)/FLH = 3.31×106 × 0.0583/8000 = 24.12 €/ MWh
Fixed OPEX per MWh: OPEXfix = 105,000€/MW/FLH = 105,000/8000 = 13.125 €/MWh
Total OPEX per MWh: OPEXtotal = OPEXfix + OPEXvar = 13.125+2.1 = 15.225 €/MWh
Biomass energy needed to produce 1 MWh
Biomass input per MWh = 1 / η = 1/0.27 ≈ 3.7 MWhth / MWh electricity
CO2 produced per MWh of electricity produced
CO2 per MWh = Biomass per MWh × carbon intensity = 3.7 × 0.4 = 1.48 tCO2 / MWh electricity
Cost of fuel
CFuel = CFuel,th * Biomass per MWh = 30 *3.7 = 111 €/ MWh electricity
Cost of capture for biomass combustion
CoCBECCS = CAPEXannual + OPEXtotal + CFuel = (24.12+15.225+111) = 150.345 €/MWh
Cost of capture for biomass combustion
CCapture, Biomass = (CAPEXannual + OPEXtotal + CFuel) / CO2 per MWh = 150.345/1.48 = 101.58 €/ tCO2
Total cost per tonne
- /tCO2 = £86.50/tCO2 1 EUR = 0.851 GBP
Table M.1 Sources by sector; average bin size (ktpa), and potential number of capture units per site for all low-cost sites (NxU), assuming a unit is 3-5 ktpa.
|
8 x 1 |
N x U = Sites x Units, low-cost (Nx U) = Sites x Units, high cost |
|
|
|
ktpa |
| |||
|
6 |
|
Biomass |
7-360 |
| |||||
|
– 6 – |
|
|
|
|
| ||||
|
6 |
|
|
|
|
Energy from Waste |
38-158 |
| ||
|
6 |
|
|
|
|
|
|
| ||
|
– 6 – |
7 x 2 |
|
|
|
AD Combustion |
3-44 |
| ||
|
6 |
14 |
|
|
|
|
|
| ||
|
6 |
13 |
|
|
|
Distillery Wash |
2-75 |
| ||
|
6 |
13 |
|
|
|
|
|
| ||
|
6 |
– 13 – |
3 x 4 |
|
|
AD Upgrading |
5-13 |
| ||
|
– 6 – |
12 |
30 |
|
|
|
|
| ||
|
6 |
12 |
30 |
|
|
|
|
| ||
|
6 |
– 12 – |
– 30 – |
|
|
|
|
| ||
|
5 |
– 12 – |
– 28 – |
|
|
|
|
| ||
|
5 |
12 |
27 |
|
|
|
|
| ||
|
5 |
11 |
– 24 – |
1 x 8 |
|
|
|
| ||
|
– 5 – |
11 |
24 |
55 |
2 x 16 |
|
|
| ||
|
– 5 – |
9 |
22 |
49 |
108 |
|
|
| ||
|
4 |
– 8 – |
21 |
49 |
97 |
|
|
| ||
|
4 |
8 |
– 21 – |
– 46 – |
94 |
|
|
| ||
|
4 |
8 |
20 |
45 |
83 |
|
|
| ||
|
4 |
8 |
19 |
44 |
75 |
[6 x 32] |
|
| ||
|
– 4 – |
7 |
19 |
44 |
75 |
– 242 – |
|
| ||
|
3 |
7 |
18 |
38 |
70 |
158 |
|
| ||
|
– 3 – |
7 |
17 |
36 |
69 |
150 |
|
| ||
|
2 |
7 |
17 |
33 |
– 69 – |
144 |
[2 x 64] |
| ||
|
– 2 – |
7 |
16 |
32 |
67 |
135 |
360 |
| ||
|
– 2 – |
– 7 – |
15 |
31 |
67 |
135 |
279 |
| ||
|
Ave: 5 ktpa |
10 ktpa |
20 ktpa |
40 ktpa |
80 ktpa |
160 ktpa |
320 ktpa |
| ||
Table M.2: Sources by sector, location, road distance from nearest storage (km), process of capture, and annual potential capture rate (ktpa).
|
Biomass |
|
|
|
|
|
|
|
| |||||||
|
LOC |
ID |
Short name |
Post code |
Latitude |
Longitude |
km |
Sector |
Process |
ktpa | ||||||
|
F |
1001 |
Markinch |
KY7 5PZ |
56.20017 |
-3.15669 |
10 |
Biomass |
Combustion |
360 | ||||||
|
S |
1002 |
Croft |
DG11 2SQ |
55.15298 |
-3.38013 |
69 |
Biomass |
Combustion |
279 | ||||||
|
N |
1003 |
Morayhill |
IV2 7JQ |
57.51775 |
-4.08378 |
151 |
Biomass |
Combustion |
242 | ||||||
|
G |
1004 |
Cowie |
FK7 7BQ |
56.07768 |
-3.86212 |
74 |
Biomass |
Combustion |
150 | ||||||
|
C |
1005 |
Caledonian |
KA11 5AT |
55.58462 |
-4.64174 |
112 |
Biomass |
Combustion |
144 | ||||||
|
C |
1006 |
Liberty |
ML1 1PU |
55.78842 |
-3.98196 |
87 |
Biomass |
Combustion |
94 | ||||||
|
F |
1007 |
Lochgelly |
KY5 0HR |
56.16862 |
-3.30545 |
18 |
Biomass |
Combustion |
69 | ||||||
|
N |
1008 |
Speyside |
AB38 9RX |
57.49494 |
-3.20666 |
224 |
Biomass |
Combustion |
69 | ||||||
|
F |
1009 |
Tarmac |
EH42 1SL |
55.98063 |
-2.47298 |
108 |
Biomass |
Combustion |
55 | ||||||
|
N |
1010 |
Rothes |
AB38 7BW |
57.53307 |
-3.20761 |
225 |
Biomass |
Combustion |
46 | ||||||
|
F |
1011 |
Guardbridge |
KY16 0US |
56.36482 |
-2.89013 |
38 |
Biomass |
Combustion |
36 | ||||||
|
H |
1012 |
Acharn |
FK21 8RA |
56.44734 |
-4.34494 |
116 |
Biomass |
Combustion |
31 | ||||||
|
F |
1013 |
Diageo |
KY8 5RL |
56.18953 |
-3.05583 |
9 |
Biomass |
Combustion |
30 | ||||||
|
C |
1014 |
Egger |
KA18 2LL |
55.47011 |
-4.32728 |
98 |
Biomass |
Combustion |
30 | ||||||
|
N |
1015 |
Balcas |
IV18 0LT |
57.70219 |
-4.15645 |
109 |
Biomass |
Combustion |
28 | ||||||
|
O |
1016 |
Pulteney |
KW1 5BA |
58.43514 |
-3.08414 |
24 |
Biomass |
Combustion |
19 | ||||||
|
C |
1017 |
Glennon |
KA10 6DJ |
55.54741 |
-4.68127 |
109 |
Biomass |
Combustion |
14 | ||||||
|
F |
1018 |
Gleneagles |
PH3 1NF |
56.28626 |
-3.75079 |
64 |
Biomass |
Combustion |
7 | ||||||
|
EfW |
|
|
|
|
|
|
|
| |||||||
|
LOC |
ID |
Short name |
Post code |
Latitude |
Longitude |
km |
Sector |
Process |
ktpa | ||||||
|
C |
1019 |
SCEC |
G51 4SJ |
55.86136 |
-4.35344 |
111 |
EfW Plant |
Combustion |
158 | ||||||
|
C |
1020 |
Drumgray |
ML6 7TD |
55.90592 |
-3.94183 |
87 |
EfW Plant |
Combustion |
135 | ||||||
|
C |
1021 |
Dunbar |
EH42 1SW |
55.97478 |
-2.46485 |
109 |
EfW Plant |
Combustion |
135 | ||||||
|
F |
1022 |
Westfield |
KY5 0HR |
56.16993 |
-3.29276 |
21 |
EfW Plant |
Combustion |
108 | ||||||
|
G |
1023 |
Earls Gate |
FK3 8XG |
56.01194 |
-3.73653 |
55 |
EfW Plant |
Combustion |
97 | ||||||
|
F |
1024 |
Oldhall |
KA11 5DG |
55.59488 |
-4.64028 |
113 |
EfW Plant |
Combustion |
83 | ||||||
|
F |
1025 |
Millerhill |
EH22 1SX |
55.92459 |
-3.08624 |
72 |
EfW Plant |
Combustion |
70 | ||||||
|
C |
1026 |
GRREC |
G42 0PJ |
55.83439 |
-4.24446 |
101 |
EfW Plant |
Combustion |
67 | ||||||
|
E |
1027 |
NESS |
AB12 3BG |
57.12652 |
-2.07786 |
73 |
EfW Plant |
Combustion |
67 | ||||||
|
F |
1028 |
Baldovie 2 |
DD4 0NS |
56.48495 |
-2.90174 |
53 |
EfW Plant |
Combustion |
49 | ||||||
|
G |
1029 |
Levenseat |
ML11 8TS |
55.79743 |
-3.68852 |
73 |
EfW Plant |
Combustion |
45 | ||||||
|
F |
1030 |
Baldovie 1 |
DD4 0NS |
56.48495 |
-2.90174 |
53 |
EfW Plant |
Combustion |
44 | ||||||
|
C |
1031 |
Binn |
PH2 9PX |
56.30246 |
-3.34516 |
33 |
EfW Plant |
Combustion |
38 | ||||||
|
Distillery |
|
|
|
|
|
|
|
| |||||||
|
LOC |
ID |
Short name |
Post code |
Latitude |
Longitude |
km |
Sector |
Process |
ktpa | ||||||
|
F |
1032 |
Cameronbridge |
KY8 5RL |
56.18951 |
-3.0558 |
9 |
Distillery |
Separation |
75 | ||||||
|
A |
1033 |
Girvan |
KA26 9PT |
55.25928 |
-4.83023 |
84 |
Distillery |
Separation |
75 | ||||||
|
F |
1034 |
North British |
EH11 2PX |
55.93922 |
-3.23654 |
49 |
Distillery |
Separation |
49 | ||||||
|
C |
1035 |
Strathclyde |
G5 0QB |
55.84846 |
-4.23995 |
102 |
Distillery |
Separation |
27 | ||||||
|
N |
1036 |
Invergordon |
IV18 0HP |
57.69546 |
-4.16491 |
109 |
Distillery |
Separation |
24 | ||||||
|
G |
1037 |
Starlaw |
EH47 7BW |
55.88934 |
-3.5785 |
59 |
Distillery |
Separation |
17 | ||||||
|
C |
1038 |
Loch Lomond |
G83 0TL |
55.99241 |
-4.57636 |
126 |
Distillery |
Separation |
12 | ||||||
|
N |
1039 |
Glenlivet |
AB37 9DB |
57.34351 |
-3.3376 |
231 |
Distillery |
Separation |
12 | ||||||
|
N |
1040 |
Glenfiddich |
AB55 4DH |
57.45485 |
-3.12795 |
236 |
Distillery |
Separation |
12 | ||||||
|
LOC |
ID |
Short name |
Post code |
Latitude |
Longitude |
km |
Sector |
Process |
ktpa | ||||||
|
N |
1041 |
Macallan |
AB38 9RX |
57.48488 |
-3.20614 |
231 |
Distillery |
Separation |
8 | ||||||
|
A |
1042 |
Ailsa Bay |
KA26 9PF |
55.26118 |
-4.83495 |
84 |
Distillery |
Separation |
7 | ||||||
|
N |
1043 |
Glen Ord |
IV6 7UJ |
57.5223 |
-4.47397 |
139 |
Distillery |
Separation |
7 | ||||||
|
N |
1044 |
Roseisle |
IV30 5YP |
57.66883 |
-3.47425 |
202 |
Distillery |
Separation |
6 | ||||||
|
N |
1045 |
Dalmunach |
AB38 7RE |
57.45479 |
-3.30027 |
221 |
Distillery |
Separation |
6 | ||||||
|
N |
1046 |
Teaninich |
IV17 0XB |
57.69154 |
-4.26051 |
114 |
Distillery |
Separation |
6 | ||||||
|
N |
1047 |
Glenmorangie |
IV19 1PZ |
57.82658 |
-4.07743 |
88 |
Distillery |
Separation |
4 | ||||||
|
N |
1048 |
Tomatin |
IV13 7YT |
57.34149 |
-4.01045 |
166 |
Distillery |
Separation |
3 | ||||||
|
N |
1049 |
Speyburn |
AB38 7AG |
57.53646 |
-3.21595 |
225 |
Distillery |
Separation |
2 | ||||||
|
F |
1050 |
Tullibardine |
PH4 1QG |
56.25815 |
-3.7851 |
123 |
Distillery |
Separation |
2 | ||||||
|
N |
1051 |
Balmenach |
PH26 3PF |
57.32546 |
-3.53212 |
208 |
Distillery |
Separation |
2 | ||||||
|
Landfill |
|
|
|
|
|
|
|
| |||||||
|
LOC |
ID |
Short name |
Post code |
Latitude |
Longitude |
km |
Sector |
Process |
ktpa | ||||||
|
G |
1052 |
Avondale |
FK2 0YG |
55.99067 |
-3.67843 |
51 |
Landfill |
Combustion |
32 | ||||||
|
C |
1053 |
Greengairs |
ML6 7TD |
55.90502 |
-3.94501 |
87 |
Landfill |
Combustion |
20 | ||||||
|
F |
1054 |
Dunbar |
EH42 1SW |
55.97169 |
-2.46156 |
109 |
Landfill |
Combustion |
19 | ||||||
|
C |
1055 |
Greenoakhill |
G71 7SQ |
55.83865 |
-4.13733 |
94 |
Landfill |
Combustion |
15 | ||||||
|
E |
1056 |
Stoneyhill |
AB42 0PR |
57.45897 |
-1.87237 |
36 |
Landfill |
Combustion |
12 | ||||||
|
C |
1057 |
Cathkin |
G73 3RE |
55.78877 |
-4.1898 |
102 |
Landfill |
Combustion |
11 | ||||||
|
C |
1058 |
Auchencarroch |
G83 9EY |
55.99891 |
-4.53778 |
127 |
Landfill |
Combustion |
11 | ||||||
|
C |
1059 |
Garlaff |
KA18 2RB |
55.42964 |
-4.30544 |
93 |
Landfill |
Combustion |
8 | ||||||
|
C |
1060 |
Oatslie |
EH25 9QN |
55.85126 |
-3.18402 |
64 |
Landfill |
Combustion |
7 | ||||||
|
F |
1061 |
Kaimes |
EH27 8EF |
55.88372 |
-3.39556 |
52 |
Landfill |
Combustion |
7 | ||||||
|
F |
1062 |
Binn |
PH2 9PX |
56.30514 |
-3.33799 |
34 |
Landfill |
Combustion |
6 | ||||||
|
LOC |
ID |
Short name |
Post code |
Latitude |
Longitude |
km |
Sector |
Process |
ktpa | ||||||
|
F |
1063 |
Lochhead |
KY12 0RX |
56.09775 |
-3.47311 |
29 |
Landfill |
Combustion |
6 | ||||||
|
C |
1064 |
Auchinlea |
ML1 5LR |
55.80956 |
-3.90035 |
82 |
Landfill |
Combustion |
6 | ||||||
|
C |
1065 |
Summerston |
G23 5HD |
55.9119 |
-4.27466 |
106 |
Landfill |
Combustion |
6 | ||||||
|
C |
1066 |
Rigmuir |
G75 0QZ |
55.74302 |
-4.12468 |
105 |
Landfill |
Combustion |
6 | ||||||
|
C |
1067 |
Shewalton |
KA11 5DF |
55.59493 |
-4.64203 |
113 |
Landfill |
Combustion |
5 | ||||||
|
F |
1068 |
Cireco |
KY15 7UL |
56.2926 |
-3.13048 |
22 |
Landfill |
Combustion |
4 | ||||||
|
E |
1069 |
Tramaud |
AB23 8BQ |
57.2111 |
-2.08733 |
62 |
Landfill |
Combustion |
4 | ||||||
|
Industrial |
|
|
|
|
|
| |||||||||
|
LOC |
ID |
Short name |
Post code |
Latitude |
Longitude |
km |
Sector |
Process |
ktpa | ||||||
|
A |
1070 |
Girvan |
KA26 9PT |
55.26386 |
-4.82595 |
85 |
Industrial |
Combustion |
44 | ||||||
|
F |
1071 |
Cameronbridge |
KY8 5RL |
56.18953 |
-3.05583 |
9 |
Industrial |
Combustion |
33 | ||||||
|
N |
1072 |
Portgordon |
AB56 5BU |
57.65558 |
-3.02453 |
231 |
Industrial |
Combustion |
30 | ||||||
|
N |
1073 |
Glenfiddich |
AB55 4DH |
57.45601 |
-3.12411 |
236 |
Industrial |
Combustion |
21 | ||||||
|
E |
1074 |
Brewdog |
AB41 8BX |
57.36964 |
-2.05049 |
43 |
Industrial |
Combustion |
21 | ||||||
|
B |
1075 |
Charlesfield |
TD6 0HH |
55.56084 |
-2.65219 |
119 |
Industrial |
Combustion |
18 | ||||||
|
C |
1076 |
GSK |
KA11 5AP |
55.59496 |
-4.62817 |
113 |
Industrial |
Combustion |
6 | ||||||
|
City Waste |
|
|
|
|
|
|
|
| |||||||
|
LOC |
ID |
Short name |
Post code |
Latitude |
Longitude |
km |
Sector |
Process |
ktpa | ||||||
|
C |
1077 |
Polmadie |
G42 0PJ |
55.83434 |
-4.24477 |
101 |
City Waste |
Combustion |
24 | ||||||
|
C |
1078 |
Energen |
G67 3EN |
55.92553 |
-4.05769 |
85 |
City Waste |
Combustion |
22 | ||||||
|
C |
1079 |
Barkip |
KA24 4JJ |
55.71786 |
-4.65683 |
130 |
City Waste |
Combustion |
13 | ||||||
|
F |
1080 |
Millerhill |
EH21 8RZ |
55.92612 |
-3.08608 |
71 |
City Waste |
Combustion |
9 | ||||||
|
F |
1081 |
Lochhead AD |
KY12 0RX |
56.09775 |
-3.47311 |
29 |
City Waste |
Combustion |
7 | ||||||
|
C |
1082 |
Deerdykes |
G68 9NB |
55.92671 |
-4.0568 |
85 |
City Waste |
Combustion |
6 | ||||||
|
Farming | |||||||||||||||
|
LOC |
ID |
Short name |
Post code |
Latitude |
Longitude |
km |
Sector |
Process |
ktpa | ||||||
|
F |
1091 |
Inchdairnie |
KY5 0UL |
56.17697 |
-3.22284 |
14 |
Farming |
Combustion |
12 | ||||||
|
F |
1092 |
Binn Farm |
PH2 9PX |
56.30482 |
-3.33923 |
34 |
Farming |
Combustion |
8 | ||||||
|
C |
1093 |
Tambowie |
G62 7HN |
55.94956 |
-4.36302 |
114 |
Farming |
Combustion |
6 | ||||||
|
S |
1094 |
West Roucan |
DG1 3QG |
55.09372 |
-3.5339 |
53 |
Farming |
Combustion |
6 | ||||||
|
N |
1095 |
Wester Alves |
IV30 8XD |
57.64396 |
-3.45841 |
201 |
Farming |
Combustion |
5 | ||||||
|
S |
1096 |
Crofthead |
DG2 8QW |
54.99901 |
-3.839 |
27 |
Farming |
Combustion |
3 | ||||||
|
Sewage |
|
|
|
|
|
|
|
|
| ||||||
|
LOC |
ID |
Short name |
Post code |
Latitude |
Longitude |
km |
Sector |
Process |
ktpa | ||||||
|
F |
1097 |
Seafield |
EH6 7RF |
55.97112 |
-3.1444 |
53 |
Sewage |
Combustion |
16 | ||||||
|
E |
1098 |
Nigg |
AB12 3LT |
57.13236 |
-2.06023 |
72 |
Sewage |
Combustion |
8 | ||||||
|
Upgrading |
|
|
|
|
|
|
|
| |||||||
|
LOC |
ID |
Short name |
Post code |
Latitude |
Longitude |
km |
Sector |
Process |
ktpa | ||||||
|
A |
1083 |
Girvan |
KA26 9PT |
55.26386 |
-4.82595 |
85 |
Upgrading |
Separation |
17 | ||||||
|
S |
1084 |
Crofthead |
DG2 8QW |
54.99901 |
-3.839 |
27 |
Upgrading |
Separation |
13 | ||||||
|
N |
1085 |
Glenfiddich |
AB55 4DH |
57.45601 |
-3.12411 |
236 |
Upgrading |
Separation |
13 | ||||||
|
N |
1086 |
Portgordon |
AB56 5BU |
57.65558 |
-3.02453 |
231 |
Upgrading |
Separation |
5 | ||||||
|
F |
1087 |
Bangley |
EH41 3SN |
55.96642 |
-2.82347 |
86 |
Upgrading |
Separation |
5 | ||||||
|
S |
1088 |
Lockerbie |
DG11 1LW |
55.12065 |
-3.40844 |
64 |
Upgrading |
Separation |
5 | ||||||
|
F |
1089 |
Keithick |
PH13 9NF |
56.5321 |
-3.29713 |
83 |
Upgrading |
Separation |
4 | ||||||
|
E |
1090 |
Savock |
AB41 6AL |
57.31676 |
-2.04657 |
49 |
Upgrading |
Separation |
4 | ||||||
© The University of Edinburgh, 2024.
Prepared by SCCS on behalf of ClimateXChange, The University of Edinburgh. All rights reserved.
While every effort is made to ensure the information in this report is accurate, no legal responsibility is accepted for any errors, omissions, or misleading statements. The views expressed represent those of the author(s), and do not necessarily represent those of the host institutions or funders.
Note that this estimate does not include associated costs such as financing and contingency. ↑
Note that at the time of going to press the Stenlille storage permit has not been issued. ↑
All NSTA licenses continue to be issued by the OGA as a legal entity under the Energy Act 2008. ↑
Storage appraisals are regulated by the CCS Directive 2009, transposed to UK law in 2012. ↑
Licenses CS001 and CS002 were both issued by the OGA under the Energy Act 2008. ↑
The HSE-OPRED MoU is a relatively brief document, available at: www.hse.gov.uk/agency-agreements-memoranda-of-understanding-concordats/assets/docs/opred-hse.pdf ↑
Data for the Cowie and Morayhill biomass facilities came directly from the operator, West Fraser (formerly Norbord). Personal communication with Nick Fedo, General Manager (March 2023). ↑
95-96% CO2 from biogas using membrane technology and sending the CO2 stream straight to CO2 recovery. The 4-5% loss occurs during the purification of CO2 in the recovery stage. Personal communication with Richard Nimmons, Carbon Capture Scotland (March 2023). ↑
www.mayerbrown.com: storage-class-vi-wells-and-us-state-primacy ↑