

Local authority role in Scotland’s transition to net zero
December 2023
DOI: http://dx.doi.org/10.7488/era/4512
Executive summary
Background
Scotland recognises the significance of a place-based transition to net zero greenhouse gas emissions (GHG). As part of setting a target of net zero by 2045, the Climate Change (Scotland) Act 2009 places importance on the role of local authorities in achieving this target. Therefore, it is a priority for the Scottish Government to facilitate area-wide and locally-led efforts as part of a just transition to net zero.
Across the 32 local authorities in Scotland, 17 have set net zero targets specific to tackling territorial GHG emissions generated in their geographical area (from agriculture, buildings, industry, land use and land use change and forestry, transport and waste). This is in direct comparison to 26 local authorities that have set net zero targets to reduce their organisational GHG emissions.
This research examines local authority climate-relevant strategies and policies within them; the potential of these policies to reduce emissions if they were scaled to the national level; and the barriers that local authorities face in implementing these policies.
Main findings
We developed a register of 69 climate change strategies across all 32 local authorities. We found that local authorities are modelling exemplary action on climate change across many fronts through the benefit of deep-rooted relationships with local stakeholders and unparalleled knowledge of their area.
However, the level of detail and methodological evidence presented in climate change strategies are often sparse, with many strategies failing to model the scale of impact on GHG emissions.
From the 69 climate-related strategies, we selected six leading strategies for quantification and identified 13 policies within these that could be appropriate for scaling up. We undertook an initial estimate of the potential territorial emission reduction if they were replicated across all Scottish local authorities. We also assessed the likelihood for change at this scale, considering local authorities’ sphere of control, capacity and timescales, alongside the magnitude of potential change. Through this process we identified two policy areas with the potential for major impact on territorial greenhouse gas emissions:
- Nature-based solutions: a combination of individual policies to green derelict land, restore damaged peatland and afforestation.
- Net zero transport: several climate policy initiatives such as active transport, decarbonisation of public transport and low-emission vehicle licences for taxis.
The impact on Scotland’s national territorial emissions, should all local authorities adopt the leading policies, from nature-based solutions (5,497 ktCO2e) and net zero transport (1,527 ktCO2e) amounts to an estimated total potential reduction of 7,024 ktCO2e by 2045. This is an indicative figure, illustrating the scale of change that could be possible.
We found that the Scottish Government have set a compelling ambition to closely support local authorities to develop locally owned and led climate action strategies to tackle territorial emissions.
However, we also found that local authorities are limited by a lack of clarity on their roles and responsibilities, and by a lack of best practice guidance or frameworks across all the territorial emission categories. They face barriers including lack of data maturity, capacity, specialist skills, accountability and funding.
Recommendations
Local authorities could be further supported to develop their climate policies. We recommend the establishment of best practice guidance on the development of climate policies. This would help improve clarity and consistency across local authorities.
Further research could expand on the capacity and capability requirements to deliver local authority climate policies between now and 2045, including methods by which the resourcing needs could be met. Further investigation could help quantify the funding available for tackling each GHG inventory, where further funding might best be directed and methods for administrating funding to ensure that national ambitions can be met.
Glossary and abbreviations
|
BEIS |
Department for Business, Energy and Industrial Strategy |
|
ktCO2e |
Kilo-tonnes of carbon dioxide equivalent |
|
DESNZ |
Department for Energy Security and Net Zero |
|
GHG |
Greenhouse gas |
|
GHGI |
Greenhouse gas inventory |
|
IPCC |
Intergovernmental Panel on Climate Change |
|
KPI |
Key performance indicator |
|
LA |
Local authority |
|
LEZ |
Low emission zone |
|
LHEES |
Local Heat and Energy Efficiency Strategies |
|
LULUCF |
Land use, land use change and forestry |
|
SIC |
Standard Industrial Classification |
|
SSN |
Sustainable Scotland Network |
Introduction
Context
The recent parliamentary inquiry into the role of local government in delivering net zero stressed that it will be impossible for Scotland to reach net zero without local leadership spearheading area-wide decarbonisation efforts (Net Zero, Energy and Transport Committee, 2023). The inquiry recognised that achieving net zero cannot be dictated. It requires a collective effort between local government, which holds the local knowledge and fruitful partnerships across the public and private sectors, and national government which have the strategic capabilities and resources to support and coordinate local efforts.
The Scottish Government is continuing the drive toward empowering, building capacity, and providing the necessary foundations for local government to build their net zero programmes. The parliamentary inquiry also established that, while councils have at times been a model for net zero leadership, this needs to be rapidly scaled across all local authorities and all emission sectors in each local authority. The inquiry report noted that the Scottish Government must facilitate this scaling by providing local authorities with a comprehensive roadmap for net zero and “far more certainty than they have at present about the roles they are to play” (Net Zero, Energy and Transport Committee, 2023).
The Duties of Public Bodies: Reporting Requirements Order placed responsibilities on all public bodies, including local authorities, to report on scope 1 and 2 (and some scope 3) organisational emissions (Climate Change Order, 2015). As a result, all 32 local authorities have developed organisational emission inventories and in 2022 the Accounts Commission reported that 26 local authorities had developed organisational net zero targets (Audit Scotland, 2022). However, local authorities have some influence on certain emissions reduction beyond their organisational boundaries. These emissions produced within a local authority’s geographical area of responsibility are referred to as ‘territorial emissions’. Only 17 local authorities have developed territorial net zero targets and even fewer have developed policies for reducing territorial emissions. If this situation persists, it will present a major barrier to the success of Scotland’s national Climate Change Plan, which is heavily reliant on place-based and locally-led action (Scottish Government, 2020).
In their recent progress update to parliament, the Climate Change Committee noted that “momentum on a local level is increasing, but local action is uncoordinated” (Climate Change Committee, 2022, p. 53). There are pockets of exemplary action but also a lack of knowledge sharing across local authorities. This has led to policies being rolled out with different timescales, best practice not being disseminated and opportunities being missed to drive coordinated action across all local authorities. In November 2023 the Scottish Government launched a new Scottish Climate Intelligence Service to support local authorities to build capacity and capability for the development of area-wide programmes of emissions reduction for the benefit of their communities. This service will enable local authorities to deliver their own area-wide territorial net zero targets and to contribute to Scotland’s national commitment to net zero by 2045 (Improvement Service, 2023).
This research addresses some of the identified challenges by analysing the climate policies local authorities have developed to directly tackle territorial GHG emissions, and mapping their potential impact on territorial GHG emissions.
Project aims and research questions
The first aim of this project was to identify key GHG emission reduction policies developed by Scottish local authorities. We developed a comprehensive register of local authority climate-related strategies and associated policies and described the current action being taken by each local authority across all emission categories.
The second aim was to compile and undertake an initial estimate of the policies’ GHG emission reduction potential at both the local authority and national level. This aim was broken down into three sub-questions. Firstly, to identify what the key policies are that have significant GHG emission reduction potential. Secondly, to estimate their emissions reduction potential within their respective local authorities. Thirdly, to estimate what the emission reduction potential would be, should they be applied across all Scottish local authorities. This type of analysis has previously been conducted by the Edinburgh Climate Commission and Place-based Climate Action Network, although this was only in relation to policy scenarios at the local level (Williamson, et al., 2020).
The third aim was to engage with local authorities through a series of semi-structured interviews to understand how the most significant policies could be implemented across Scotland, including the role of Scottish Government and other public bodies in enabling this.
Overall, this project highlights area-based policy options for Scottish Government to consider for national deployment, whether as a statutory instrument, as in the case of Local Heat and Energy Efficiency Strategies (LHEES), or via other delivery approaches such as frameworks or guidance.
Defining the greenhouse gas emission inventory
The UK greenhouse gas inventory (GHGI) is published annually by the Department for Energy Security and Net Zero (DESNZ) and sets out the latest estimates in territorial GHG emissions for all 374 local authorities across the United Kingdom, including the 32 local authorities across Scotland. We have charted the latest DESNZ territorial GHGI publication data for Scotland (DESNZ, 2023) in Figure 1 below. This shows the total territorial GHG emissions split into the inventory categories (agriculture, buildings, industry, LULUCF, transport and waste) between 2005 and 2021. The dataset employs several different methodologies to calculate the spatially disaggregated emissions for each inventory category.

Table 1 provides a description of each of the GHGI categories. These are important for drawing boundaries around polices, determining which inventory a specific policy will impact.
|
Category |
Description |
|---|---|
Agriculture |
A variety of policy options exist for the mitigation of GHG emissions through agricultural practices. The most prominent options are improved crop and grazing land management, restoration of organic soils, and livestock manure management. |
Buildings |
Building emissions are typically tackled through policies implementing technological solutions to improve energy efficiency performance, or non-technological approaches such as land use management and planning legislation. There is a drive to move towards zero direct emission sources of heating and hot water, such as heat pumps, to decarbonise buildings. |
Industry |
Net zero emissions from industry is possible but challenging. Reduced materials demand, material efficiency, and circular economy solutions can reduce the need for primary production. Primary production policy options include switching to new processes that use low to zero GHG-producing fuels (e.g. electrification). |
Land Use, Land Use Change and Forestry |
Changes in how land is used impact’s terrestrial ability to store or release carbon to the atmosphere. Humans are changing the natural rate of flux through Land Use, Land Use Change and Forestry (LULUCF) and policies that seek to improve the quantity (e.g. afforestation) and quality (e.g. restoration) of natural sinks are important to preserving natures ability to retain and further sequester carbon. |
Transport |
Transport emissions are addressed through avoided journeys and modal shifts due to behavioural change, uptake of improved vehicle and engine performance technologies, electrification, low-carbon fuels, investments in related infrastructure, and changes in the built environment. Combined, these offer high potential for mitigating emissions from transport. |
Waste |
Management policies typically consist of waste prevention, minimisation, material recovery, recycling, and re-use. There is growing potential for indirect reduction of GHG emissions through principles of circular economy and design leading to decreased waste generation, lower raw material consumption, reduced energy demand and fossil fuel avoidance. |
It is possible for policies to transcend multiple emission inventories. For example, a policy that seeks to develop a green network to increase the level of active transport[1] by improving tree canopy coverage and hedgerows would impact a transport and LULUCF inventory. There are activities and emission changes that would impact both inventories in this instance.
Methodology
This section provides a summarised version of the research methodology. A more detailed methodology is available in Appendix 13.1.
A steering group was established to support the delivery of the project, and consisted of representatives from the Scottish Government, ClimateXChange, Sustainable Scotland Network (SSN), and the Turner & Townsend research team. Findings and outcomes were reported to the steering group for comments and to confirm the research direction throughout the project. The project was divided into three tasks.
Evidence review
Task 1 was to compile a comprehensive policy register to understand the current climate action being taken by each local authority. This register provides a useful tool to view and analyse individual climate policies across Scotland. We applied the following process:
- Search: our search began with reviewing information available through the “Wider Influence” tab of local authority climate change submissions to SSN (SSN, 2023b). Where gaps existed, we supplemented these by conducting an online search of local authority websites and other public body sources for the relevant policy documentation.
- Classify: we utilised a rapid evidence assessment (HM Treasury, 2020) to classify each policy based on its high-level data, including years of coverage, policy owner, whether the policy is monitored, and any associated targets.
- Select: we developed screening criteria based on Scottish Government priorities for the current project and used this to recommend six strategies of significance to progress to Task 2.
We presented the key findings to the steering group and our assessment of the selected strategies. We asked the steering group for advice on the selection of the six strategies. This resulted in the addition of geographical criteria to our selection assessment, to ensure the research considered local authorities from rural and island communities.
Quantitative research
For Task 2 we developed a GHG profile for each of the six strategies selected from Task 1. This involved identifying the emission boundary of each policy within the strategies and the quantification of the potential impact on territorial emissions of the respective local authority. We then proceeded to calculate an aggregated figure to estimate the policies’ potential impact if rolled out at the national level. We approached this by:
- Assessment boundary: GHG boundaries were established using GHG Protocol Action Standard (Greenhouse Gas Protocol, 2014) to apportion the relevant sinks and sources to each policy and estimate potential emission impacts. This was used to determine the likelihood and magnitude of change.
- Policy scenario emissions: in the first instance, we used existing activity and emission factor information from the local authority policies to develop policy scenario emissions estimates. In the absence of information, we applied Intergovernmental Panel on Climate Change guidance. We then used the HM Treasury Green Book to approximate changes and associated emissions values to provide national-level policy scenario figures.
The more comprehensive methodology in Appendix 13.1 explains in detail the range of approaches and methodologies applied in the assessment of GHG boundaries, development of the policy scenario emissions estimations and the limitations of this approach. The findings from Task 2 were presented to the steering group with the objective of selecting two of the most likely and impactful areas of policy to be considered for national deployment by local authorities. These were developed into policy briefings for Scottish Government.
Qualitative research
For Task 3 we conducted interviews with representatives from two local authorities to gain their views on wider implementation of the selected policy areas, including the roles of local authorities, Scottish Government and other public bodies. We planned a third interview with one further local authority however, we were not able to agree a time and date for the interview to take place in the timescales of this research.
A topic guide was developed and formed the basis of 45-minute semi-structured interviews on Microsoft Teams. These aimed to collect the comprehensive views on the likelihood of wider adoption of the policies, including practicability, the capacity and capability required to deliver a new policy. We also included other open-ended questions, encouraging participants to expand further on topics they deemed relevant. The data from interviews was collated in a thematic analysis grid and key themes were extracted using an analytical approach guided by participant views.
We combined the data from all sources (the evidence review, quantitative potential emissions modelling, discussions with the steering group, and the qualitative research) to discuss the key challenges and the possible approaches to adopting the climate policies at a national scale. The conclusion is presented in Section 11.
Review of existing evidence
Overview
The aim of this review was to understand the climate strategy and policy landscape across Scottish local authorities. We created a Climate Strategy Register that involved the collation of climate action plans from all 32 local authorities including individual sector strategies such as transport plans, waste plans and local development plans (Appendix 13.3).
This report makes a distinction between a climate strategy and a climate policy in the context of the documents reviewed. Policies feed into sector strategies, which feed into a climate change strategy.
Most local authorities reviewed already have a top-level document we define as a climate change strategy. A climate change strategy refers to several planned actions and policies designed to outline an organisation’s approach to tackling climate-related challenges in their local region. Climate change strategies encompass other nomenclature such as a ‘climate action plan’. A climate change strategy will typically cover ambitions for all GHG emission inventories and may link to separate sector strategies that set out in further detailed policies specific to a singular emission inventory. For example, a climate change strategy might reference a separate transport emission sector strategy.
A climate policy encompasses an individual action or set of actions that deliver ambitions set out by a climate strategy. Policies will typically include setting of targets and key performance indicators to measure and verify the success of the policy’s intended impact. For example, a transport sector strategy might include a policy to increase electric vehicle charging infrastructure, and a policy to implement a low emission zone (LEZ) in a city centre.
We used several sources of information to inform our review of existing evidence. We started with reviewing the “Wider influences” local authority climate change report submissions to SSN (SSN, 2023b). The wider influences section of SSN reports was completed with varying degrees of information but overall, the level of detail was sparse. We supplemented this gap by searching each of the local authority websites for their climate action strategies. We found various types of initiatives at different levels of hierarchy.
We identified 69 strategies relevant to climate change across the 32 local authorities. We developed short summaries of each strategy document, which are set out in Appendix 13.2.
We developed a screening matrix to rank each of the strategies against five criteria outlined in Table 2 and determined the level of maturity by assessing the level of evidence provided in a climate change strategy as yes / no / partial. Each of the strategies was then assigned a relevance score to identify those that closely aligned with the research objectives.
|
Screening criteria |
Description |
Maturity | |||
|
1 |
2 |
3 | |||
|
1 |
Scalability |
If the policy impacts a defined region, is there possibility for it to be scaled to cover a wider geographical location? |
N |
N |
Y |
|
2 |
Replicability |
Can the policy be easily replicated by other local authorities in Scotland? |
N |
Y |
Y |
|
3 |
Impacts |
Does the policy quantify the intended impacts (e.g. emissions reduction) and set targets against these? |
N |
Y |
Y |
|
4 |
Timescales |
The policy has a clear start and end date and where possible, has interim milestones and targets that will be used to measure progress. |
N |
P |
Y |
|
5 |
Resource |
Does the policy quantify the resourcing requirement to deliver the stated impacts (e.g. finance)? |
N |
P |
Y |
Although some strategies where much more detailed than others in terms of the detail provided against individual policies, all the strategies provided sufficient information for us to understand how they would lead to an impact of the GHG emissions in their area. However, quantified information about the level of impact a strategy had was often high-level, not valued as an impact on territorial GHG emissions, or left as an open ambition.[2]
Selected local authority strategies
From the existing evidence review, we identified five climate change strategies that scored well across all of the screening categories. These climate change strategies were discussed with the steering group and we identified that all of the selected climate change strategies were across the central belt of the country. We therefore added a sixth strategy from a more rural local authority to ensure that we had a more diverse geographical spread. The six climate strategies matching the criteria were taken forward to the next task of valuating climate policies. The local authorities selected are shown in Figure 3 below.
|
Key |
Local authority |
Climate strategy name |
|
1 |
Argyll and Bute Council |
Decarbonisation Plan |
|
2 |
Stirling Council |
Climate and Nature Emergency Plan |
|
3 |
Perth & Kinross Council |
Climate Change Strategy and Action Plan |
|
4 |
Angus Council |
Sustainable Energy and Climate Action Plan |
|
5 |
Glasgow City Council |
Glasgow Climate Plan |
|
6 |
Dumfries and Galloway Council |
Carbon Neutral Strategic Plan |
In the following paragraphs, we present two example climate change strategies as representative of the strategies we reviewed.
Stirling’s Climate and Nature Emergency Plan was the highest-ranking strategy (table 3) we reviewed. This was due to the large array of topics covered, efficient writing style, the explanation of policies and how those could be translated into other local authorities and regions. It provided several emission impact figures for policies and actions to show the effect on the environment and highlighted how these would be resourced in the region. Stirling’s Climate and Nature Emergency Plan was also one of the few climate change strategies to mention their current territorial emissions, which is the key focus of this project. Mention of territorial emissions is usually a strong indicator that a climate change strategy would give thorough information around carbon impacts and implementation. Stirling’s Climate and Nature Emergency Plan estimated a territorial emission reduction of 1/3 between 2005 and 2018 and mapped out their future to show where the local authority wanted to be by 2030. This was one of many examples from Stirling’s Climate and Nature Emergency Plan that set it apart from other climate change strategies and provided a clear understanding of how the local authority wanted to meet their targets for territorial GHG emissions.
The Glasgow Climate Plan (Glasgow City Council, 2022) and Stirling Climate and Nature Emergency Plan (Stirling Council, 2022) were key examples of detailed climate change strategies that could be deployed to support a national transition to net zero. Both strategies gave detailed explanations of the current regional context which was pivotal in explaining why certain policies or actions had a greater impact than others. The strategies also highlighted the importance of developing and investing in climate policymaking to ensure polices they set are appropriate for the regions as well as the communities they serve, whilst aiming to minimise the (negative) impact on residents as much as possible. Another key area both strategies explore is the financial implications of initiatives, indicating whether projects are either already funded, part funded or if they are being financed. This is something the Glasgow Climate Plan provided details on more than any other climate strategy reviewed. Importantly, the strategies outlined the capacity requirements to adequately resource their polices and provided timebound milestones to monitor progress against.
Additional findings
Territorial emissions impact
Of the 69 climate change strategies, 56 either partially valued their emissions impact or failed to value the scale of their impact on GHG emissions at all. A common theme in the absence of territorial GHG emission impact was to apply a bespoke indicator as a measure of success, such as increasing the number of staff working remotely. The majority of climate change plans did not outline the methodologies applied in gathering and quantifying performance measures and targets, so it was often unclear how impacts would be measured.
The key aim of this research was to identify policies that could impact territorial GHG emissions in a major way. The top performing policies against the criteria were scored well because they quantified the anticipated impacts. Emissions were typically quantified as either a tonnage reduction in GHG emissions (tCO2e) or a percentage reduction against a baseline figure.
Resourcing, financing and timelines
56 of the 69 climate change strategies had fully or partially evidenced timescales for implementation and completion. adopt a unified approach.
The most mature climate change strategies also included considerations around cost, whether funding had been secured, who would be financing it and who would be delivering these policies. For example, Argyle and Bute’s Decarbonisation Plan (Argyll and Bute Council, 2021) outlines sources of funding against each individual policy, whether funding has been secured or still requires budget.
However, policies aimed at achieving the same outcome might do so on different timescales. There was no clear pattern across the climate change strategies on how timescales were decided upon. The exception to this rule was waste targets as they are set nationally, which is a good example of how other policy areas could do the same to territorial emissions and targets
Only 13 of the 69 climate change strategies cited their territorial emissions. Of those, only some set territorial emissions targets. It is not clear why this was the case. It could be due to local authorities not having updated information about their territorial emissions or because they were not confident in how they could enact change in their regions. Climate change strategies that specifically mentioned territorial emissions and set emissions targets for their area had more detailed action lists that went beyond council owned assets. This difference is important as it highlights some local authorities are being proactive in tackling territorial GHG emissions in the local authority area beyond just those of their own organisations.
Summary
The level of detail and consistency of targets and performance metrics showed that there was no clear and consistent approach to developing climate change strategies. This makes comparison and valuation of the climate strategies complex due to the non-uniform nature of presenting impact and the lack of detail around the methodological approaches applied.
The strategies we ranked high on our measures including scalability, replicability, and quantification of impacts, could form the basis of best-practice knowledge sharing, and setting of a national approach (see Appendix 13.1.1 for further detail). Our findings reflect those of recent research carried out by Environmental Standards Scotland (Environmental Standards Scotland, 2023) that recommended Scottish Government introduce a standardised Climate Plan template with mandatory reporting for local authorities. This recommendation would go some way to solving some of the challenges uncovered by this research.
Results of quantitative research
Overview
From the six climate strategies reviewed in detail (Figure 3), 61 distinct climate policies were extracted. The distribution of the policies across the GHG inventory categories is summarised in Figure 4.
Of the 61 policies extracted, most policies (26) targeted building emissions and are outside the scope of this research as they are covered by the exemplar LHEES approach that has already been rolled out nationally across all local authorities. This research intended to identify policies in other GHG inventory categories that have the same potential for rollout across local authorities. With building emissions excluded, the remaining 35 policies have the greatest numbers in transport (13), LULUCF (8) and industry (7) as shown in Figure 4.
Figure 4: Number of policies extracted, by GHG inventory.
Of the 35 policies, we could only collect sufficient information from 13 policies to be able to estimate potential GHG emission impact. These are described alongside example targets and KPIs in Appendix 13.5.
Policy scenario emissions
We analysed the 13 policies to estimate the potential GHG emission impact if they were to be scaled-up to the national level and enacted across all 32 local authorities. The potential GHG emission impacts are high-level indicative estimates using a basic methodological approach and incorporating multiple assumptions, as set out in Appendix 13.1.2 and 13.2. As such, the quantitative findings are indicative, illustrating the scale of potential impact that local authorities may have in tackling climate change. Further analysis would provide more accurate potential GHG impacts of policies.
The findings of this analysis are detailed Table 4. Each row in Table 4 contains a climate policy that originates from either a single local authority or multiple local authorities where policies were similar. Table 4 details that across the 13 policies assessed for their GHG emission impact, there is potential for an estimated 9 MtCO2e overall change to territorial emissions, or 22% of the current inventory emissions for Scotland.
The full breakdown of the indicative estimated potential impact on each individual local authority’s GHG inventory is presented in Appendix 13.6 and sources for the assumptions and conversion factors are included at Appendix 13.2.
For each of these 13 policies valued, we also show in Table 4 our assessment of the likelihood of each policy to cause a change in emissions if rolled out nationally to all local authorities, taking account sphere of control, capacity and capability, and the timescale over which a policy would be enacted. We also assessed the magnitude of the potential change. Both of these methodologies are outlined in IPCC guidelines (IPCC, 2006) and set out in Appendix 13.4. There will be widely ranging factors and contexts at an individual local authority level which have not been accounted for and that would significantly impact implementation of the policies assessed. In addition, there are critical wider factors such as future national policy development and available budget that were not incorporated into this quantitative analysis.
Findings
Comparing the policies evaluated in Table 4 with the Climate Change Plan sector envelopes (Scottish Government, 2020, p. 253) indicates that both LULUCF and transport policies have the greatest potential to impact territorial GHG emissions, with a high likelihood of the local authority being able to influence their outcome. Table 3 below shows estimated potential GHG emission reductions in these policy areas if implemented in each local authority.
The other policy areas evaluated may also compare favourably with the Climate Change Plan sector envelopes but local authorities have a more limited control on the outcomes. This is the case with policies relating to changes in agricultural practices. In addition, while seven industrial emission-related policies were present amongst the six climate strategies finalised, none sought to value their impact on territorial GHG emissions and provided limited definitive action. Instead, the industrial-emission-related policies opted for a model of getting organisations to sign up to climate change pledges. Policies that were either outside the local authorities’ sphere of influence, or policies that impacted centralised issues, such as waste management, were also not carried forward to interviews with local authorities.
|
Local authority |
1) Nature-based solutions |
2) Net zero transport | ||
|
Total LULUCF emissions (ktCO2e) |
Potential emission reduction (ktCO2e) |
Total Transport emissions (ktCO2e) |
Potential emission reduction (ktCO2e) | |
|
Aberdeen City |
31 |
-32 |
305 |
-63 |
|
Aberdeenshire |
357 |
-107 |
613 |
-72 |
|
Angus |
389 |
-52 |
235 |
-31 |
|
Argyll and Bute |
-532 |
-225 |
186 |
-24 |
|
City of Edinburgh |
70 |
-37 |
640 |
-139 |
|
Clackmannanshire |
24 |
-155 |
66 |
-15 |
|
Dumfries and Galloway |
-239 |
-59 |
571 |
-42 |
|
Dundee City |
23 |
-485 |
184 |
-40 |
|
East Ayrshire |
-31 |
-39 |
229 |
-34 |
|
East Dunbartonshire |
20 |
-41 |
113 |
-30 |
|
East Lothian |
194 |
-36 |
210 |
-30 |
|
East Renfrewshire |
23 |
-58 |
147 |
-38 |
|
Falkirk |
79 |
-115 |
327 |
-43 |
|
Fife |
345 |
-150 |
584 |
-101 |
|
Glasgow City |
68 |
-225 |
761 |
-170 |
|
Highland |
110 |
-1,489 |
598 |
-80 |
|
Inverclyde |
3 |
-55 |
106 |
-23 |
|
Midlothian |
52 |
-83 |
137 |
-26 |
|
Moray |
-167 |
-56 |
162 |
-26 |
|
Na h-Eileanan Siar |
951 |
-461 |
42 |
-8 |
|
North Ayrshire |
-32 |
-280 |
151 |
-37 |
|
North Lanarkshire |
90 |
-313 |
736 |
-97 |
|
Orkney Islands |
43 |
-181 |
29 |
-6 |
|
Perth and Kinross |
-140 |
-47 |
515 |
-42 |
|
Renfrewshire |
35 |
-76 |
301 |
-52 |
|
Scottish Borders |
-103 |
-51 |
261 |
-32 |
|
Shetland Islands |
572 |
-160 |
43 |
-7 |
|
South Ayrshire |
-55 |
-48 |
209 |
-31 |
|
South Lanarkshire |
-27 |
-152 |
666 |
-91 |
|
Stirling |
-150 |
-63 |
249 |
-25 |
|
West Dunbartonshire |
9 |
-56 |
127 |
-25 |
|
West Lothian |
48 |
-106 |
373 |
-51 |
|
Total |
2,059 |
-5,497 |
9,878 |
-1,527 |
Results of qualitative research
Overview
The results of the quantitative research found that policies in LULUCF and transport showed potential in having significant impacts on local authority territorial GHG emissions. To find out more about how these policies were developed, and the potential pathways to implementing similar policies at the national level, we interviewed local authorities who had leading policies in nature-based solutions and net zero transport.
Findings
The findings below combine evidence from our review of existing data and assessment of the key themes identified through thematic analysis of interviews.
Capacity and capability
It was clear from the interviews that lack of capacity to develop and deliver policies would likely hamper efforts in expanding policies across all local authorities in Scotland. We found that some local authorities had the resource and ability to hire specialist skills into the organisation. Through this they could actively engage with teams across the organisation to ensure policy ambitions were carried out. An example of this given by one respondent:
“It’s imperative to ensure that any planting of new trees considered multiple planning and climate aspects, impacting the species of tree selected, factoring in considerations about the future microclimate and requirements for future flood prevention.”
However, local authorities do not always know what skills they need to deliver on a policy ambition. One respondent explained that many policies require both multi-disciplinary expertise, such as project management, as well as specialist skills, such as ArcGIS[3], to properly manage the rollout of a policy.
One respondent explained that budget cuts mean that retaining enough resource within the organisation, with access to the right skills and expertise would be a defining factor in the success of climate policies’ targets. Respondents did signal that it was possible to access skills external to the local authority (e.g. through consultancy) but this was often ad hoc. Developing and implementing policies will require multi-year and decadal management to realise their full benefits. Not being able to retain the skills and resource within the local authority places their success at risk.
Data maturity
One of the respondents explained that having good quality data that is continually updated and shared across the organisation is critical to enabling policy development and delivery. The example provided was the data landscape for nature-based solutions policies, which is complex, onerous to compile and requires near-constant updating. For example, in the greening of derelict land, the classification of land as ‘derelict’ ebbs and flows as multiple stakeholders retain interest in the space. The local authority itself (potentially across multiple departments), private individuals, residents and developers may all have a stake in the use of the derelict land. Added to this is the difficulty of collecting accurate data about derelict land, such as carbon evaluation, existence of contaminants, appraisal of natural ecosystems and animal species, and importance to flood prevention. This information is needed to show causal links between greening derelict land and benefits such as heat reduction and carbon sequestration.
Data also enables a local authority to develop robust climate policies by identifying measurable KPIs and to set realistic timescales. Several climate change strategies we reviewed were at early stages of development and specifically referenced the need for additional research to complete the valuation of a policy’s impact. For example, several transport policies referenced other transport strategy documents in-development that sought to improve data maturity for the local area, and enable valuation of impacts and target setting. Timescales for the development of these strategies were not clear.
Collecting adequate data is key to the development, measurement, and success of a climate policy. However, the landscape is complex and demanding and interrelated to capacity and capability in the local authority as discussed above.
Geographical diversity
We found that the overarching aims of climate change strategies across Scotland are the same. However, sometimes these goals are were coupled with specific local issues. Therefore, motivations, KPIs, and targets by which the local authorities measure the performance of climate related policies often differ. This has a knock-on effect on the data and capacity needed to implement policy across diverse communities.
One clear example of this is in homeworking policies. In large island communities that have a widely dispersed rural communities, home working and flexible working has benefited commuters who do not need to travel great distances to reach their work location. One interviewee explained that the policy has helped island communities to overcome other issues such as the lack of public transport provision. Similar homeworking policies also exist in cities with a specific focus on reducing the amount of traffic congestion within the city centre at peak times. Both sets of policies have differing motivations for enacting homeworking polices but the end benefit of reduced air pollution is the same.
Accountability and ownership
We found that climate policies often span multiple departments within an organisation. In some circumstances this led to ambiguity around accountability for the successful delivery of a policy. One respondent explained that for nature-based climate policies, using afforestation as a specific case in point, the responsibility and budget for tree planting might fall with a local authority’s parks department. However, responsibility to actively manage LULUCF from a climate perspective might reside with the sustainability or planning departments. This leads to complexities around who in a local authority needs to be consulted for LULUCF projects and who has ultimate ownership of a policy being successfully enacted. Respondents referenced that it is not uncommon for there to be “a lot of silo working” across departments, so projects that might impact on a climate policy are not always communicated, or vice versa. Respondents also noted that there tends to be an aversion to taking on or sharing climate policy responsibilities because it is a change from how departments have functioned in the past,
“[we] have always done it this way so why would we do it another way”.
Funding
Funding, or the lack thereof, was a common theme across respondents. One respondent noted that there is a lack of funding available to commission external expertise, for example the delivery of a feasibility study. This hampered efforts to collect the information needed to develop robust policies and set realistic targets. It was clear from the strategies reviewed that only a few local authorities sought to quantify the funding requirement to deliver policies.
A strong theme was the lack of funding to attract and retain talent within the local authorities. One example given was that of senior planners, who are required within in a local authority to appropriately manage LULUCF. We were told:
“[Local authorities] advertised at between £39,000 and £48,000 per annum while the private sector advertises similar roles for between £48,000 and £68,00 per annum”.
This leads to expertise being stripped out of the public sector by the private sector after employees have gained a few years’ experience.
There are several avenues of funding available to Scottish local authorities. However, it was the view of respondents that funding was piecemeal, short-term where local authorities needed a longer-term financial commitment and finite, which leads to competition across local authorities. There was a view shared across respondents that funders such as Scottish Government and NatureScot should look to review how funding is administered. A model was suggested in which funders work directly with each individual local authority to identify areas where funding could have the greatest impact at the local level. There was appreciation though that both Scottish Government and NatureScot are themselves suffering from budget and resourcing pressures to many of the local authorities, which hampers efforts to change existing models.
Summary
While very limited, the qualitative evidence indicates that many of the barriers highlighted by the interviews are aligned to those presented in the climate strategy documentary review. Further, the interviews also indicate that these barriers are interlinked and require a holistic approach to be overcome. For example, the lack of funding directly impacts capacity and capability within local authorities to deliver climate policy. This in turn directly impacts the maturity of data across the sector and, again, the local authority’s ability to deliver robust climate policies.
Considering the identified barriers to enacting climate policies, local authorities have nevertheless made significant inroads to developing some best-in-class policies that go above and beyond national ambitions. This is evident in the detail and narrative presented in multiple climate strategies. This shows there is a major interest and commitment by local authorities to tackle their territorial emissions. While policymaking in this area is limited in its scope, scale and consistency, local authorities interviewed demonstrated keenness to increase action.
Combined results
Table 4 combines the quantitative and qualitative research’s estimated potential impacts for the policies should they be implemented nationally. Appendix 13.1.2 describes the methodology used to arrive at the figures included and Appendix 13.2 lists the sources used.
|
Inventory / Policy |
Current territorial emissions |
Potential National Policy emission impact estimate |
Interim target emission impact |
% change from current |
Likelihood |
Magnitude |
Interim target year |
Policy target year |
|
Agriculture |
7,985 |
-1,416 |
-907 |
-17.73% | ||||
|
Changes to Agricultural Practices |
-1,416 |
-907 |
-17.73% |
Possible |
Major |
2025 |
2030 | |
|
Buildings (not accounted) |
11,600 |
0 |
0 |
0.00% | ||||
|
Industry |
7,798 |
0 |
0 |
0.00% | ||||
|
LULUCF |
2,059 |
-5,497 |
-1,159 |
-266.94% | ||||
|
Greening of derelict land |
-2,167 |
N/A |
-105.23% |
Likely |
Major |
2025 |
2040 | |
|
Peatland restoration |
-2,530 |
-1,150 |
-122.86% |
Possible |
Major |
2030 |
2045 | |
|
Reforestation (1 million new trees per local authority) |
-800 |
-9 |
-38.85% |
Likely |
Moderate |
2030 |
2045 | |
|
Transport |
9,878 |
-1,527 |
-258 |
-24.02% | ||||
|
Active travel |
-793 |
N/A |
-16.59% |
Unlikely |
Major |
N/A |
2030 | |
|
Homeworking |
-0.31 |
N/A |
-0.00% |
Likely |
Minor |
N/A |
2026 | |
|
Low Emission Zone |
-129 |
N/A |
-1.30% |
Very likely |
Moderate |
N/A |
2030 | |
|
Public transport |
-169 |
-76 |
-1.71% |
Likely |
Moderate |
2030 |
2045 | |
|
Fleet vehicles |
-124 |
-26 |
-1.26% |
Likely |
Moderate |
2025 |
2030 | |
|
Council Business Travel |
-235 |
-118 |
-2.38% |
Very likely |
Moderate |
2030 |
2045 | |
|
LEV Taxi Licences |
-76 |
-38 |
-0.77% |
Likely |
Minor |
2032 |
2045 | |
|
Waste |
1,333 |
-541 |
-306 |
-40.57% | ||||
|
Waste Reduction Strategy |
-520 |
-290 |
-39.03% |
Likely |
Major |
2025 |
2045 | |
|
Council Waste Reduction |
-21 |
-16 |
-1.55% |
Very likely |
Moderate |
2030 |
2045 | |
|
Scotland Total |
40,653 |
-8,981 |
-2,629 |
-22.09% |
Policy briefing: Nature-based solutions
Background
Biodiversity loss and the destruction of natural habitats is directly linked to climate change. Scottish forests, peatlands and bogs contribute to healthy eco systems. These systems work to remove CO2 from our atmosphere and in some areas become large carbon sinks. According to the Biodiversity Intactness Indicator, Scotland has seen a 15% decline in its natural capital since 1950 with only 64% of our protected woodlands being in a favourable or recovering condition (Scottish Government, 2022).
|
Policy |
Nature-based solutions |
|
Description |
Changing land use – particularly on areas of derelict land – that directly improves carbon sequestration potential through improvements in management practices, afforestation, repairing damaged ecosystems such as peatland, and greening of derelict land. |
|
Potential estimated national impact |
-5.4 MtCO2e |
|
Broader impacts |
|
Figure 5 shows the total estimated impact on LULUCF territorial GHG emissions by each individual policy, moving the inventory from 2.1 MtCO2e emission per annum to (negative) -3.4 MtCO2e through a combination of three polices.
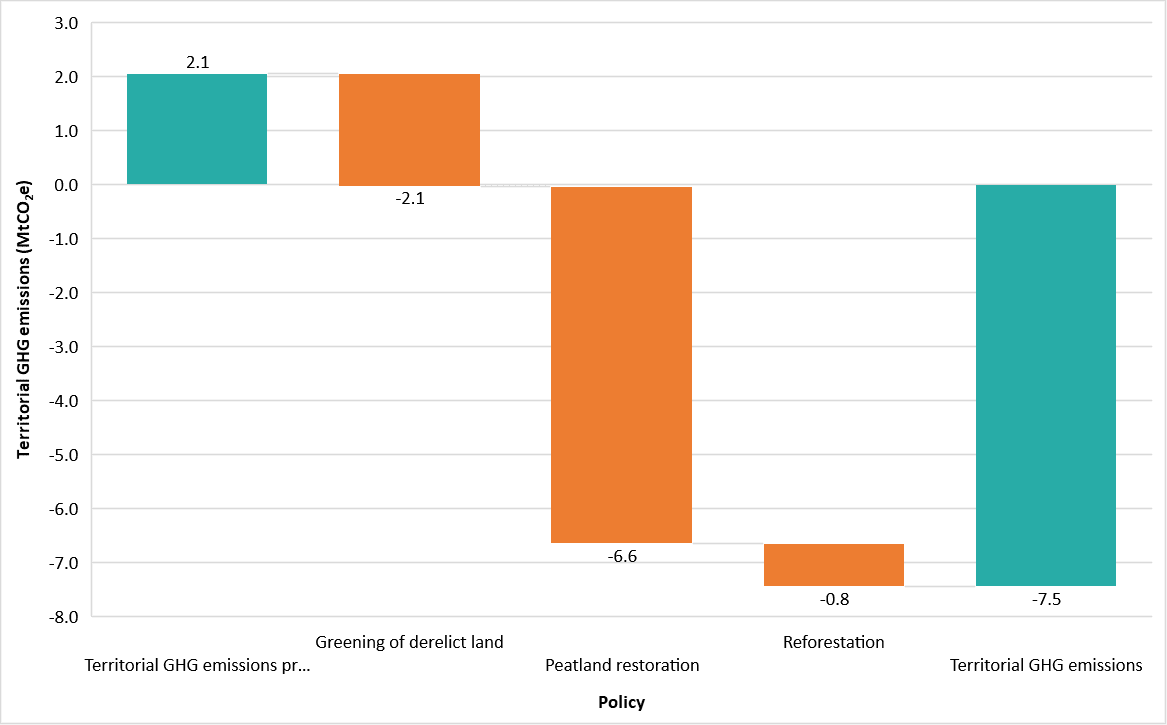
Figure 5: Potential impact on LULUCF territorial GHG emissions across Scotland for a nature-based solutions policy
Greening Derelict Land
The rewilding policy outlined in Glasgow’s Climate Plan (Glasgow City Council, 2022) was one of the most developed we found during the quantitative review. It was used as the foundation to value the potential impact of nation-wide greening of derelict land. NatureScot estimated the total area of urban vacant and derelict land in Scotland in 2017 to be 11,649 hectares (Nature Scot, 2022). Across Scotland, 35% (4,077 ha) of urban vacant and derelict land can be thought of as being uneconomic to develop and/or is viewed as suitable to reclaim for a ‘soft’ end use (i.e. non-built use). The most common new use for sites that were previously urban vacant and derelict land was for residential development, with 50% of sites reclaimed for this purpose (Nature Scot, 2022). Changing land use for derelict land comes with many challenges for local authorities to consider including potential decontamination, private ownership, stakeholder relations, and internal ownership of the policy (see findings from the qualitative research in Section 7).
We have given an interim target of 2025 for greening to reach an estimated net gain in carbon sequestration potential of 2.2 MtCO2e across Scotland by 2040. This figure is an upper bound estimate and was calculated on the basis of the following significant assumptions:
- 50% of the uneconomic land could be ’greened’ as described above.
- Derelict land is assumed to be neutral grassland that can be converted to coniferous woodland, applying carbon stock estimates (tC / ha) by habitat type and converting to MtCO2e (Carbon Rewild, 2020).
- Afforested trees would reach their peak potential sequestration between 16 and 25 years of age (Carbon Store, n.d.).
Peatland Restoration
Scotland’s Nature Agency estimates that Scotland has some 1.8 Mha of blanket bog, representing 23% of the total land area (NatureScot, 2023). It is estimated that up to 80% of the total peatland area (1.44 Mha) is damaged. We have drawn on several policies across three local authorities that had detailed peatland restoration ambitions. The policies we reviewed sought to meet the pace of restoration set by Scottish Government of 20,000 ha restored per annum, with a target of 250,000 ha restored by 2030 (Scottish Government, 2020). Maintaining this pace of change to 2045 would mean a potential restoration of 0.55 Mha of peatland by 2045. The International Union for Conservation of Nature (IUCN) estimates that up to 4.6 tCO2e per hectare could be reduced by restored peatland (IUCN, 2010). This produces an estimated carbon reduction potential of 2.5 MtCO2e.
A strong caveat to the total potential restoration area is that much of the peatland across Scotland is under private ownership. Local authorities have limited powers outwith their own land ownership and may face significant challenges in convincing some private landowners to restore the peat on their land. In the absence of clear data on the area of peatland under private ownership, or other ownership covenants, for the purposes of estimating a potential GHG emission reduction we have made the broad assumption that these challenges could be overcome. However, if these challenges cannot be overcome it would severely reduce achievable emissions reductions.
Afforestation
We have used Stirling’s Climate & Nature Emergency Plan (Stirling Council, 2022) reforestation policy to plant 360,000 new trees by 2030, and 1 million new trees by 2045 as the basis for the modelled figures. The average kilogram of carbon dioxide sequestered by a mature tree is between 10kg CO2 and 40kg CO2 depending on age, species, and growing environment (EcoTree, 2023). For the purposes of estimation, 25kgCO2 / tree / per annum has been used. Scaling this ambition to the national level, the total estimated removal of 0.8 MtCO2 per annum across Scotland.
There are significant assumptions that sit behind the above estimation. These include:
- Stirling’s policy does not specify the type of land that will be converted, the detailed timescales for planting (impacting when the new tree stock will be at maturity), nor the preferred species of tree to be reforested.
- The policy does not value the GHG emission impact of planting new trees.
- We have assumed that the afforested trees will sequester emissions at their peak potential (i.e. a mature forest). This means the estimated emissions removals are limited by the fact we have not modelled a progressive change in sequestration over time, accounting for the growth of new woodland, such as that outlined by the Woodland Carbon Code (UK Woodland Carbon Code, 2021).
Summary
During our research we found that local authorities were eager to develop and create policies for land use that could make a quantifiable impact. One common theme across all local authorities was the consideration of peatland as one of the most impactful policies to reduce their carbon emissions. There are abundant resources provided by the IUCN peatland code (IUCN, 2023) that local authorities could access to begin developing strong peatland restoration policies.
Policy briefing: Net zero transport
Background
Scotland has ambitious targets to reduce transport emissions to net-zero by 2045 (Transport Scotland, 2019a). Transport emissions are one of the largest GHG inventory categories, accounting for 24% of overall territorial emissions (DESNZ, 2023). This is reflected in the number of transport policies identified across local authority climate change strategies. The policies in the section below demonstrate how local authorities are driving forward transport solutions.
|
Policy |
Net zero transport |
|
Description |
Supporting the nation’s transition to net zero transport through a combination of policies tackling public and private transport methods, including promoting active travel and implementing low emission zones. |
|
Potential estimated national impact |
-1.5 MtCO2e |
|
Broader impacts |
|
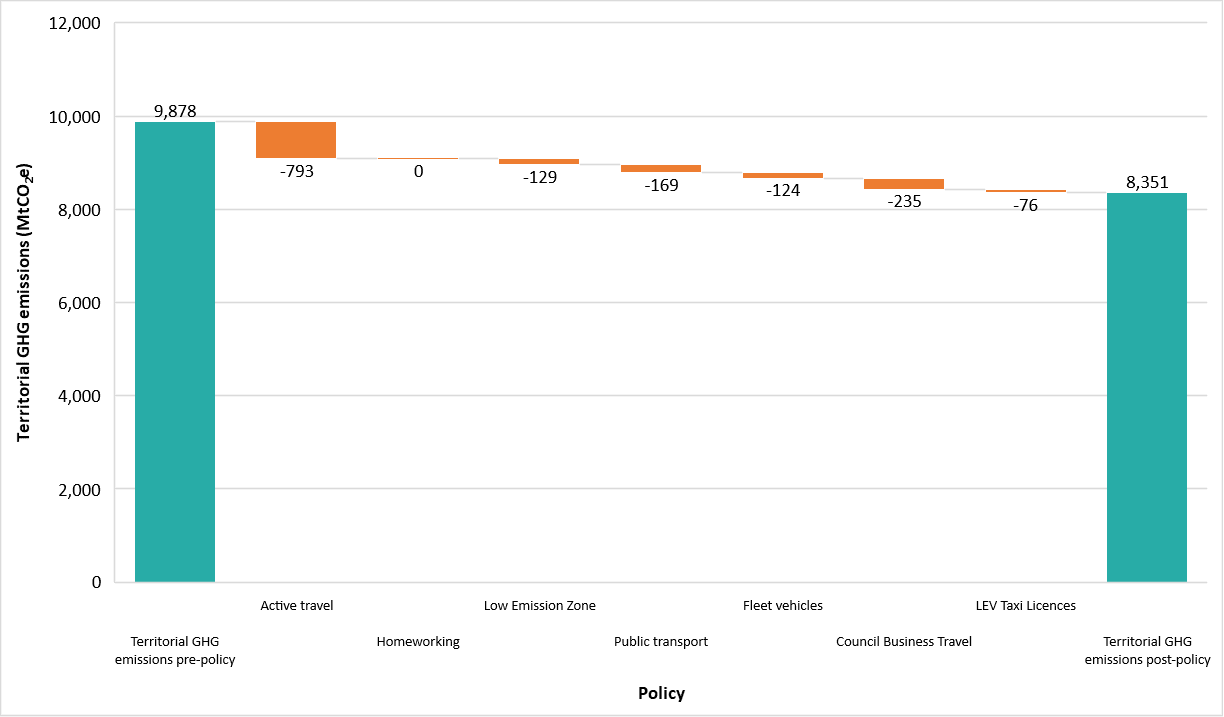
Figure 6: Potential impact on transport territorial GHG emissions across Scotland for a net zero transport policy
Figure 6 shows the total estimated impact on transport GHG emissions by each individual policy, moving the inventory from 9,878 MtCO2e emission per annum to 8,351 MtCO2e through a combination of seven polices.
The Scottish National Transport Strategy states that 40% of transport emissions come from fossil fuelled cars. Recognising the impact that internal combustion engine cars have, local authorities have started to introduce policies targeted specifically at reducing these emissions. (Transport Scotland, 2019a).
High private use car use does not just affect GHG emissions, it also has a significant impact on air quality, health and pedestrian safety. Private car use contributes to high pollutions levels and with transport contributing to 1/6 of Scotland’s particulate matter (PM10) it is clear this is an area for policy focus (Transport Scotland, 2019a).
Local authorities understand the need for potent policies to be in line with national targets such as the goal to reduce car kilometres driven by 20% by 2030. These range from encouraging more active travel through the creation of active travel corridors and implementing low emissions zones in congested zones.
Active transport
The figures for this policy were modelled using Argyll and Bute Council’s Decarbonisation Plan 2022-2025 (Argyll and Bute Council, 2021). £2.3 million has been invested in delivering a wide range of active travel initiatives such as improved pathways, community cycle repair stands, cycle parking and new cycling routes. Through a combination of similar initiatives, a viable aim would be to convert 47% of remaining road journeys of up to 3km to active travel, which was the average proportion of active travel journeys up to 3km in 2019 (Transport Scotland, 2019b). The Council has committed to develop an Active Travel Strategy that would drive the policy forward at a future stage, but up to this point, resource to deliver the policy is dependent on external funding awards and is not covered by council budgets.
Homeworking
This policy has been valued as a proportion of the 262,000 Scottish FTE public sector total workforce (Scottish Government, 2022) working from home for 50% of their contracted hours. Reducing the average commute of 20 km round trip to office locations made in 73% of circumstances by personal car (Scottish Government, 2022b). Further potential emission reductions could be achieved through reduced operation of offices, such as heating, lighting, equipment and other operational emissions, although these have not been factored into our current study. However, it should be noted that emissions from reduced transport are minimal due to increased emissions associated with staff working from home (Riley et al., 2021).
Low-emission zones
Currently, there are four low emission zones (LEZ) in Scotland with enforcement for Dundee, Aberdeen and Edinburgh being introduced in 2024. Glasgow’s LEZ is integrated with the City Development Plan 2, Glasgow Transport Strategy and their Climate Plan to implement the change. The LEZ has been operating since 2018 with the aim of encouraging more active travel and public transport use in the city centre. The policy was implemented in phases to ensure low levels of disruption for residents, which should be a key consideration if scaling this across Scotland. Using findings from the London LEZ (Mayor of London, 2023), we have assumed a 4% CO2 saving on emissions from transport on minor roads, to account for the fact LEZs will likely be operational in urban areas.
Decarbonisation of public transport
Climate targets published in the Stirling Climate & Nature Emergency Plan (Stirling Council, 2022) aim to reduce GHG emissions from public transport by an interim target of 25% in 2030, with an overall target of 75% by 2045. This has been extrapolated using population as a function to estimate the number of people served by public transport. However, the provision of public transport across Scotland is dependent on several factors, including sparseness of the population and socioeconomic circumstance, which are not accounted for in the potential emissions impact estimation. Further work should be undertaken to quantify the benefits.
Decarbonisation of fleet vehicles
This policy’s emissions were modelled using the estimated number of 28,800 fleet vehicles in the Scottish public sector (Scottish Futures Trust, 2022). We applied a conversion factor for assumed petrol cars, diesel LGVs and HGVs (BEIS, 2023). The average number of kilometres travelled annually is 12,000 km (Scottish Futures Trust, 2022). Post-conversion to EV emissions are zero, as per emission factor guidance. It is worth noting that EV technology for HGVs is under development and may not play a major role until post-2030 (Transport & Environment, 2023).
Council business travel
These emissions were estimated based on climate targets published in the Stirling Climate & Nature Emergency Plan (Stirling Council, 2022). The plan sets out the ambition of reducing baseline transport emissions (4,450 tCO2) by the interim target of 45% by 2030, and the overall target emission reduction of 90% by 2045. This has been applied across the other local authorities, using population as a proxy. Further research to quantify emissions for each local authority would need to be carried out to refine these estimates.
LEV taxi licences
Stirling Climate & Nature Emergency Plan (Stirling Council, 2022) sets out the authority’s commitment to 100% of all taxis operating in the region being EVs by 2045. Using this as a foundation, we have valued the policy ambition in potential national GHG territorial emission impact.
There are 20,396 taxi licences registered across the 32 local authorities in Scotland of which 9,928 were registered as of 2021 (Transport Scotland, 2021). 1.9% are thought to be ULEVS (DfT, 2023). The policy will seek to increase the share of ULEV licences to 100% by 2045 effectively curtailing the emissions from private car hire.
To calculate the GHG emission impact, we anticipate that the average number of kilometres travelled per annum per capita is 80.85 km taken from the average number of trips made in the UK, by mode of transport (DESNZ, 2023) across the population of Scotland (5,563,000). Assumed that most private hire taxis are diesel cars, we applied the emission factor for a diesel car from BEIS company reporting datasets (BEIS, 2023) to calculate a saving on emission of 76.36 ktCO2e.
Summary
It is clear from our research that transport is a key focus for all local authorities across Scotland due to the interlinked impacts spanning multiple socio-economic factors. Transport policies are very publicly visual in their delivery, making it easy for local authorities to point toward action being taken. In this section we have outlined some of the transport-related policies that could potentially be rolled out across Scotland’s local authorities. There is great potential to support local authorities to drive ambitious change in transport emissions, many of whom are already showing innovative solutions to enacting change in their local area. We have also given high-level estimates of potential emissions reductions if some of the most mature existing travel policies were scaled up.
Conclusions
Through pursuit of Local Heat and Energy Efficiency Strategies (LHEES), the Scottish Government has set the foundations for local authorities to drive their own locally led net zero agendas, directly tackling territorial greenhouse emissions from buildings. This research sought to investigate the role of local authorities in addressing emissions across other inventory categories, to replicate the success and best practice generated by LHEES.
From the evidence reviewed and from the interviews with local authorities, it is clear that there is local authority ambition to deliver climate policies that tackle local climate challenges, at the same time as delivering emissions reductions that go above and beyond national targets. Our climate strategy register details 69 current local authority climate-relevant strategies and describes the action being taken across all emission categories. We uncovered several climate change strategies that clearly detail intent, value their potential impacts and address resourcing and funding needs. Further research could be carried out to establish best-practice guidance on the development of climate policies, using existing local authority approaches as the foundation. This would help improve consistency across local authorities in how they value policy impacts and Scottish Government’s understanding of the resourcing, skills and funding needed to deliver.
This research assessed local authority strategies and policies to find where the most mature and impactful local authority climate policies have been developed. We scaled-up the emission reduction potential of the strongest of these local policies to give high-level-indicative estimates of what the impact could be in other local authorities and at a national level. Combining all of the analysis, we identified the greatest potential for impactful local authority controlled policies on territorial emissions to be within the LULUCF and transport categories.
For these to be implemented across Scotland, we found that the Scottish Government has a key role to play. They can provide effective leadership through facilitating best-practice knowledge sharing, improved access to skilled resource and targeted funding initiatives.
Territorial GHG policies are complex and data-driven, requiring specialist resource to develop and deliver, which we found does not always exist within individual local authorities. The Scottish Climate Intelligence Service has recently been launched in response to this barrier for many local authorities. Further research could expand on the capacity and capability requirements to deliver local authority climate policies between now and 2045, including methods by which the resourcing needs could be met.
Finally, funding is key to driving forward all the strategies and policies we have reviewed in this research. There are many pockets of funding available to local authorities to deliver climate policies. However, the interviews show that the funding is often piecemeal and short-term. Further investigation could help quantify the funding available for tackling each GHG inventory, where further funding might best be directed and methods for administrating funding to ensure that national ambitions can be met.
References
Argyll and Bute Council, 2021. Decarbonisation Plan 2022-2025, s.l.: s.n.
Audit Scotland, 2022. Scotland’s councils’ approach to addressing climate change. s.l.:s.n.
BEIS, 2022. Digest of UK Energy Statistics – Annual data for UK, 2021, London: Crown.
BEIS, 2023. Government conversion factors for company reporting of greenhouse gas emissions. [Online]
Available at: https://www.gov.uk/government/collections/government-conversion-factors-for-company-reporting
BEIS, 2023. Green Book supplementary guidance: valuation of energy use and greenhouse gas emissions for appraisal, London: Crown Commerical.
BEIS, 2023. UK Greenhouse Gas Emission Statistics: Frequently Asked Questions, London: Crown Copyright.
Carbon Rewild, 2020. Exploring the Carbon Capture Potential of Different Land Types. [Online]
Available at: https://carbonrewild.com/exploring-the-carbon-capture-potential-of-different-land-types/#:~:text=Wetlands%20are%20globally%20considered%20a,grow%20in%20or%20on%20water
Carbon Store, n.d. Carbon Sequestration. [Online]
Available at: https://carbonstoreuk.com/publications/carbon-sequestration-the-basics/#:~:text=As%20trees%20grow%2C%20the%20process,CO%E2%82%82%20as%20they%20are%20sequestering.
Climate Change Committee, 2022. Progress in reducing emissions in Scotland – 2022 Report to Parliament, s.l.: s.n.
Climate Change Order, 2015. Climate Change (Duties of Public Bodies: Reporting Requirements) (Scotland) Order 2015. s.l.:s.n.
DESNZ, 2023. Average number of trips by purpose and main mode. [Online]
Available at: Average number of trips by purpose and main mode
DESNZ, 2023. UK local authority and regional greenhouse gas emissions national statistics, 2005 to 2021. [Online]
Available at: https://www.gov.uk/government/statistics/uk-local-authority-and-regional-greenhouse-gas-emissions-national-statistics-2005-to-2021
[Accessed 01 November 2023].
DfT, 2023. NTS0409: Average number of trips and distance travelled by purpose and main mode: England, 2002 onwards, s.l.: Department for Transport.
EcoTree, 2023. How much CO2 does a tree absorb?. [Online]
Available at: https://ecotree.green/en/how-much-co2-does-a-tree-absorb
Environmental Standards Scotland, 2023. An investigation into the effectiveness of the systems in place to support local authorities in their duty to contribute to the delivery of climate change targets, s.l.: s.n.
Glasgow City Council, 2022. Glasgow’s Climate Plan, Glasgow: Glasgow City Council.
Greenhouse Gas Protocol, 2014. Policy and Action Standard: An accounting and reporting standard for estimating the greenhouse gas effects of policies and actions, s.l.: World Resources Institute.
HM Treasury, 2020. Magenta Book: Central Government guidance on evaluation, London: UK Government.
Improvement Service, 2023. Climate Intelligence Service. [Online]
Available at: https://www.improvementservice.org.uk/products-and-services/consultancy-and-support/climate-change/climate-intelligence-service
IPCC, 2006. Guidelines for National Greenhouse Gas Inventories, s.l.: s.n.
IUCN, 2010. Peatlands and Greenhouse Gas Emissions Reduction in Scotland, s.l.: IUCN.
IUCN, 2023. Peatland Code. [Online]
Available at: https://www.iucn-uk-peatlandprogramme.org/peatland-code-0
Mayor of London, 2023. Inner London Ultra Low Emission Zone Expansion One Year Report. [Online]
Available at: https://www.london.gov.uk/programmes-strategies/environment-and-climate-change/environment-and-climate-change-publications/inner-london-ultra-low-emission-zone-expansion-one-year-report?auHash=IxeIM3L6iJh-CwYvb2wek2UKMCSJvpOqMgtpRAMt5B8
Nature Scot, 2022. LLC3 Urban Vacant and Derelict Land, s.l.: s.n.
NatureScot, 2023. Blanket bog. [Online]
Available at: https://www.nature.scot/landscapes-and-habitats/habitat-types/mountains-heaths-and-bogs/blanket-bog#:~:text=Blanket%20bog%20is%20one%20of,23%25%20of%20our%20land%20area.
Net Zero, Energy and Transport Committee, 2023. The role of local government and its cross-sectoral partners in financing and delivering a net-zero Scotland, Edinburgh: The Scottish Parliament.
Scottish Futures Trust, 2022. Phasing out petrol and diesel cars & vans from public sector fleet, Edinburgh: Scottish Futures Trust.
Scottish Government, 2020. Update to the Climate Change Plan 2018 – 2032: Securing a Green Recovery on a Path to Net Zero, s.l.: s.n.
Scottish Government, 2022a. About public sector employment statistics. [Online]
Available at: https://www.gov.scot/publications/about-public-sector-employment-statistics/pages/local-government-employment/
Scottish Government, 2022b. Census data – Transport. [Online]
Available at: https://www.scotlandscensus.gov.uk/census-results/at-a-glance/transport/
Scottish Government, 2022. Biodiversity strategy to 2045: tackling the nature emergency, Edinburgh: ScotGov.
Scottish Government, 2022. Public Sector Employment in Scotland Statistics for 2nd Quarter 2022. [Online]
Available at: https://www.gov.scot/publications/public-sector-employment-scotland-statistics-2nd-quarter-2022/pages/6/
SSN, 2023b. Reporting: Public Bodies Climate Change Duties. [Online]
Available at: https://sustainablescotlandnetwork.org/reports
[Accessed 07 07 2023].
Stirling Council, 2022. Climate and Nature Emergency Plan 2021 – 2045, Stirling: Stirling Council.
Transport & Environment, 2023. Electric HGVs will soon be cheaper overall than diesels in the UK. [Online]
Available at: https://www.transportenvironment.org/discover/electric-hgvs-will-soon-be-cheaper-overall-than-diesels-in-the-uk/
Transport Scotland, 2019a. National Transport Strategy, Edinburgh: s.n.
Transport Scotland, 2019b. Transport and Travel in Scotland 2019: Results from the Scottish Household Survey, Edinburgh: s.n.
Transport Scotland, 2021. Scottish Transport Statistics, Glasgow: ScotGov.
Transport Scotland, 2022. Scottish Transport Statistics (2021) Personal and cross-modal travel, s.l.: Transport Scotland.
UK Woodland Carbon Code, 2021. 3.3 Project carbon sequestration. [Online]
Available at: https://www.woodlandcarboncode.org.uk/standard-and-guidance/3-carbon-sequestration/3-3-project-carbon-sequestration
Williamson, R., Sudmant, A., Gouldson, A. & Brogan, J., 2020. A Net-Zero Carbon Roadmap for Edinburgh, s.l.: PCAN & Edinburgh Climate Commission.
Appendices
Detailed methodology
Selection of climate strategies
The research identified 69 separate climate-related strategies across the 32 local authorities. To determine which were the key strategies to take forward to develop greenhouse gas emission boundaries, we designed five selection criteria to score each of the strategies against the metrics in 3.
We developed a screening matrix that ranked the strategies against five criteria outlined in Table 5 and determined the level of maturity on a scale of 1-3, assessing the level of evidence provided in a climate change strategy as yes / no / partial. We further embellished the five section criteria to ensure the strategies selected covered, as a collective, each of the six greenhouse gas emission inventories
Following presentation of the final policies selected with the steering group, a further consideration was made to ensure that at least one climate strategy from a local authority located outside of Scotland’s central belt was included, to ensure a better geographical spread. This resulted in the addition of Dumfries and Galloway Council to the climate boundary task.
Greenhouse gas emission boundaries and scenario emissions calculations and limitations
It is impractical to measure greenhouse gas emissions impact in real time from every chimney, exhaust, or acre of land use. GHG emission estimates are based on a series of models that estimate emissions from different sources (BEIS, 2023). The calculations performed for each of the scenario emissions is in line with international guidance (IPCC, 2006). We used government conversion factors for company reporting of greenhouse gas emissions (BEIS, 2023), Green Book supplementary guidance on the valuation of energy use and greenhouse gas emissions for appraisal (BEIS, 2023) and from IPCC guidance (IPCC, 2006). Other sources were researched from literature in the absence of standardised sets of emission factors.
The basic equation used to quantify scenario emissions is:
Equation 1: GHG scenario emissions
- Activity data is a variable that is changed by a policy. For example, a policy may look to reduce the number of kilometres travelled by private car.
- Emission factor is a constant that is used to convert the activity data to an impact. In most cases, this will be a GHG emission conversion factor.
- The impact estimate can either form a policy target or metric by which to measure success. Typically, this will be a GHG emission saving but it could also include other benefits (e.g. societal).
An example of this methodology in practice would be estimating GHG emissions from vehicles. The activity data might be the total number of kilometres travelled by that type of vehicle and the emission factor would be the amount of CO2 emitted per kilometre.
Emission factors for energy sources are either dependent on the fuel characteristics (for emissions of CO2) or how the fuel is burned, for example the size and efficiency of equipment used. For other sources, the emission factor can be dependent on a range of parameters, such as feed characteristics for livestock or the chemical reactions taking place for industrial process emissions. Emission factors are typically derived from measurements on several representative sources and the resulting factor applied to all similar sources in the UK.
This approach follows the ‘Tier 1’ approach as set out in IPCC guidance for national greenhouse gas inventories (IPCC, 2006):
|
Uncertainty → |
Tier 1 |
|
Detail and complexity → |
|
Tier 2 |
| ||
|
Tier 3 |
|
Table 5: Quantification of GHG emission impact
An example of how an emission factor was applied to an activity is converting 1 tonne of municipal waste to 1 tonne of recycled waste as part of a landfill reduction strategy. Using emission conversion factors from government conversion factors for company reporting (BEIS, 2023), 1 tonne of waste sent to landfill has a greenhouse gas intensity of 497 kgCO2e/tonne. A tonne of waste recycled has a greenhouse gas intensity of 21 kgCO2e/tonne. Comparisons made between the two indicate a net greenhouse gas benefit of avoiding waste going to landfill.
As noted in Table 5, this is a basic methodological approach, using emissions and conversion factors from representative sources not specific to Scottish local authorities. In some instances, population data has been used as a proxy where local authority specific data was not available. The activity data was also derived from a variety of sources encompassing a range of levels of confidence (see Appendix 13.2). As such there is a high level of uncertainty in the estimated projected emissions reductions.
Sources for emissions equations
As described in the methodology section above, the figures presented in Tables 3, 4, 12, 13, 14, 15 and 16 and Figures 5 and 6 used the basic equation activity data x emission factor. The emissions factors were primarily drawn from Green Book supplementary guidance: valuation of energy use and greenhouse gas emissions for appraisal (BEIS, 2023) and Guidelines for National Greenhouse Gas Inventories (IPCC, 2006). However, in some cases additional sources were drawn on. The activity data was calculated using a range of sources. The sources are presented in Table 7 below, by GHG inventory category.
Table 7: Sources for emissions calculations by inventory category
Climate change strategy register
|
Organisation |
Strategy |
Summary description (150-250 words) |
|---|---|---|
|
Aberdeen City Council |
Climate Change Plan |
This builds on Aberdeen’s route map to net zero and has many actions to reduce carbon emissions and build resilience. It includes their reported emissions, climate risks and adaptation, targets for buildings, mobility and behaviour change and how these are aligned to the SDGs. Actions include: low carbon/renewable energy installations, zero emission council fleet, upgraded street lighting and nature-based solutions for council owned land. |
|
Aberdeen City Council |
Electric Vehicle Framework |
This framework was released in 2021 and the objectives are to identify how the city’s charging infrastructure should be increased and managed, ensure that the Council’s policies and strategies facilitate a greater uptake of EVs, outline what supporting measures are required, identify the key groups that should be involved in delivering the framework and set out the costs involved in delivering the framework. Actions include to increase EV charge points, identify key groups that should be involved in delivering this framework, ensure the council’s policies and strategies facilitate a greater uptake of EVs. |
|
Aberdeen City Council |
Waste Implementation Plan and Policy |
This strategy sets out the plans to manage waste until 2025, introducing new waste infrastructure and recycling services. The main targets set in this document are; waste growth to be eliminated by 2015, for Aberdeen to be aligned with the Scottish Government’s Zero Waste Plan 2010, to introduce an organic waste collection for all households by 2016, develop facilities within the Aberdeen Area to recover resources and for no more than 5% of household waste to be landfilled by 2025. |
|
Aberdeen City Council |
Local Transport Strategy |
This strategy is broad and covers elements such as maintenance, management, support but have a focus on sustainable development and travel covering areas such as ultra low emission vehicles, school travel and climate change mitigation and adaptation. Objectives in this section include enabling development that reduces the need to travel and minimises the reliance in personal care use and facilitates sustainable travel methods of walking and cycling when land planning. Travel packs should be provided for users of workplaces and schools by developers so there is future planning for sustainable transport use. Aberdeen City has been making improvements to accessibility of EV chargers, developing a comprehensive publicly accessible charging network serving the City and the trunk and strategic road network in partnership with the Energy Saving Trust (Scotland), Transport Scotland and the Office for Low Emission Vehicles. EV charging points are also included in their LDP. |
|
Aberdeen City Council |
Local Housing Strategy |
The vision for this strategy is for the people of Aberdeen to live in good quality sustainable homes, which they can afford and that meet their needs. This strategy covers fuel poverty, climate change, homelessness issues and the condition of the housing stock. The fuel poverty targets are aligned with the national statutory targets set out by ScotGov. The key actions to achieve this include improving energy efficiency across housing, work with residents to obtain the best prices for heat and power, maximise their income and encourage them to reduce their carbon footprint. |
|
Aberdeen City Council |
Hydrogen Strategy and Action Plan |
The overall aim of this strategy is to position Aberdeen as an example for hydrogen technology by utilising transferable expertise form the oil and gas industry and the capacity for renewable energy generation in the NE of Scotland. Overall, this strategy has 7 areas covering; vehicle deployments, renewable hydrogen, refuelling infrastructure, non-transport applications, supply chain/makrey development, community and education and policy and education. Actions to deliver this plan include having a fleet of hydrogen vehicles and expand this to deploying hydrogen buses, to gain support there will be incentives such as free parking. These actions come soff the back of a second refuelling station (Aberdeen City Hydrogen Energy Storage Project). |
|
Angus |
Sustainable Energy and Climate Action Plan |
The climate action plan outlines multiple actions to be delivered across 2-6 years, with 2 actions funded through the Mercury programme. These include clean growth business units and Timmergreens low carbon housing-led regeneration scheme. Any PPIs are yet to be confirmed by the Mercury Programme and partners include Crown Estate Scotland, Scotland Innovation Centre and Zero Waste Scotland among others. There is also an action to deliver a maintenance and repair programme for historic buildings to ensure climate resilience across 6-10 years. The PPI will be the number of historic buildings retrofitted in partnership with Historic Environment Scotland and funding is yet to be confirmed. |
|
Angus |
Transition to Net Zero Action Plan |
The purpose of this Transition to Net Action Plan (2022 to 2030) is to ensure Angus Council meet the 2030 Scottish Government interim emissions reduction target of a 75% reduction in emission, enroute to the Net Zero target by 2045. From the base year of 2012/13 to the end of the financial year 2020/21, Angus Council reduced its emissions by 52.5%. Going forward to 2030, Angus Council must reduce its emissions by 5% each year to meet the 75% reduction target. The key themes identified below, will be used drive emission reductions within key operational areas to meet the 2030 interim emissions reduction target: Leadership, Governance & Procurement Buildings, Energy & Infrastructure Waste, Recycling & Circular Economy Fleet & Business Travel Land Use Adaptation Within each of these key themes, Action Plans containing emission reduction projects and initiatives have been developed. The progress of the Action Plans and Angus Councils Transition to Net Zero will be reviewed and reported annually in November (starting from 2023), alongside the Public Bodies Climate Change Duties Report. |
|
Angus |
Local Development Plan |
Sets out detailed policies and proposals to guide development and investment over a 10 year period. Reviewed every five years and used as a basis for determining planning applications. |
|
Argyll and Bute Council |
Decarbonisation Plan |
This plan is aligned with the Scottish emission reduction targets and covers waste, energy and transport consumption, transport, climate adaptation and offsetting. This includes climate commitments across these streams , the main themes are: Argyll and Bute Council to achieve 75% carbon reduction by 2030 and net zero before 2045, support a low carbon economy, lead by example and develop practices and partnerships that inspire low carbon behaviour and to make ‘Climate Friendly Argyll & Bute’ a recognised brand and underpin behaviours of council staff and customers. Targets includes a new waste strategy to transition not the Landfill Ban by 2025, additional solar installation to council assets and £2.9million external funding to active travel. |
|
Dumfries & Galloway |
Carbon Neutral Strategic Plan |
This policy consists of a wide range of quantified actions all aimed at reducing carbon emissions. The actions span across categories of; Agriculture, council buildings and streets, council transport, domestic, LULUCF, non domestic buildings, transport and waste. All individual actions within these categories have measures against them of first year of full impact of measures savings, 2025 annua savings (tCO2e) and 2030 annual savings (tCO2e). |
|
Dumfries & Galloway |
Active Travel Strategy |
Integrate the work of this strategy with that of the Regional Transport Strategy to facilitate sustainable travel: |
|
Dumfries & Galloway |
New Waste Management Infrastructure |
Proposals for new or extended waste management facilities will be expected to have given full consideration to the following criteria: National and Local waste plans; Sustainable transport principles; Environmental impacts; Site suitability. |
|
Dundee |
Climate Action Plan |
Dundee City Council are leading on four general actions with partners of SSN and Dundee Partnership. With SSN they are looking to adopt an emissions modelling tool to quantify the impact of Climate Action Plan actions, to inform future targets and present data in an interactive way but they do not have funding in place. With Dundee Partnership this local authority are looking to develop and trial a carbon budget for the Council but do not have funding in place. Dundee City Council have funding for the following two actions where they are collaborating with Dundee Partnership; Establish effective governance for the Climate Action Plan in partnership with public, private and community organisations and implement a system for monitoring and reporting progress and Develop the Sustainable Dundee communications strategy to raise awareness, communicate and engage people in the Climate Action Plan to promote prolonged behaviour change. |
|
Dundee |
Waste and Recycling Strategy Action Plan |
This strategy provides an update on actions taken to implement national policy and meet legislative requirements in Dundee and sets out the strategic direction for the Council going forward. It provides a clear action plan to ensure that waste is managed more efficiently, ensuring that every recycling opportunity is taken over the next five years in order to work towards national recycling targets and once again becoming “Scotland’s Recycling City”. |
|
East Ayrshire Council |
Local Development Plan (LDP) 2 |
LDP2 covers the whole of the East Ayrshire Council area and sets out the Council’s planning policy framework for all matters, including the environment. |
|
East Ayrshire Council |
Clean Green East Ayrshire Climate Change Strategy |
Plans on becoming a net zero council by 2030 and wider communities by 2045. |
|
East Ayrshire Council |
Ayrshire Growth Deal |
Signed in November 2020, this marked the culmination of five years’ work by the three Ayrshire councils, partner organisations and Scottish and UK Governments. It aims to deliver a series of projects to foster economic growth whilst addressing sustainability and climate change. |
|
East Ayrshire Council |
Community Renewable Energy (CoRE) |
Working closely with both the private sector and our partners at the University of Strathclyde and centred around the Cumnock area, this initiative will place East Ayrshire at the very centre of innovation and development of new approaches and technologies that are needed locally to make the move to net zero while also supporting the wider climate change aspirations for Scotland and the UK. Comprising a programme of Demonstrator Projects, CoRE has funding of £17m from the UK Government, together with £7.5m allocated by East Ayrshire Council as part of the Ayrshire Growth Deal. The projects will combine academic and commercial expertise, local resources and new and emerging technologies to move the area into a low carbon future. CoRE will include a Centre of Excellence in Cumnock and various developments linked to energy research and generation at different locations around the local area, including former mining sites. |
|
East Dunbartonshire |
Local Development Plan 2 |
The local development plan shows how the council plan to embed sustainability in their planning process. It includes policy around renewable energy and low carbon technologies including decentralised energy centres and heat networks. It also highlights in LDP policy 15 the need to set stricter requirements for carbon reduction via energy efficiency and renewable use. |
|
East Dunbartonshire |
East Dunbartonshire Sustainability and Climate Change Framework (‘SCCF’) & Sustainability and Climate Change Framework Action Plan |
Sets a framework for strategic, cross-Council approach to sustainability, including corporate carbon reduction. The policy explores several areas but fails to move away from council owned assets and fails to explore territorial ones. |
|
East Dunbartonshire |
East Dunbartonshire Council Active Travel Strategy |
Supplements the Local Transport Strategy, seeking to improve opportunities for transport powered by human physical activity as an alternative to motorised transport. It gives a more detailed explanation on the benefits of improved active travel links for ED and shows how they will be implemented. |
|
East Dunbartonshire |
East Dunbartonshire Local Transport Strategy |
Sets out the Council’s transport policy, presents Transport Planning Objectives and co-ordinates future priorities to enhance transport and travel in East Dunbartonshire including enabling a shift to environmentally, socially and economically sustainable transport. It includes are of focus such as |
|
East Lothian |
East Lothian Climate Change Strategy |
East Lothians climate plan outlines how the council want to meet their Net Zero targets. It focuses on council owned emissions and does not mention council wide emissions in much detail. It includes outcomes on the following areas |
|
East Lothian |
East Lothian Transport Strategy |
East Lothian Councils Transport policy identifies Sustainable Transport, Active Travel, Air Quality and resilient transport networks and infrastructure as key focus areas. The polices work to ensure East Lothian is well-connected, healthy and active, where active travel and sustainable transport methods are embedded in local area plans. |
|
East Lothian |
East Lothian Local Development Plan |
East Lothians Local Development Plan and supplementary planning guidance set out a framework to support and encourage low carbon lifestyles and the transition needed to achieve decarbonisation. Planners actively seek provision where necessary of green networks, paths, active travel routes, open space and Sustainable Drainage Systems in new housing developments. The LDP helps to build a picture of how East Lothian see their built environment in the future but fails to mention any quantitative impacts that this may include. |
|
East Lothian |
Active Travel Improvement Plan |
Locally, the Active Travel Improvement Plan (ATIP) is one of four supporting plans to East |
|
East Renfrewshire |
Local Development Plan 2 |
The LDP2 sets out a long-term strategy and a policy framework to guide future development, sustainable and inclusive economic growth and regeneration. Delivering sustainable development across East Renfrewshire is supported through a number of strategic policies. |
|
Edinburgh |
Climate Strategy |
This strategy sets a target for Edinburgh to be net zero and climate resilient by 2030. This strategy is based on six key actions being; improving energy efficiency in homes and buildings, a citywide programme for heat and energy generation and distribution infrastructure, decarbonising public transport, renewing climate adaptation efforts, supporting behaviour change of citizens and growing the green economy. |
|
Edinburgh |
City Plan 2030 |
The City Plan 230 is very specific to Edinburgh’s future developments. This plan includes spatial strategy, policies, proposals within the city and maps to accompany these with an action plan detailing specifics. The plan covers the city until 2032 and aims to plan the city in a way that responds to climate change, social inequalities, and commits to eliminating poverty, ensure residents have enough money to live, have opportunities to work and plentiful learning opportunities. |
|
Edinburgh |
City Mobility Plan |
The main goals of this plan is to ensure that the people, goods and services of Edinburgh are able to travel around the city in a way that is safe, sustainable, efficient and beneficial to all. The main target that the actions in this plan are centred around is for by 2030 to lower the number of kilometres travelled by car in Edinburgh to reduce by 30% aligning with the net zero target for the city of 2030. |
|
Falkirk |
Climate Emergency Update |
The Climate Emergency Strategy will set out how the Council intends to reach their organisational and national net zero target. The strategy includes points on • fleet decarbonise • Decarbonise Council, operational, building stock (will be contained within the Local Heat and Energy Efficiency Strategy); • reduce emissions from waste; and • support territorial decarbonisation (this will require some level of community engagement. The plan also mentions community owned solar growth, hydrogen innovation and EV charging which would have impacts on territorial emissions, however, does not go into much detail around data and figures. |
|
Fife |
Zero Waste Fife – Resource Strategy and Action Plan 2018-2028 |
In 2011 the Zero Waste Plan was superseded by a new strategy that addressed the obligations and opportunities presented by the Waste (Scotland) Regulations 2012. It outlined further improvements to the kerbside recycling service, and treating unsorted waste to recover accessible recycle and energy. Additional efforts focused on the development of new business avenues for Fife’s two landfill sites to maintain income levels, and the potential development of an arms-length organisation to develop and operate waste treatment infrastructure on behalf of the Council. A further revision of the Zero Waste Strategy in 2015, took account of developments in household waste recycling and the development of waste management infrastructure (anaerobic digestion facility for the treatment of organic waste). It also took account of the Scottish Government recycling targets and the implementation of the biodegradable municipal waste landfill ban in 2021. |
|
Fife |
Climate Fife: Sustainable Energy and Climate Action Plan |
Climate Fife is Fife’s response to the climate emergency. The plan sets out the strategy which underpins Climate Fife, presenting: • a vision for where Fife Council wants to be, and the themes and programmes to show where actions are needed and how this will be supported. |
|
Fife |
Fife Local Transport Strategy |
Fife Local Transport Strategy does a good job at outlining Fife’s transport future and when paired with the climate Fife plan will focus on reducing the need to travel by settlement and development planning and smart technology; promoting active travel, increasing vehicle efficiencies, making public transport more popular and increasing the uptake of ULEV (ultra-low emission vehicles) such as hybrid-electric, full-electric and hydrogen fuel vehicles. |
|
Glasgow |
Glasgow Climate Plan |
The plan aims to address the climate and ecological emergency by: |
|
Glasgow |
City Development Plan |
Glasgow’s City Development plan outlines key areas of interest for planning consent and ensures that Glasgow meets its built environment goals around sustainability. This includes lots of planning consent around buildings and homes which make up most of the document. |
|
Glasgow |
Energy and Carbon Masterplan |
The Energy and Carbon Masterplan (ECM) sets out a vision of a transformed energy economy for Glasgow that is based on low carbon and increasingly de-centralised energy sources that are better able to meet Glasgow’s energy needs and help Glasgow tackle climate change. The ECM builds and extends the current collaborative working arrangements on energy and sustainability in the city through the work of the Sustainable Glasgow initiative and is a key strategy in helping deliver Glasgow’s aspirations to become one of Europe’s most sustainable cities. |
|
Glasgow |
Glasgow City Council Resource and Recycling Strategy |
Glasgow City Council Resource and Recycling Strategy |
|
Glasgow |
Glasgow Transport Strategy |
Glasgow Transport Strategy 2022 looks to deliver and expand on the following objectives: |
|
Highlands |
Carbon CLEVER |
Highland council-led initiative with a target of a carbon neutral Inverness in a low carbon Highlands by 2025 |
|
Inverclyde |
Inverclyde Net Zero Strategy |
The net zero strategy has two targets, a delivery of carbon footprint reductions of 73% between 2021-2030 |
|
Inverclyde |
Inverclyde Waste Strategy |
The Council has implemented a large waste minimisation and recycling programme in terms of both infrastructure and promotion. The programme included kerbside recycling for various types of waste, education on how to reduce and recycle waste and generating energy from waste and circular economy principals. |
|
Midlothian |
Midlothian Climate Change Strategy |
The strategy sets out a clear vision and set of objectives, to highlight what we can, and must do to combat climate change and highlights some of the challenges to achieving this. It focuses on a number of themes including Energy Efficiency; Recycling & Waste; Sustainable Development; Sustainable Travel; Business Processes; Carbon Management; Governance & Management; and Risk. |
|
Midlothian |
Midlothian Active Travel Strategy |
Promotes an Active Travel culture where walking and cycling become the normal choice for everyday journeys. The plan outlines future planning around walking and cycling routes, increasing safety for non-car users and school walking safety. |
|
Moray |
Climate Change Strategy |
This Climate Change Strategy identifies the key areas that the Council will prioritise within available resources to not only help reduce its own impact on the environment, but how it will seek to influence and encourage the wider community. The Strategy and Action plan detail a range of measures that will contribute directly to achieving key outcomes. Details of how the key actions will be delivered, along with timescales, targets and resource requirements, will be further developed and defined, and be subject to regular review. This Climate Change Strategy comprises the council’s response to the national and international priority of tackling climate change and shall be taken account of in all future planning and policy work undertaken by Moray Council. The policy lacks quantitative data. |
|
Moray |
Local Development Plan |
The Moray Local Development Plan (MLDP) 2020 sets how the Council sees the MLDP area developing over the next 10 years and beyond and covers the administrative area of Moray Council, minus the southern part which falls within the Cairngorm National Park which prepares its own LD. Alongside National Planning Framework 4 (NPF4), the MLDP forms the Development Plan for Moray. |
|
North Ayrshire |
Environmental Sustainability and Climate Change Strategy |
The North Ayrshire climate strategy outlines the key focus areas for them to meet net zero. It includes both territorial emissions and council owned in great detail. Some of the key areas include: •Progress and monitor the Net Zero Carbon Roadmap, with milestones to be reported quarterly to the Head of Service and to Cabinet every six months Council’s through the corporate performance monitoring framework |
|
North Ayrshire |
Electric Vehicles Strategy |
The aim of the Council’s Electric Vehicle strategy is to increase the number of EVs being used throughout North Ayrshire by creating a robust network of EV charge points. The strategic objectives of the EV Strategy are as follows: |
|
North Ayrshire |
Zero Waste Strategy |
The Council were 1 of only 9 Scottish local authorities who exceeded the Scottish Government’s Zero Waste Plan target to recycle over 50% of household waste by 2013, and are currently one of the top performing Councils for recycling in Scotland, highlighting the success of the previous strategy due to their previous strategy. This new strategy outlines the following key areas they want to achieve: Recycle 60% of household waste by 2020; • Cease disposal of Biodegradable Waste to landfill by 31st December 2020; • Recycle 70% of all waste by 2025; and • Reduce the waste disposed of to landfill to a maximum of 5% by 2025. The strategy remains focussed on the waste hierarchy, which identifies waste prevention as the most preferred option, followed by re-use, recycling, and treatment/energy recovery, and then disposal as the final option. |
|
North Ayrshire |
Local Development Plan 2 |
The LDP sets out the planning and built environmental context for the council region. The plans are based around buildings, spaces and infrastructure and does not outline how they will be achieved. |
|
North Lanarkshire |
Active Travel Policy |
The strategy includes targets to work towards a council with active travel provisions with different interventions necessary to achieve each strategy aspect. The strategy focuses on fostering collaboration across the council’s remit and suggests exploring feasibility of developing cross boundary links for active travel with other local authorities and partners. |
|
Orkney Islands |
Orkney Sustainable Energy Strategy |
Developed in partnership with Orkney Islands Council, Highlands and Islands Enterprise (HIE), Community Energy Scotland and the OREF (Orkney Renewable Energy Forum) working to reduce island’s dependency on fossil fuels. |
|
Orkney Islands |
Sustainable & Active Travel |
Contribute to the health and wellbeing of the people of Orkney. |
|
Perth & Kinross |
Climate Change Strategy and Action Plan |
The strategy covers: transport, buildings and energy, business and industry, waste and circular economy, land use, education and engagement, climate resilience. Within each theme there are quantified targets and 4-5 sub-themes with KPIs attached to measure progress against a baseline value. Each category includes a exemplar case study of how this policy aspect will be progressed. |
|
Renfrewshire |
Plan for Net Zero (Phase 2) |
The plan has five key actions: 1. detailed phase plan to 2030, 2. quantified delivery plans, 3. verifying, adopting, and updating emissions modelling tool, 4. developing a carbon budget for Renfrewshire council, 5. developing an adaptation plan for Renfrewshire. The policy categories cover: clean energy, sustainable transport, circular economy, connected communities and resilient place. |
|
Scottish Borders |
Climate Change Route Map |
The climate change route map emphasises collaboration, talking about climate risks/vulnerabilities and undertaking strategic environmental assessments. The categories covered are: resilience, transport use, nature based solutions, energy, waste management, adaptation, behaviour change. The policy document outlines progress to date up to 2021. |
|
Shetland Islands |
Shetland’s Climate Change Strategy |
Shetland Partnerships overarching framework of Shetland’s strategic plan to address climate change. Content currently under development by Shetland Partnership Climate Change Steering Group. |
|
South Ayrshire |
Sustainable Development & Climate Change Framework |
The sustainability strategy has three key themes: 1. Sustainable Council: reducing the corporate GHG emissions and improving the wider environment, 2. Sustainable environment: protecting and enhancing the environment while improving the health, well-being and livelihoods of local communities, and 3. Sustainable Community: supporting local communities to limit GHG emissions, adapt to climate change impacts and improve their local environment. |
|
South Lanarkshire |
Sustainable Development and Climate Change Strategy 2 |
The policy builds upon their 2017 to 2022 climate change strategy and covers health and wellbeing, climate justice, transport, energy, greenspaces, community, waste, protect environment, nature-based solutions, green economy, circular economy, and business transition. Each category has key actions listed out, with progress to-date outlined within document and 5 year improvement actions specified to reach each aim. |
|
Stirling |
Climate and Nature Emergency Plan |
The strategy covers: energy use and generation, transport, resource efficiency, nature and biodiversity, and climate adaptation. It lists ~5 key priorities for each objective, outlines progress to date, includes final targets and interim targets and measures of progression. The national ScotGov targets have been translated to be applicable to Stirling Council area and Stirling Council specifically, and they have used 2005 as their GHG emission base year from which to measure any progress. The policy also notes which other council policies are required to reach the objectives (e.g., the local development plan is integral to advance the objectives listed in the energy use and generation section of the policy document. |
|
West Dunbartonshire |
Climate Change Action Plan |
This plan implements our Climate Change Strategy through a series of high-level actions for the short, medium and long term, setting out the need for action and a high-level framework. |
|
West Dunbartonshire |
Climate Change Strategy |
An overarching Strategy setting the foundation for a plan of action for 2021-22 and beyond and is a response to Scotland’s Climate Emergency and 2045 net zero carbon reduction target. |
|
West Dunbartonshire |
The West Dunbartonshire Energy Centre |
Scotland’s largest water source heat pump installation to date to help Council transit towards net zero. £20 million project, of which the £6.1 million came from Low Carbon Infrastructure Transition Programme |
|
West Dunbartonshire |
Local Development Plan 2 (LDP2) |
Seeks to ensure that new development in West Dunbartonshire is aligned with the goal to achieve net zero through net zero carbon buildings, clean energy generation, green infrastructure, etc. |
|
West Dunbartonshire |
WDC Local Housing Strategy |
Details how the Council and stakeholders will address and support housing, including fuel poverty, etc. |
|
West Lothian |
Climate Change Strategy |
This Strategy aims to ensure that activities to tackle climate change to contribute to the achievement of the outcomes identified within the council’s Corporate Plan (2018-2023) and the West Lothian Local Outcomes Improvement Plan (LOIP) (2013-23). |
|
West Lothian |
Adaptation Action Plan |
The Action Plan identifies seven adaptation outcomes which the council will work towards through implementing over 70 actions over the next 6 years (2022 -28). |
|
West Lothian |
West Lothian Local Outcomes Improvement Plan (LOIP) |
The mechanism by which Community Planning Partnerships deliver improved outcomes for their communities. They are based on a clear understanding of local needs and reflect agreed local priorities, as well as the National Performance Framework developed by the Scottish Government. |
Quantifying impact
In the development of the emission boundaries, we applied two measures of assessing impact: Likelihood and Magnitude.
Likelihood
Likelihood is defined as the probability or chance that a given policy will achieve its intended impact or target. We have applied IPCC Guidance (IPCC, 2006) to determine likelihood as outlined in Table 8.
|
Likelihood |
Description |
Probability |
|
Very Likely |
Reason to believe the effect will happen (or did happen) because of the policy. |
90-100% |
|
Likely |
Reason to believe the effect will probably happen (or probably happened) because of the policy. |
66-90% |
|
Possible |
Reason to believe the effect may or may not happen (or may or may not have happened) because of the policy. About as likely as not. Cases where the likelihood is unknown or cannot be determined should be considered possible. |
33-66% |
|
Unlikely |
Reason to believe the effect probably will not happen (or probably did not happen) as a result of the policy. |
10-33% |
|
Very unlikely |
Reason to believe the effect will not happen (or did not happen) because of the policy. |
0-10% |
There are several considerations made when assessing the likelihood, a policy has in achieving its intended outcomes.
- Sphere of control: a measure of how much control a local authority has over whether action is taken against a policy. This ranges on a scale from absolute where a policy is enacted through legislation, through to voluntary where a policy results in stakeholders making a pledge.
- Capacity and capability: whether the local authority have the resources it needs to actively measure and enforce the provisions within a policy once it is active.
- Timescale: the impacts of policies may require consistent action taken over several years, or even decades. This can prove difficult as socioeconomic needs shift over time meaning that policies may also need to adapt over time, changing impacts and targets.
An example of a policy that is ‘very likely’ to meet its intended targets is a Low Emission Zone whereby a local authority has absolute ability to determine the classification of vehicles that enter its zone. Compare this to a policy improving active travel provision whereby the intended benefits are somewhat dependent on stakeholders enacting the policy out of their own free-will.
Magnitude
Magnitude is a simple measure of a policy’s potential impact on an inventory’s emissions. Following IPCC guidance (IPCC, 2006), we have set the following impact boundaries to rank the valued policies:
|
Magnitude |
Description |
Impact |
|---|---|---|
|
Major |
The effect significantly influences the effectiveness of the policy or action. The change in GHG emissions or removals is likely to be significant in size. |
>10% |
|
Moderate |
The effect influences the effectiveness of the policy or action. The change in GHG emissions or removals could be significant in size. |
1-10% |
|
Minor |
The effect is inconsequential to the effectiveness of the policy or action. The change in GHG emissions or removals is insignificant in size. |
<1% |
Policy descriptions
Table 10: Descriptions of 13 climate policies collated from six chosen local authorities for valuation, including example targets and KPIs set by the local authorities
|
Inventory / Policy |
Description |
Example targets and KPIs from local authorities |
|---|---|---|
|
Agriculture | ||
|
Changes to Agricultural Practices |
Changes in agricultural methods to reduce the use of nitrogen fertilisers, changes in animal feeds, reduced intensity of livestock production and improvements in waste management. |
This policy consists of a wide range of quantified actions all aimed at reducing carbon emissions. All individual actions within these categories have measures against them of first year of full impact of measures savings, 2025 annual savings (tCO2e) and 2030 annual savings (tCO2e). |
|
LULUCF | ||
|
Greening of derelict land |
Identify and utilise Vacant and Derelict Land for greening and rewilding in combination with renewable energy generation measures and reducing flood risk. |
% VDL used for renewable energy generation |
|
Peatland restoration |
Increase investment in peatland restoration in the region to enhance biodiversity and increase capacity for carbon sequestration. |
Percentage emissions reduction. 20,000 hectares restored per annum 250,000 hectares restored by 2030 |
|
Reforestation (1 million new trees per local authority) |
Protecting and enhancing existing ecosystems and biodiversity through reforestation. |
Plant 80,000 new trees by 2023; 360,000 by 2030 and 1,000,000 by 2045. |
|
Transport | ||
|
Active travel |
Encouraging walking and cycling for shorter journeys rather than the use of personal cars. |
Many journeys are relatively short and could easily be undertaken by walking or cycling. In 2017 |
|
Homeworking |
Promote homeworking and videoconferencing to reduce traffic congestion, as part of a range of effective working practices. |
Number of staff working remotely. |
|
Low Emission Zone |
Reduce emissions from transport in city centres and improving air quality by expanding low emissions zone. |
Percentage transport emissions |
|
Public transport |
Work with transport stakeholders in the city to support rapid transition to cleaner public transport as part of the City’s Low Emissions Zone. |
% change in PM 10 at each monitoring location, averaged over a three-year period. |
|
Fleet vehicles |
Deliver rapid transition of council’s fleet to electric, supporting the city’s existing fleet strategy’s target of becoming low carbon by 2030. |
Share of low emission vehicles in the overall modal split – % change |
|
Council Business Travel |
Replace modes of council business transport with low emission alternatives. |
45% reduction in transport emissions by 2030 against a 4,450tCO2 baseline. |
|
LEV Taxi Licences |
Make it compulsory for taxi licences granted depending on whether the mode of transport is a low emissions vehicle. |
100% of new taxi licences that are EV by 2032 |
|
Waste | ||
|
Waste Reduction Strategy |
Detailing how the region will help reduce, reuse and recycle, detailing corporate standards, targets and staff guidance for our waste activities, including improving infrastructure. |
By 2025 – 95% reduction of landfill waste (as part of a suite of other initiatives) |
|
Council Waste Reduction |
Reduce the amount of council-generated waste going to landfill. |
70% reduction of waste going to land fill by 2030 against a 892t 2019 baseline |
Valuing greenhouse gas emissions
Table 21: Total territorial greenhouse gas emissions (ktCO2e), by inventory (BEIS, 2022)
|
Local authority |
Territorial greenhouse gas emissions (ktCO2e) | ||||||
|---|---|---|---|---|---|---|---|
|
Agriculture |
Buildings |
Industry |
LULUCF |
Transport |
Waste |
Total | |
|
Aberdeen City |
32 |
585 |
236 |
31 |
305 |
30 |
1,218 |
|
Aberdeenshire |
1,083 |
579 |
244 |
357 |
613 |
117 |
2,993 |
|
Angus |
264 |
249 |
117 |
389 |
235 |
9 |
1,263 |
|
Argyll and Bute |
297 |
198 |
85 |
-532 |
186 |
23 |
257 |
|
City of Edinburgh |
37 |
1,203 |
213 |
70 |
640 |
73 |
2,236 |
|
Clackmannanshire |
24 |
103 |
290 |
24 |
66 |
5 |
512 |
|
Dumfries and Galloway |
1,555 |
350 |
185 |
-239 |
571 |
17 |
2,439 |
|
Dundee City |
5 |
353 |
63 |
23 |
184 |
14 |
642 |
|
East Ayrshire |
330 |
238 |
78 |
-31 |
229 |
11 |
855 |
|
East Dunbartonshire |
27 |
237 |
28 |
20 |
113 |
40 |
465 |
|
East Lothian |
112 |
217 |
552 |
194 |
210 |
29 |
1,313 |
|
East Renfrewshire |
43 |
196 |
9 |
23 |
147 |
3 |
421 |
|
Falkirk |
61 |
308 |
1,454 |
79 |
327 |
68 |
2,298 |
|
Fife |
308 |
741 |
1,143 |
345 |
584 |
138 |
3,260 |
|
Glasgow City |
13 |
1,293 |
380 |
68 |
761 |
196 |
2,710 |
|
Highland |
638 |
526 |
458 |
110 |
598 |
80 |
2,410 |
|
Inverclyde |
31 |
151 |
46 |
3 |
106 |
3 |
340 |
|
Midlothian |
70 |
189 |
48 |
52 |
137 |
18 |
513 |
|
Moray |
261 |
228 |
313 |
-167 |
162 |
37 |
834 |
|
Na h-Eileanan Siar |
81 |
66 |
22 |
951 |
42 |
22 |
1,184 |
|
North Ayrshire |
135 |
258 |
349 |
-32 |
151 |
30 |
891 |
|
North Lanarkshire |
79 |
636 |
313 |
90 |
736 |
78 |
1,932 |
|
Orkney Islands |
239 |
44 |
14 |
43 |
29 |
4 |
373 |
|
Perth and Kinross |
408 |
353 |
89 |
-140 |
515 |
81 |
1,307 |
|
Renfrewshire |
50 |
370 |
120 |
35 |
301 |
27 |
903 |
|
Scottish Borders |
767 |
251 |
103 |
-103 |
261 |
13 |
1,292 |
|
Shetland Islands |
107 |
42 |
34 |
572 |
43 |
4 |
801 |
|
South Ayrshire |
296 |
239 |
168 |
-55 |
209 |
10 |
867 |
|
South Lanarkshire |
341 |
652 |
208 |
-27 |
666 |
33 |
1,874 |
|
Stirling |
182 |
204 |
178 |
-150 |
249 |
45 |
709 |
|
West Dunbartonshire |
21 |
179 |
46 |
9 |
127 |
7 |
390 |
|
West Lothian |
89 |
362 |
211 |
48 |
373 |
67 |
1,150 |
|
Total |
7,985 |
11,600 |
7,798 |
2,059 |
9,878 |
1,333 |
40,653 |
Table 32: Estimated potential impact on greenhouse gas emissions (ktCO2e) from Agriculture and LULUCF policies
|
Local authority |
Agriculture |
LULUCF | ||||||
|---|---|---|---|---|---|---|---|---|
|
Total Agriculture emissions |
Changes to Agricultural Practices |
Total policy impact |
Total LULUCF emissions |
Greening of derelict land |
Peatland restoration |
Reforestation (1 million new trees per LA) |
Total policy impact | |
|
Aberdeen City |
32 |
-6 |
-6 |
31 |
-7 |
0 |
-25 |
-32 |
|
Aberdeenshire |
1,083 |
-193 |
-193 |
357 |
-15 |
-67 |
-25 |
-107 |
|
Angus |
264 |
-47 |
-47 |
389 |
-27 |
-1 |
-25 |
-52 |
|
Argyll and Bute |
297 |
-53 |
-53 |
-532 |
-11 |
-189 |
-25 |
-225 |
|
City of Edinburgh |
37 |
-7 |
-7 |
70 |
-12 |
-1 |
-25 |
-37 |
|
Clackmannanshire |
24 |
-5 |
-5 |
24 |
-60 |
-70 |
-25 |
-155 |
|
Dumfries and Galloway |
1,555 |
-275 |
-275 |
-239 |
-34 |
0 |
-25 |
-59 |
|
Dundee City |
5 |
-1 |
-1 |
23 |
-448 |
-12 |
-25 |
-485 |
|
East Ayrshire |
330 |
-58 |
-58 |
-31 |
-14 |
0 |
-25 |
-39 |
|
East Dunbartonshire |
27 |
-5 |
-5 |
20 |
-16 |
0 |
-25 |
-41 |
|
East Lothian |
112 |
-20 |
-20 |
194 |
-10 |
-2 |
-25 |
-36 |
|
East Renfrewshire |
43 |
-8 |
-8 |
23 |
-33 |
0 |
-25 |
-58 |
|
Falkirk |
61 |
-11 |
-11 |
79 |
-53 |
-37 |
-25 |
-115 |
|
Fife |
308 |
-50 |
-50 |
345 |
-122 |
-3 |
-25 |
-150 |
|
Glasgow City |
13 |
-2 |
-2 |
68 |
-199 |
-1 |
-25 |
-225 |
|
Highland |
638 |
-113 |
-113 |
110 |
-250 |
-1,214 |
-25 |
-1,489 |
|
Inverclyde |
31 |
-4 |
-4 |
3 |
-29 |
-1 |
-25 |
-55 |
|
Midlothian |
70 |
-12 |
-12 |
52 |
-22 |
-36 |
-25 |
-83 |
|
Moray |
261 |
-47 |
-47 |
-167 |
-3 |
-28 |
-25 |
-56 |
|
Na h-Eileanan Siar |
81 |
-15 |
-15 |
951 |
-2 |
-434 |
-25 |
-461 |
|
North Ayrshire |
135 |
-24 |
-24 |
-32 |
-249 |
-7 |
-25 |
-280 |
|
North Lanarkshire |
79 |
-14 |
-14 |
90 |
-239 |
-49 |
-25 |
-313 |
|
Orkney Islands |
239 |
-42 |
-42 |
43 |
-7 |
-149 |
-25 |
-181 |
|
Perth and Kinross |
408 |
-74 |
-74 |
-140 |
-8 |
-14 |
-25 |
-47 |
|
Renfrewshire |
50 |
-11 |
-11 |
35 |
-51 |
-1 |
-25 |
-76 |
|
Scottish Borders |
767 |
-133 |
-133 |
-103 |
-13 |
-13 |
-25 |
-51 |
|
Shetland Islands |
107 |
-18 |
-18 |
572 |
-1 |
-134 |
-25 |
-160 |
|
South Ayrshire |
296 |
-53 |
-53 |
-55 |
-20 |
-3 |
-25 |
-48 |
|
South Lanarkshire |
341 |
-61 |
-61 |
-27 |
-79 |
-48 |
-25 |
-152 |
|
Stirling |
182 |
-32 |
-32 |
-150 |
-28 |
-11 |
-25 |
-63 |
|
West Dunbartonshire |
21 |
-4 |
-4 |
9 |
-31 |
-1 |
-25 |
-56 |
|
West Lothian |
89 |
-16 |
-16 |
48 |
-77 |
-4 |
-25 |
-106 |
|
Total |
7,985 |
-1,416 |
-1,416 |
2,059 |
-2,167 |
-2,530 |
-800 |
-5,497 |
Table 13: Estimated impact on greenhouse gas emissions (ktCO2e) from Transport policies
|
Local authority |
Transport | ||||||||
|---|---|---|---|---|---|---|---|---|---|
|
Total Transport emissions |
Active travel |
Homeworking |
Low Emission Zone |
Public transport |
Fleet vehicles |
Council Business Travel |
LEV Taxi Licences |
Total | |
|
Aberdeen City |
305 |
-33 |
-0.01 |
-5 |
-7 |
-5 |
-10 |
-3 |
-99 |
|
Aberdeenshire |
613 |
-38 |
-0.01 |
-6 |
-8 |
-6 |
-11 |
-2 |
-112 |
|
Angus |
235 |
-17 |
-0.01 |
-3 |
-4 |
-3 |
-5 |
-1 |
-49 |
|
Argyll and Bute |
186 |
-12 |
0.00 |
-2 |
-3 |
-2 |
-4 |
-1 |
-37 |
|
City of Edinburgh |
640 |
-76 |
-0.03 |
-12 |
-16 |
-12 |
-22 |
0 |
-221 |
|
Clackmannanshire |
66 |
-7 |
0.00 |
-1 |
-2 |
-1 |
-2 |
-1 |
-22 |
|
Dumfries and Galloway |
571 |
-22 |
-0.01 |
-3 |
-5 |
-3 |
-6 |
-2 |
-65 |
|
Dundee City |
184 |
-21 |
-0.01 |
-3 |
-5 |
-3 |
-6 |
-1 |
-63 |
|
East Ayrshire |
229 |
-18 |
-0.01 |
-3 |
-4 |
-3 |
-5 |
-2 |
-53 |
|
East Dunbartonshire |
113 |
-16 |
-0.01 |
-3 |
-3 |
-2 |
-5 |
-1 |
-46 |
|
East Lothian |
210 |
-16 |
-0.01 |
-3 |
-3 |
-2 |
-5 |
-1 |
-47 |
|
East Renfrewshire |
147 |
-14 |
-0.01 |
-2 |
-3 |
-2 |
-4 |
-12 |
-52 |
|
Falkirk |
327 |
-23 |
-0.01 |
-4 |
-5 |
-4 |
-7 |
0 |
-68 |
|
Fife |
584 |
-54 |
-0.02 |
-9 |
-12 |
-9 |
-16 |
-2 |
-159 |
|
Glasgow City |
761 |
-92 |
-0.04 |
-15 |
-20 |
-14 |
-27 |
-2 |
-268 |
|
Highland |
598 |
-34 |
-0.01 |
-6 |
-7 |
-5 |
-10 |
-17 |
-116 |
|
Inverclyde |
106 |
-11 |
0.00 |
-2 |
-2 |
-2 |
-3 |
-2 |
-35 |
|
Midlothian |
137 |
-14 |
-0.01 |
-2 |
-3 |
-2 |
-4 |
-1 |
-40 |
|
Moray |
162 |
-14 |
-0.01 |
-2 |
-3 |
-2 |
-4 |
-1 |
-41 |
|
Na h-Eileanan Siar |
42 |
-4 |
0.00 |
-1 |
-1 |
-1 |
-1 |
-1 |
-12 |
|
North Ayrshire |
151 |
-19 |
-0.01 |
-3 |
-4 |
-3 |
-6 |
-1 |
-57 |
|
North Lanarkshire |
736 |
-49 |
-0.02 |
-8 |
-11 |
-8 |
-15 |
-6 |
-149 |
|
Orkney Islands |
29 |
-3 |
0.00 |
-1 |
-1 |
-1 |
-1 |
0 |
-10 |
|
Perth and Kinross |
515 |
-22 |
-0.01 |
-4 |
-5 |
-3 |
-7 |
-1 |
-65 |
|
Renfrewshire |
301 |
-26 |
-0.01 |
-4 |
-6 |
-4 |
-8 |
-4 |
-79 |
|
Scottish Borders |
261 |
-17 |
-0.01 |
-3 |
-4 |
-3 |
-5 |
-1 |
-49 |
|
Shetland Islands |
43 |
-3 |
0.00 |
-1 |
-1 |
-1 |
-1 |
0 |
-10 |
|
South Ayrshire |
209 |
-16 |
-0.01 |
-3 |
-4 |
-3 |
-5 |
-1 |
-48 |
|
South Lanarkshire |
666 |
-47 |
-0.02 |
-8 |
-10 |
-7 |
-14 |
-6 |
-141 |
|
Stirling |
249 |
-14 |
-0.01 |
-2 |
-3 |
-2 |
-4 |
-1 |
-40 |
|
West Dunbartonshire |
127 |
-13 |
0.00 |
-2 |
-3 |
-2 |
-4 |
-1 |
-38 |
|
West Lothian |
373 |
-27 |
-0.01 |
-4 |
-6 |
-4 |
-8 |
-2 |
-79 |
|
Total |
9,878 |
-793 |
-0.31 |
-129 |
-169 |
-124 |
-235 |
-76 |
-1,527 |
Table 44: Estimated potential impact on greenhouse gas emissions (ktCO2e) from Waste policies
|
Local authority |
Waste | |||
|---|---|---|---|---|
|
Total Waste emissions |
Waste Reduction Strategy |
Council Waste Reduction |
Total | |
|
Aberdeen City |
30 |
-16 |
-0.86 |
-17 |
|
Aberdeenshire |
117 |
-27 |
-0.98 |
-28 |
|
Angus |
9 |
-8 |
-0.44 |
-8 |
|
Argyll and Bute |
23 |
-11 |
-0.33 |
-12 |
|
City of Edinburgh |
73 |
-47 |
-1.96 |
-49 |
|
Clackmannanshire |
5 |
-4 |
-0.20 |
-4 |
|
Dumfries and Galloway |
17 |
-22 |
-0.57 |
-23 |
|
Dundee City |
14 |
-16 |
-0.56 |
-17 |
|
East Ayrshire |
11 |
-10 |
-0.46 |
-10 |
|
East Dunbartonshire |
40 |
-9 |
-0.41 |
-9 |
|
East Lothian |
29 |
-8 |
-0.41 |
-9 |
|
East Renfrewshire |
3 |
-5 |
-0.36 |
-5 |
|
Falkirk |
68 |
-12 |
-0.61 |
-13 |
|
Fife |
138 |
-38 |
-1.41 |
-39 |
|
Glasgow City |
196 |
-78 |
-2.38 |
-81 |
|
Highland |
80 |
-29 |
-0.90 |
-30 |
|
Inverclyde |
3 |
-5 |
-0.29 |
-5 |
|
Midlothian |
18 |
-8 |
-0.35 |
-8 |
|
Moray |
37 |
-7 |
-0.36 |
-7 |
|
Na h-Eileanan Siar |
22 |
-5 |
-0.10 |
-5 |
|
North Ayrshire |
30 |
-10 |
-0.51 |
-10 |
|
North Lanarkshire |
78 |
-35 |
-1.29 |
-37 |
|
Orkney Islands |
4 |
-4 |
-0.08 |
-4 |
|
Perth and Kinross |
81 |
-13 |
-0.58 |
-14 |
|
Renfrewshire |
27 |
-14 |
-0.68 |
-15 |
|
Scottish Borders |
13 |
-10 |
-0.44 |
-11 |
|
Shetland Islands |
4 |
-3 |
-0.09 |
-3 |
|
South Ayrshire |
10 |
-8 |
-0.43 |
-9 |
|
South Lanarkshire |
33 |
-30 |
-1.22 |
-32 |
|
Stirling |
45 |
-7 |
-0.35 |
-7 |
|
West Dunbartonshire |
7 |
-9 |
-0.33 |
-9 |
|
West Lothian |
67 |
-12 |
-0.69 |
-12 |
|
Total |
1,333 |
-520 |
-20.62 |
-541 |
Table 15: Estimated potential impact on total territorial greenhouse gas emissions (ktCO2e), by inventory
|
|
Territorial greenhouse gas emissions post policy (ktCO2e) | ||||||
|
Local authority | |||||||
|
Agriculture |
Buildings |
Industry |
LULUCF |
Transport |
Waste |
Total | |
|
Aberdeen City |
25 |
585 |
236 |
-1 |
241 |
13 |
1,100 |
|
Aberdeenshire |
889 |
579 |
244 |
250 |
541 |
89 |
2,593 |
|
Angus |
217 |
249 |
117 |
337 |
203 |
0 |
1,124 |
|
Argyll and Bute |
245 |
198 |
85 |
-757 |
162 |
11 |
-57 |
|
City of Edinburgh |
30 |
1,203 |
213 |
33 |
501 |
24 |
2,003 |
|
Clackmannanshire |
19 |
103 |
290 |
-131 |
51 |
0 |
334 |
|
Dumfries and Galloway |
1,280 |
350 |
185 |
-298 |
529 |
-5 |
2,041 |
|
Dundee City |
4 |
353 |
63 |
-462 |
144 |
-2 |
100 |
|
East Ayrshire |
272 |
238 |
78 |
-70 |
195 |
0 |
714 |
|
East Dunbartonshire |
22 |
237 |
28 |
-22 |
84 |
31 |
380 |
|
East Lothian |
92 |
217 |
552 |
157 |
179 |
20 |
1,218 |
|
East Renfrewshire |
35 |
196 |
9 |
-35 |
109 |
-2 |
312 |
|
Falkirk |
50 |
308 |
1,454 |
-36 |
284 |
56 |
2,115 |
|
Fife |
258 |
741 |
1,143 |
195 |
483 |
99 |
2,919 |
|
Glasgow City |
11 |
1,293 |
380 |
-157 |
591 |
115 |
2,232 |
|
Highland |
526 |
526 |
458 |
-1,379 |
518 |
50 |
699 |
|
Inverclyde |
27 |
151 |
46 |
-53 |
83 |
-2 |
253 |
|
Midlothian |
57 |
189 |
48 |
-31 |
112 |
10 |
385 |
|
Moray |
214 |
228 |
313 |
-223 |
136 |
29 |
699 |
|
Na h-Eileanan Siar |
66 |
66 |
22 |
490 |
35 |
17 |
696 |
|
North Ayrshire |
111 |
258 |
349 |
-312 |
114 |
20 |
540 |
|
North Lanarkshire |
65 |
636 |
313 |
-223 |
639 |
41 |
1,471 |
|
Orkney Islands |
197 |
44 |
14 |
-138 |
22 |
0 |
139 |
|
Perth and Kinross |
334 |
353 |
89 |
-187 |
474 |
68 |
1,130 |
|
Renfrewshire |
38 |
370 |
120 |
-41 |
249 |
12 |
749 |
|
Scottish Borders |
634 |
251 |
103 |
-154 |
230 |
2 |
1,065 |
|
Shetland Islands |
89 |
42 |
34 |
412 |
37 |
0 |
614 |
|
South Ayrshire |
242 |
239 |
168 |
-103 |
178 |
2 |
727 |
|
South Lanarkshire |
280 |
652 |
208 |
-178 |
575 |
2 |
1,538 |
|
Stirling |
150 |
204 |
178 |
-213 |
224 |
38 |
580 |
|
West Dunbartonshire |
17 |
179 |
46 |
-47 |
102 |
-2 |
296 |
|
West Lothian |
73 |
362 |
211 |
-58 |
323 |
55 |
965 |
|
Total |
6,570 |
11,600 |
7,798 |
-3,438 |
8,351 |
792 |
31,672 |
Table 56: Percentage change in territorial greenhouse gas emissions (ktCO2e) from implementing policies
|
|
Percentage change in territorial greenhouse gas emissions | ||||||
|
Local authority | |||||||
|
Agriculture |
Buildings |
Industry |
LULUCF |
Transport |
Waste |
Total | |
|
Aberdeen City |
-20.0% |
0.0% |
0.0% |
-101.9% |
-20.8% |
-56.1% |
-9.7% |
|
Aberdeenshire |
-17.9% |
0.0% |
0.0% |
-30.1% |
-11.7% |
-23.8% |
-13.4% |
|
Angus |
-17.8% |
0.0% |
0.0% |
-13.5% |
-13.4% |
-94.4% |
-11.0% |
|
Argyll and Bute |
-17.7% |
0.0% |
0.0% |
42.3% |
-12.8% |
-51.3% |
-122.0% |
|
City of Edinburgh |
-18.3% |
0.0% |
0.0% |
-53.5% |
-21.7% |
-66.9% |
-10.4% |
|
Clackmannanshire |
-19.6% |
0.0% |
0.0% |
-637.1% |
-22.1% |
-92.1% |
-34.9% |
|
Dumfries and Galloway |
-17.7% |
0.0% |
0.0% |
24.6% |
-7.3% |
-130.4% |
-16.3% |
|
Dundee City |
-22.3% |
0.0% |
0.0% |
-2113.7% |
-21.7% |
-117.2% |
-84.5% |
|
East Ayrshire |
-17.5% |
0.0% |
0.0% |
126.5% |
-15.0% |
-95.5% |
-16.6% |
|
East Dunbartonshire |
-18.3% |
0.0% |
0.0% |
-211.1% |
-26.1% |
-22.8% |
-18.3% |
|
East Lothian |
-18.3% |
0.0% |
0.0% |
-18.6% |
-14.5% |
-29.8% |
-7.3% |
|
East Renfrewshire |
-18.5% |
0.0% |
0.0% |
-255.7% |
-25.6% |
-175.4% |
-25.9% |
|
Falkirk |
-18.2% |
0.0% |
0.0% |
-146.3% |
-13.1% |
-18.9% |
-7.9% |
|
Fife |
-16.3% |
0.0% |
0.0% |
-43.5% |
-17.3% |
-28.4% |
-10.4% |
|
Glasgow City |
-16.7% |
0.0% |
0.0% |
-330.9% |
-22.4% |
-41.3% |
-17.7% |
|
Highland |
-17.7% |
0.0% |
0.0% |
-1354.6% |
-13.3% |
-37.4% |
-71.0% |
|
Inverclyde |
-11.7% |
0.0% |
0.0% |
-2100.5% |
-21.6% |
-158.5% |
-25.5% |
|
Midlothian |
-17.6% |
0.0% |
0.0% |
-160.3% |
-18.8% |
-44.6% |
-25.1% |
|
Moray |
-17.8% |
0.0% |
0.0% |
33.3% |
-16.0% |
-19.9% |
-16.3% |
|
Na h-Eileanan Siar |
-18.0% |
0.0% |
0.0% |
-48.5% |
-18.2% |
-21.2% |
-41.2% |
|
North Ayrshire |
-17.9% |
0.0% |
0.0% |
876.1% |
-24.3% |
-33.5% |
-39.4% |
|
North Lanarkshire |
-17.4% |
0.0% |
0.0% |
-346.8% |
-13.1% |
-47.1% |
-23.8% |
|
Orkney Islands |
-17.7% |
0.0% |
0.0% |
-423.4% |
-21.4% |
-93.4% |
-62.6% |
|
Perth and Kinross |
-18.1% |
0.0% |
0.0% |
33.6% |
-8.1% |
-16.9% |
-13.5% |
|
Renfrewshire |
-22.9% |
0.0% |
0.0% |
-216.1% |
-17.1% |
-55.8% |
-17.1% |
|
Scottish Borders |
-17.3% |
0.0% |
0.0% |
49.7% |
-12.1% |
-84.7% |
-17.5% |
|
Shetland Islands |
-16.8% |
0.0% |
0.0% |
-28.0% |
-15.0% |
-91.2% |
-23.4% |
|
South Ayrshire |
-18.0% |
0.0% |
0.0% |
87.0% |
-14.7% |
-84.2% |
-16.2% |
|
South Lanarkshire |
-18.0% |
0.0% |
0.0% |
570.8% |
-13.7% |
-94.9% |
-17.9% |
|
Stirling |
-17.8% |
0.0% |
0.0% |
42.3% |
-10.2% |
-16.6% |
-18.1% |
|
West Dunbartonshire |
-18.0% |
0.0% |
0.0% |
-613.8% |
-19.4% |
-121.7% |
-24.1% |
|
West Lothian |
-18.4% |
0.0% |
0.0% |
-222.0% |
-13.6% |
-18.5% |
-16.1% |
|
Total |
-17.7% |
0.0% |
0.0% |
-266.9% |
-15.5% |
-40.6% |
-22.1% |
© Published by Turner & Townsend, 2023 on behalf of ClimateXChange. All rights reserved.
While every effort is made to ensure the information in this report is accurate, no legal responsibility is accepted for any errors, omissions, or misleading statements. The views expressed represent those of the author(s), and do not necessarily represent those of the host institutions or funders.
Active transport typically means a human-powered form of transport such as walking or cycling. ↑
For example, a policy might be to increase the number of journeys under 5km completed by active travel. ↑
ArcGIS is a family of client, server, and online geographic information system (GIS) that enables users to create, analyse, visualise, and share spatial data such as maps. ↑