

Mapping the current and future workforce and skills requirements in Scotland’s onshore wind industry
DOI: http://dx.doi.org/10.7488/era/4426
Executive summary
Aims
The purpose of this study is to deliver on a commitment in the Scottish Onshore Wind Sector Deal (SOWSD) to “publish a paper identifying the range of skills needed by industry to deliver our 2030 target” [1] and to inform the enhancement of skills and training provision to meet future sector needs.
Approach
We interviewed 22 Scottish onshore wind stakeholders between February and March 2024, including 11 developers, one owner / operator, two construction companies, two consultancies, three operation and maintenance providers, two skills and training providers and one local authority planning department. Furthermore, we developed a workforce model based on:
- the BVG Associates assessment of the pipeline of onshore wind projects in Scotland underlying their 2023 report “Scotland onshore wind pipeline analysis 2023-2030” and
- our estimates of the workforce requirements for a typical onshore wind project based on wider ITPEnergised insights from working on more than 500 onshore wind projects and validated through stakeholder consultation as part of the study.
Modelling assumptions were validated with the stakeholders above in March 2024.
Findings
- To meet the 2030 ambition, the workforce serving the onshore wind sector will need to increase from around 6,900 FTE (full time equivalent) in 2024 to a peak of around 20,500 FTE in 2027. Over 90% of these roles will be in construction and installation of wind farms. Employment by activity is shown in Figure 1. These job opportunities will only be available if estimates regarding the forthcoming onshore wind project pipeline materialise.

Figure 1: Annual FTE per onshore wind project stage.
Source: Workforce model using data from BVG Associates 2023 and consultants’ expertise.
- Overall, stakeholders felt that those working in the sector have the right skills, but there are skilled workforce shortages. In the short term, there is a need for more people to join the sector and for individuals from other sectors to be reskilled/ upskilled. Without this, the sector faces challenges in delivering new projects on time, maintaining existing wind farms and maximising economic and environmental benefits.
- Not addressing skill shortages is likely to have a severe impact on the ambition to install 20 GW of onshore wind by 2030. By 2027, our model predicts that, on average, four times more FTEs will be required for construction and installation than in 2024. Within this, five times more civil contractors will be required. More than 46% of these individuals will be required to build wind farms in Highland and Dumfries and Galloway, regions where stakeholders have highlighted is already difficult to recruit individuals. For operations and maintenance (O&M) the figures are smaller and the timeframes longer: around 2.5 times as many roles will be required in 2030 than in 2024. The regions with the highest requirement, of around 37%, are again Highland and Dumfries and Galloway[2].
- There will be significant shortages in technical roles, particularly high voltage engineers and wind turbine technicians. Across Scotland, FTE for electricity grid connections will need to increase from 1,100 in 2024 to 4,500 in 2027, a 400% increase. The number of wind turbine technician FTE will need to increase from around 465 in 2024 to almost 1,200 in 2030, a 258% increase. These will affect project development and operations if they are not resolved.
- The scarcity of skilled planners and specialist environmental consultants is set to continue. An average of 100 FTE planners and 434 FTE environmental consultants is estimated to be required across Scotland each year to enable wind farm developments between 2024 and 2030.
- Stakeholders have identified a growth need for digital skills for data analysis and drone inspections to improve turbine performance monitoring.
- There will be a need for diverse skillsets within the sector, which encompass project management, stakeholder engagement and regulatory compliance.
Recommendations
- The Scottish Government, together with partners in other public agencies, industry and the education sector, has the opportunity to address expected skill shortages in relation to the 20 GW capacity ambition by 2030. Investing in skills development is not only essential for the success of individual onshore wind projects but also for Scotland’s broader renewable energy goals. Addressing these shortages will require a comprehensive approach, including workforce development initiatives, training programmes and industry-academy collaborations. In this regard, collaboration between stakeholders from the public, private and education sectors will be crucial to bridge skills divides and unlock the full potential of Scotland’s onshore wind resources.
- Undertake a purposeful awareness raising programme of career opportunities within the sector, the transferrable nature of the skills developed and that many job categories in this sector will be required for a long time.
- Implement targeted campaigns in rural areas where most new installations will take place, to demonstrate highly skilled jobs for local people, many of which pay well above the average UK salary.
Glossary / Abbreviations table
|
CAD |
Computer-aided Design |
|
CITB |
Construction Industry Training Board |
|
DNO |
Distribution Network Operator |
|
dwpa |
Danish Wind Power Academy |
|
eBoP |
Electrical Balance of Plant |
|
ECoW |
Ecological Clerk of Works |
|
ECU |
Energy Consents Unit (Scottish Government) |
|
EHV |
Extra High Voltage |
|
EU |
European Union |
|
FTE |
Full-time Equivalent Employee (an FTE can be one full-time member of staff or multiple part-time employees) |
|
GVA |
Gross Value Added |
|
GW |
Gigawatt |
|
GWEC |
Global Wind Energy Council |
|
GWO |
Global Wind Organisation |
|
HNC |
Higher National Certificate |
|
HND |
Higher National Diploma |
|
HV |
High Voltage |
|
IEA |
International Energy Agency |
|
ISP |
Independent Service Provider |
|
IT |
Information Technology |
|
LA |
Local Authority |
|
LCREE |
Low Carbon Renewable Energy (data published by ONS) |
|
MW |
Megawatt |
|
NVQ |
National Vocational Qualification |
|
O&M |
Operations and Maintenance |
|
OEM |
Original Equipment Manufacturer |
|
OHL |
Overhead Line |
|
ONS |
Office for National Statistics |
|
REPD |
Renewable Energy Planning Database |
|
SAP |
Senior Authorised Person |
|
SCADA |
Supervisory Control and Data Acquisition |
|
SCQF |
Scottish Credit and Qualifications Framework |
|
SOWSD |
Scottish Onshore Wind Sector Deal |
|
TSA |
Turbine Supply Agreement |
|
TWh |
Terawatt Hour |
Introduction
Background
Onshore wind is a mature technology, with the first commercial windfarms built in the 1980s in the US and in Denmark. Scotland’s first commercial onshore windfarm, Hagshaw Hill, started generating electricity in 1995. Rapid expansion in the last 30 years has seen onshore wind supplying electricity in countries all over the world. An overview of the recent developments in the global onshore wind industry is provided in Appendix A.
The Scottish Government has recognised the importance of onshore and offshore wind to supply the increased amounts of electricity that will be necessary to achieve net zero carbon emissions by 2045. In the Onshore Wind Policy Statement, the Scottish Government stated its ambition to increase the installed onshore wind capacity of 9 GW in 2021 to a minimum of 20 GW by 2030 (Scottish Government, 2022). Furthermore, the Government intends that this should benefit communities across Scotland and allow a just transition of the workforce to skilled jobs within the onshore wind sector. The statement was followed in 2023 by the Scottish Onshore Wind Sector Deal (SOWSD), which committed to support the delivery of the necessary skills and training across Scotland to contribute to a just transition and realise the 20 GW ambition (Scottish Government, 2023).
Purpose of this study
The purpose of this study is to deliver on a commitment in the SOWSD and in turn, to:
- understand the jobs and skills requirements to support the deployment of onshore wind
- provide the analysis from which the enhancement of current skills and training provisions to meet future sector needs can be developed.
The aim is to map the annual numbers of jobs and skills needed to achieve 20 GW of installed onshore wind capacity by 2030. The specific objectives are to:
- estimate the number and types of jobs required annually in each stage of an onshore wind project
- estimate the geographic spread of these jobs across Scotland
- analyse the current level of skills available for onshore wind and the demand for these skills
- understand whether there are any skills gaps or shortages within the onshore wind industry in Scotland
- understand future demands for skills to enable the 2030 target to be achieved
- identify any skills gaps and make recommendations as to how these might be addressed.
Study methodology
We interviewed 22 Scottish onshore wind stakeholders between February and March 2024. These included 11 developers, one owner / operator, two construction companies, two consultancies, three operation and maintenance providers, two skills and training providers and one local authority planning department. Furthermore, we developed a workforce model that was based on analysis undertaken by BVG Associates of the pipeline of onshore wind projects in Scotland (BVG Associates, 2023), combined with the ITPEnergised assessment of the job requirements for a typical onshore wind project. This provided an assessment of job requirements for each project stage of a wind farm. Workforce numbers, job roles and modelling assumptions were validated in writing with the consulted stakeholders in March 2024.
In the remainder of the document, Section 4 provides an overview of the onshore wind sector in Scotland and a description of the job roles associated with each stage of the project lifecycle. Section 5 presents a summary of the modelling methodology and estimates of current and future job numbers. Section 6 describes the skills associated with the job types identified in Sections 4 and 5 and outlines the findings from our stakeholder engagement regarding skills shortages. Section 7 outlines options for addressing skills shortages from the stakeholder engagement and an international overview. Section 8 provides conclusions and recommendations.
Project pipeline, lifecycle and associated job roles
We reviewed the UK Government’s Renewable Energy Planning database (Department for Energy Security and Net Zero, 2023) to identify the project lifecycle phase of all onshore wind farms in Scotland. At the end of 2023, there was approximately 9.8 GW of installed onshore wind capacity in Scotland. This was distributed across 329 operational sites. The largest of these is at Clyde Wind Farm (operated by SSE Renewables in South Lanarkshire) with an installed capacity of 350 MW, and the smallest is Lower Rumster in Highland with an installed capacity of 0.2 MW. Highland has the largest amount of installed wind capacity (2.12 GW) followed by South Lanarkshire (1.352 GW) and Dumfries & Galloway (1.122 GW). All other local authorities have less than 1 GW installed capacity.
As of September 2023, there were 240 sites either under construction, awaiting construction or with planning applications submitted. These totalled 13.7 GW, with one greater than 500 MW (Scoop Hill Wind Farm in Dumfries & Galloway) and two greater than 400 MW (Viking Wind Farm in Shetland and Teviot Wind Farm in Borders). Another 28 of these windfarms are greater than 100 MW in installed capacity.
Onshore wind project lifecycle, job roles and skills levels
A typical onshore wind project is led by a project developer, who will normally operate the wind farm when it is operational. The developer is supported by a number of contractors and sub-contractors. An onshore wind farm project has five phases with the following durations: feasibility (1 year), development (3-4 years), construction (1-2 years), operation and maintenance (25+ years) and end-of-life. See Figure 1 and detailed descriptions of each project phase below. The project lifecycle structure is based on the ITPEnergised experience of consulting and managing over 500 projects for onshore wind developers. It also aligns with the onshore wind project lifecycle used in recent analysis undertaken in relation to Scottish Government policy (see Section 5). An overview of each project phase and typical workforce composition, in terms of full-time equivalent (FTE[3]) positions and job roles, is provided in Table 1. For the purposes of this study, Optimat and ITPEnergised have developed a model based on a ‘typical’ wind farm which has 90 MW capacity and comprises fifteen 6 MW turbines[4].
Figure 1: Onshore wind project phases.
Feasibility is the initial phase where developers engage with landowners and review potential onshore wind farm locations. This is followed by high-level analysis to understand whether the site has potential and whether there are any obvious issues that might prevent a wind farm being developed. Issues can include connections to the electricity grid, access to the site and whether there are any existing wind farms neighbouring the site. Feasibility can last up to a year and requires around four FTEs (see Table 1).
|
Job role |
FTE |
|
Project manager |
0.5 |
|
Consultant – site design and modelling |
0.2 |
|
Consultant – energy yield assessors and WindPro design specialists |
0.3 |
|
Consultant – grid connection consultancy and application |
0.3 |
|
Planning officers |
0.3 |
|
Environmental consultant |
0.3 |
|
Financial analyst |
2 |
|
Total |
4 |
During the Development phase more detailed assessments are carried out by the developer with support from specialised environmental and technology consultancy firms. These include assessment of potential impacts on ecology, ornithology, geology, hydrology, peatland, noise & vibration, cultural heritage, archaeology, forestry, landscape & visual impact, aviation, and radar and telecommunications. It will also include an assessment of energy yields and some initial engineering design to understand costs. These are essential to the developer’s business case and planning application. During this phase the developer will engage with planning officers within local authorities and the Scottish Government’s Energy Consents Unit (ECU), and with statutory bodies (such as NatureScot) to secure planning permission. The planning process currently takes between two and four years, depending on whether there are any objections to the application that require a public inquiry. At the same time the developer will engage with the appropriate Distribution Network Operator (DNO) to secure a date for connection of the wind farm to the national electricity grid. Finally, the developer will engage with the local community to address any concerns they may have at the earliest possible stage. Overall, this can be the longest phase pre-operations, typically three to four years and requiring around ten FTEs (see Table 2).
|
Job role |
FTE |
|
Project manager |
2 |
|
Planning officers |
0.8 |
|
Environmental consultant |
4.5 |
|
DNO case worker |
0.3 |
|
Consultant – grid connection consultancy and application |
0.3 |
|
Technical consultant |
2 |
|
Total |
10 |
When it comes to Construction and installation, developers will typically appoint one or more principal contractors, including the original equipment manufacturer (OEM) of the wind turbines. This initial procurement phase takes at least six months, and sometimes longer for wind turbines. The timing is also critical as most construction takes place over the summer months. Each of the primary contractors will subcontract others to fulfil local or specialised roles, including building access roads, foundations for turbines, substations and other onsite buildings, and delivering balance of plant (all of the cabling, components and equipment required to deliver electricity to the grid). These contractors, in turn, may also have subcontractors. There is, therefore, a complex supply chain hierarchy. The final part of this phase is physical connection of the wind farm to the grid, which is undertaken by specialist high voltage engineers working for the DNO. Overall, the construction and installation phase lasts at least one to two years, and requires around 148 FTEs across 16 different roles (see Table 3).
|
Job role |
FTE |
|---|---|
|
Project manager |
1 |
|
Planning officers |
0.2 |
|
Environmental consultant |
1 |
|
Civils contractor |
50 |
|
Civil engineer |
2 |
|
Crane/lifting contractor |
15 |
|
Grid connection installation |
35 |
|
DNO EHV commissioning engineer |
4 |
|
Transport operative |
15 |
|
Logistics manager |
1 |
|
Back-office support |
5 |
|
Health & safety officer |
3 |
|
Environmental consultant – ECoW |
0.3 |
|
TSA/OEM project delivery team |
3 |
|
Electrical engineer |
2 |
|
eBoP contractor |
10 |
|
Total |
148 |
Once a wind farm is operational, the OEM that supplied the wind turbines will generally provide Operation & Maintenance services for up to 10 years. The operator will subsequently take out a maintenance contract with an independent service provider (ISP), who will generally service all of that operator’s sites. Most ISPs operate across the whole of the UK, but usually specialise in O&M for a few manufacturers, as technicians must be certified to work on specific wind turbine models. Operators of larger wind farms may, in addition, directly employ a few wind turbine technicians in addition to ISPs performing the bulk of O&M activities. Our ‘typical’ wind farm will require around five FTEs across 10 different roles (see Table 4).
|
Job role |
FTE |
|
Technical consultant |
0.1 |
|
Back-office support |
0.1 |
|
Health & safety officer |
0.1 |
|
Wind turbine technician |
4.2 |
|
HV technician |
0.1 |
|
IT manager |
0.1 |
|
Asset manager |
0.2 |
|
Crane/lifting contractor |
0.01 |
|
Logistics manager |
0.3 |
|
Electrician |
0.01 |
|
Total |
5 |
At the End of life stage (typically 25 years), the operator can choose to decommission the wind farm, extend its operational life, or repower with larger turbines. Life extension is often sought as this is the most economical option. In this case the existing turbines are retained in place. Repowering can generate additional revenue from larger turbines, capitalising on the fact that these older sites tend to be in the most optimal locations for onshore wind. In the case of repowering, however, the operator/owner must essentially begin the project lifecycle again. For the purposes of our ‘typical’ wind farm we are assuming a similar level of FTE requirements to construction and installation. This is because the majority of end-of-life activities will not take place until later in this decade, at which point new turbines will be typically at least two to three times as powerful as the existing turbines. In addition, existing turbines might not be supported by the OEMs due to their age, making O&M more difficult (see Table 5).
|
Job role |
FTE |
|---|---|
|
Project manager |
1 |
|
Planning Officers |
0.2 |
|
Environmental consultant |
1 |
|
Civils contractor |
50 |
|
Civil engineer |
2 |
|
Crane/lifting contractor |
15 |
|
Grid connection installation |
35 |
|
DNO EHV commissioning engineer |
4 |
|
Transport operative |
15 |
|
Logistics manager |
1 |
|
Back-office support |
5 |
|
Health & safety officer |
3 |
|
Environmental consultant – ECoW |
0.3 |
|
TSA/OEM project delivery team |
3 |
|
Electrical engineer |
2 |
|
eBoP contractor |
10 |
|
Total |
148 |
Although specialised consultancies have been described for the development phase, these can also be engaged during any of the other phases. Overall, this highlights the broad range of roles that are required for a wind farm project. For the technical roles in particular, individuals require a significant number of years’ experience (see Appendix C). Tables 1 to 5 also illustrate that usually a wind farm project will employ most people during construction and installation and end-of-life phases. The next section provides a more detailed analysis of this.
In addition to the original turbines installed on the project site, wind farms require components to be manufactured and supplied throughout the project’s lifecycle. There are no manufacturers of large (multi-MW) wind turbines in the UK, and many of the components within these turbines are also not manufactured in the UK. This means that turbines and their parts must be imported. There is, however, end-of-life and remanufacturing capability within Scotland. Renewable Parts (based in Renfrew and Lochgilphead) refurbishes turbine components such as gearboxes for resupply to companies that provide operations and maintenance services. ReBlade, based in Glasgow and Dumfries, specialises in the decommissioning and recycling of blades and nacelles.
Current and future job numbers and their geographic distribution
Estimating current and future job numbers and types
The rapidly expanding activity in the onshore wind industry, in alignment with the nation’s net zero targets, represents a significant economic opportunity for Scotland. To enable this scale of activity, the sector will require a skilled and experienced workforce. It is, therefore, important to understand the overall number of FTE jobs that will be active in the sector on an annual basis, as well as the overall scale of economic activity in job creation in 2024-2030. This is an important distinction to ensure a clear understanding that some of the jobs will be temporary in nature (e.g., construction-related), whilst others will be permanent for the lifecycle of the project (e.g., operations).
The traditional economic modelling approach for estimating FTE numbers is based on the Gross Value Added (GVA) of the sector, calculated as a function of its turnover using historical ratios of these figures. A major limitation of this approach is the overall lack of detail as this method provides a broad overview rather than detailed insights into specific job roles within an industry. It does not easily break down workforce needs into different categories of employment, such as managerial, technical, or operational roles. Further, this approach relies on historical data and static assumptions about the relationship between economic output and employment. Most importantly, in sectors undergoing rapid transformation, such as renewable energy, the past may not be a reliable predictor of the future. Innovations, cost reductions, and changes in regulatory or market environments can significantly impact both GVA and employment levels in ways that historical data cannot predict.
To address these challenges, we developed an approach that makes use of a simulated model of a ‘typical’ onshore wind farm, ITPEnergised in-house expertise of equivalent projects, and refined and tested this through in-depth stakeholder consultation. This was combined with additional data sources as discussed with the study Steering Group. The model structure is presented in Figure 2. This is, to our knowledge, the first systematic attempt to conceptualise workforce composition in an onshore wind farm project.
The development of a ‘typical’ onshore windfarm model and approach for estimating FTE requirements per project phase and per job role associated with each phase are described in Appendix D.
The FTE predictions were triangulated against data in the Low Carbon and Renewable Energy Economy (LCREE) estimates (Office for National Statistics, 2021) that have been analysed and interpreted, in detail, by Ramboll UK in 2023 (Ramboll, 2023). Using the corresponding onshore wind project data from the Renewable Energy Planning Database (Department for Energy Security and Net Zero, 2021), we calculated the estimate of FTE per GW in construction and operations. Details on the validation process and data sources can be found in Appendix D.
Finally, we combined our model of a ‘typical’ onshore wind farm, with data from BVG Associates regarding the pipeline of the onshore wind projects in the timeframe 2024-2030, to project workforce requirements on an annual and regional basis. The BVG Associates database expands on the data contained in the REPD by forecasting wind farm project movement through different project stages up until 2030. It also includes information on planned wind farms that are not yet in the public domain.
An overview of our approach is provided in Figure 2.

Figure 2: Overview of workforce model developed within this study.
Figure 3 provides an overview of projected FTE by project stage on an annual basis to 2030. This highlights the large number of jobs in construction with a peak in 2027. O&M activities are expected to increase steadily throughout this decade and require almost 1,500 FTE by 2030. Significant end-of-life activities are not expected to begin until 2029.

Figure 3: Annual FTE per onshore wind project stage.
Using the capacity predictions on an annual basis, we calculated the number of FTE per job role per year in 2024-2030 (see Table 6). In total, the forecasted scale of activity will require an average of 14,256 FTE each year until 2030, with a particularly high demand for civils contractors and individuals that will deliver the grid connection and installation. It is, however, important to note that the majority of jobs in the onshore wind construction sector might not be sustained in the long term as currently the onshore wind project pipeline predictions show a decrease in activity from 2028 onwards. However, these construction jobs are highly transferrable to other infrastructure projects, including in offshore wind. In contrast, jobs created in operations and maintenance are likely to be sustained over the lifespan of an onshore wind project.
|
Job roles |
2024 |
2025 |
2026 |
2027 |
2028 |
2029 |
2030 |
|---|---|---|---|---|---|---|---|
|
Civils contractor |
1578 |
3429 |
4785 |
6416 |
5089 |
5457 |
3064 |
|
Grid connection installation |
1105 |
2400 |
3350 |
4491 |
3562 |
3820 |
2145 |
|
Crane/lifting contractor |
474 |
1030 |
1437 |
1926 |
1528 |
1639 |
922 |
|
Transport operative |
473 |
1029 |
1436 |
1925 |
1526 |
1637 |
919 |
|
eBoP contractor |
315 |
686 |
957 |
1283 |
1017 |
1091 |
613 |
|
Wind turbine technician |
465 |
531 |
596 |
776 |
931 |
1097 |
1198 |
|
Back-office support |
169 |
356 |
493 |
660 |
531 |
572 |
335 |
|
Environmental consultant |
792 |
696 |
554 |
462 |
217 |
208 |
110 |
|
DNO EHV commissioning engineer |
126 |
274 |
383 |
513 |
407 |
436 |
245 |
|
Health & safety officer |
106 |
218 |
301 |
403 |
327 |
353 |
212 |
|
TSA/OEM project delivery team |
95 |
206 |
287 |
385 |
305 |
327 |
184 |
|
Project manager |
263 |
255 |
256 |
228 |
167 |
124 |
73 |
|
Civil engineer |
63 |
137 |
192 |
257 |
204 |
218 |
123 |
|
Electrical engineer |
63 |
137 |
192 |
257 |
204 |
218 |
123 |
|
Logistics manager |
64 |
106 |
138 |
183 |
167 |
186 |
146 |
|
Financial Analyst |
307 |
222 |
143 |
52 |
21 |
7 |
12 |
|
Planning Officers |
176 |
152 |
141 |
104 |
72 |
34 |
21 |
|
Consultant – Grid connection |
92 |
73 |
59 |
34 |
21 |
5 |
5 |
|
Asset Manager |
22 |
25 |
28 |
37 |
44 |
52 |
56 |
|
DNO case worker |
46 |
39 |
37 |
26 |
18 |
4 |
3 |
|
HV Technician |
11 |
13 |
14 |
18 |
22 |
26 |
28 |
|
IT manager |
11 |
13 |
14 |
18 |
22 |
26 |
28 |
|
Consultant – Energy Yield & WindPro |
46 |
33 |
22 |
8 |
3 |
1 |
2 |
|
Consultant – Site Design & Modelling |
31 |
22 |
14 |
5 |
2 |
1 |
1 |
|
Electrician |
1 |
1 |
1 |
2 |
2 |
2 |
3 |
|
FTE |
6894 |
12082 |
15828 |
20469 |
16409 |
17541 |
10570 |
The colour code is indicative of the relative magnitude of FTEs required; green indicates low and red indicates high, a darker colour indicates a higher number.
Further detail of FTE requirements for different project stages is provided in Appendix D.
Predicting the geographical distribution of onshore wind skills demands
We used the BVG Associates data, as requested by the Steering Group, to analyse workforce requirements for different project stages on an annual basis and at a local authority (LA) level. The data for construction and installation, and O&M are presented in Table 7 and Table 8, respectively, as these project stages have the largest workforce requirements (in the period to 2030), the vast majority of which will be needed onsite. This highlights that Dumfries & Galloway, and Highland local authorities will have the highest workforce demands. Each of these LAs is projected to need more than 20% of the total construction and installation workforce requirements in 2026 and 2027, and Highland will also require 21% of the total workforce in 2028. In terms of O&M, Highland will require more than 20% of the projected workforce in each of 2027, 2028, 2029 and 2030.
It is also clear from this analysis that several Local Authorities will have little or no onshore wind activity throughout this period, as shown in Table 7 and Table 8 below.
|
2024 |
2025 |
2026 |
2027 |
2028 |
2029 |
2030 | |
|---|---|---|---|---|---|---|---|
|
Aberdeenshire Council |
81 |
149 |
283 |
696 |
806 |
424 |
191 |
|
Argyll and Bute Council |
0 |
345 |
1024 |
1748 |
2317 |
1421 |
571 |
|
Dumfries & Galloway Council |
416 |
2028 |
3723 |
4335 |
2013 |
1573 |
725 |
|
East Ayrshire Council |
0 |
323 |
704 |
2018 |
1669 |
1398 |
35 |
|
East Lothian Council |
0 |
0 |
230 |
230 |
230 |
0 |
0 |
|
Highland Council |
514 |
1788 |
2819 |
4173 |
3071 |
2615 |
1834 |
|
Midlothian Council |
0 |
0 |
0 |
208 |
208 |
208 |
0 |
|
Moray Council |
162 |
1232 |
1321 |
948 |
344 |
56 |
0 |
|
North Ayrshire Council |
2 |
2 |
0 |
0 |
0 |
0 |
0 |
|
North Lanarkshire Council |
0 |
68 |
68 |
0 |
0 |
475 |
475 |
|
Orkney Islands Council |
51 |
51 |
46 |
46 |
0 |
0 |
0 |
|
Perth & Kinross Council |
0 |
129 |
129 |
129 |
397 |
863 |
466 |
|
Scottish Borders Council |
955 |
1436 |
1095 |
909 |
1022 |
981 |
1012 |
|
Shetland Islands Council |
855 |
93 |
475 |
475 |
382 |
0 |
0 |
|
South Ayrshire Council |
383 |
561 |
699 |
694 |
516 |
153 |
0 |
|
South Lanarkshire Council |
1024 |
1248 |
258 |
883 |
663 |
538 |
38 |
|
Stirling Council |
0 |
195 |
195 |
0 |
0 |
0 |
0 |
|
Unknown* |
0 |
0 |
733 |
733 |
116 |
2644 |
2423 |
|
West Dunbartonshire Council |
0 |
0 |
0 |
0 |
257 |
257 |
257 |
|
West Lothian Council |
107 |
167 |
38 |
0 |
0 |
0 |
0 |
|
Western Isles Council / Comhairle nan Eilan Siar |
12 |
0 |
0 |
168 |
554 |
386 |
386 |
|
Total |
4562 |
9813 |
13840 |
18393 |
14564 |
13990 |
8412 |
*unknown refers to projects that have been confirmed by BVGA with developers that are not yet in the public domain. N.B., no new wind farms are forecast to be built in the following local authorities in the period to 2030: Aberdeen City, Angus, Clackmannanshire, Dundee City, East Dunbartonshire, East Renfrewshire, Edinburgh City, Falkirk, Fife, Glasgow City, Inverclyde, and Renfrewshire. The colour code is indicative of the relative magnitude of FTEs required; green indicates low and red indicates high, a darker colour indicates a higher number.
|
Local authority |
2023 |
2024 |
2025 |
2026 |
2027 |
2028 |
2029 |
2030 |
|---|---|---|---|---|---|---|---|---|
|
Aberdeenshire Council |
51 |
55 |
55 |
63 |
63 |
87 |
99 |
107 |
|
Angus Council |
2 |
2 |
2 |
2 |
2 |
2 |
2 |
2 |
|
Argyll and Bute Council |
42 |
39 |
39 |
50 |
58 |
115 |
177 |
188 |
|
Clackmannanshire Council |
5 |
5 |
5 |
5 |
5 |
5 |
5 |
5 |
|
Dumfries & Galloway Council |
112 |
112 |
124 |
146 |
280 |
332 |
382 |
395 |
|
East Ayrshire Council |
90 |
90 |
90 |
96 |
127 |
141 |
210 |
158 |
|
East Lothian Council |
15 |
15 |
15 |
15 |
15 |
27 |
27 |
27 |
|
East Renfrewshire Council |
4 |
4 |
4 |
4 |
4 |
4 |
4 |
4 |
|
Falkirk Council |
4 |
4 |
4 |
4 |
4 |
4 |
4 |
4 |
|
Fife Council |
9 |
9 |
9 |
9 |
9 |
9 |
9 |
9 |
|
Highland Council |
212 |
214 |
224 |
252 |
335 |
422 |
486 |
547 |
|
Inverclyde Council |
3 |
3 |
3 |
3 |
3 |
3 |
3 |
3 |
|
Midlothian Council |
0 |
0 |
0 |
0 |
0 |
0 |
11 |
11 |
|
Moray Council |
50 |
50 |
50 |
73 |
114 |
129 |
132 |
132 |
|
North Ayrshire Council |
13 |
13 |
13 |
13 |
13 |
13 |
13 |
11 |
|
North Lanarkshire Council |
29 |
29 |
29 |
32 |
32 |
32 |
32 |
47 |
|
Orkney Islands Council |
5 |
5 |
7 |
7 |
9 |
9 |
9 |
8 |
|
Perth & Kinross Council |
30 |
30 |
30 |
30 |
37 |
37 |
58 |
82 |
|
Scottish Borders Council |
74 |
77 |
123 |
140 |
154 |
174 |
202 |
218 |
|
Shetland Islands Council |
1 |
1 |
1 |
1 |
6 |
25 |
25 |
25 |
|
South Ayrshire Council |
55 |
55 |
67 |
75 |
84 |
103 |
111 |
111 |
|
South Lanarkshire Council |
135 |
139 |
193 |
193 |
206 |
213 |
239 |
241 |
|
Stirling Council |
16 |
16 |
16 |
26 |
26 |
26 |
26 |
26 |
|
Unknown* |
0 |
3 |
3 |
3 |
41 |
41 |
41 |
129 |
|
West Dunbartonshire Council |
0 |
0 |
0 |
0 |
0 |
0 |
0 |
13 |
|
West Lothian Council |
18 |
20 |
26 |
28 |
28 |
28 |
28 |
28 |
|
Western Isles Council / Comhairle nan Eilan Siar |
4 |
5 |
5 |
5 |
5 |
14 |
14 |
34 |
|
Total |
980 |
996 |
1138 |
1276 |
1661 |
1994 |
2349 |
2566 |
*unknown refers to projects that have been confirmed by BVGA with developers that are not yet in the public domain. N.B., no operational wind farms are forecast in the following local authorities in the period to 2030: Aberdeen City, Dundee City, East Dunbartonshire, Edinburgh City, Glasgow City, and Renfrewshire. The colour code is indicative of the relative magnitude of FTEs required; green indicates low and red indicates high, a darker colour indicates a higher number.
Workforce distributions for other project stages per Local Authorities are presented in Appendix E.
Skill requirements and shortages
A programme of stakeholder interviews was undertaken to provide greater insight to the job roles and specific skills that will be needed to achieve the ambition of 20 GW by 2030. In total, 35 stakeholders, that are undertaking different activities across different onshore wind project stages, were contacted; 22 of these stakeholders were interviewed (see
Figure 4), including 11 developers, 2 O&M, 2 experts in skills/training, 2 from consultancies, 2 from construction, 1 owner/operator and 1 from other expertise.
Figure 4: Stakeholder organisations that were interviewed as part of this study.
Stakeholders were asked to provide their views on the following topics (see Appendix F for the full list of interview topics):
- lifecycle of a typical onshore wind project
- project-specific workforce requirements
- workforce composition and numbers
- skill level assessment
- project development challenges
- adaptation to technological advancements
- collaboration with educational institutions
- attracting and retaining talent
- impact of policy changes
- incorporating circular economy principles
- other aspects that can constrain projects.
All of those interviewed were optimistic about the future of onshore wind in Scotland, with nine (41%) indicating that they expect significant increases in turnover and recruitment in their companies as a result. However, all were quite clear that there are a number of constraints that would need to be addressed in order for this to happen. As a result, six (27%) think that their current project pipelines will not be fully realised until after 2030.
A summary of the responses regarding skills shortages is provided in the following section. The stakeholder engagement has identified significant reservations regarding the feasibility of the project pipeline implementation due to constraints other than skill shortages. These further insights are presented in Appendix G.
Specific skills shortages
Overall, based on interview responses there is significant competition for skilled and experienced people across many different job roles within the onshore wind sector. Thirteen (59%) reported significant competition for experienced members of staff, and nine (41%) for skilled staff in general, across several roles. Six (59%), including four of the developers, specifically noted that headhunting of senior staff was a routine occurrence. Furthermore, recruitment and staff retention are challenging for those that operate in more remote locations – identified by eight (36%). Several specific skills shortages were identified, and these are described as follows:
Wind turbine technicians: although industry sources indicated that a single technician can maintain ten individual turbines, in practice all ISPs, and two operators, noted that two or three wind turbine technicians are needed to do so. The reasons for this are two-fold. Any turbine undergoing maintenance must have at least two technicians working on it for health and safety reasons, one of whom must have a certified electrical qualification. Secondly, a technician will typically have experience of two or three turbines, yet there is a broad range of manufacturers and models (including legacy models). Both operators and ISPs indicated that there is already a shortage of wind turbine technicians (nine or 41% of all stakeholders interviewed). Typically, ISPs recruit individuals from other sectors where they have gained relevant expertise in an electrical, mechanical, or hydraulic engineering discipline. Feedback from all three ISPs indicates that having experience of working safely with the electrical and mechanical systems that are present in wind turbines is more important than detailed knowledge of the turbines themselves. These individuals will have a minimum NVQ level 3 / SCQF level 6 qualification and are trained on specific wind turbine technologies by their new employer, either in-house or via specialist training providers. This is a process that can take between one and two years. Two of the ISPs and one of the developers interviewed had worked directly with the further education sector to develop relevant wind turbine technician training. Staff turnover with ISPs is relatively high at 10-20%, particularly when individuals have experience and higher-level certifications. This is reported to be due to a combination of long working hours and, in some cases, significant travel requirements and/or working away from home. Some of these individuals move to offshore wind where thirteen (59%) of stakeholders reported that salaries are higher. Four (18%) specifically stated that this attracts younger workers in particular.
High voltage engineers: of those interviewed, fourteen (64%), including all of the developers, specifically stated that there is a shortage of electrical engineers in general, and high voltage engineers with Senior Authorised Person (SAP) accreditation in particular. These individuals are accredited to work safely on high-voltage equipment, to connect and maintain grid connections, and typically have at least five years’ experience. The shortage of individuals with SAP accreditation will become more pressing as onshore (and offshore) wind industries are reliant on adequate grid connections, and grid operators are undertaking significant expansion to meet these needs, which also requires high voltage engineers.
Planning officers: although principally employed by local authorities and the ECU, stakeholders noted the importance of individuals with planning experience to developers’ operations with six (27%) stating that they were aware of planning officers being actively recruited to assist with onshore wind planning applications. What this means, however, is that local authorities (and the ECU within the Scottish Government) have become limited in terms of their resources to review onshore wind farm applications. This results in delays to the consenting process, with some developers indicating that it can add several years onto the project development stage.
Speciality consultants: operators, developers and consultancy firms all agree that there is a shortage of specialist consultancy expertise covering both environmental and technical aspects. These individuals can either work within a development company or for a consultancy firm, that is then subcontracted by the developer during different project stages. The reason for this shortage is primarily because the specialist consulting market was relatively small until the large expansion of onshore and offshore renewable energy installations increased the demand for individuals with niche skills. As with other skilled individuals in the onshore wind sector, there is ample evidence of headhunting taking place, with six (27%) of stakeholders reporting high turnover of consultants and two developers indicating that they had used specialist recruitment agencies. This process can take more than 12 months and often requires the company to offer enhanced employment packages to secure the right individuals.
Civils and construction: this sector has seen a marked downturn in workforce numbers due to COVID, BREXIT and, more recently, inflationary increases that have seen construction costs spiral. The issue is that there is more than enough work available for remaining construction companies and they can afford to choose the most lucrative contracts. Given the uncertainties and delays regarding when onshore wind projects may progress to the construction and installation stage, it is becoming an increasing concern to developers (noted by two in particular) that they can secure the necessary resources. This becomes a greater issue for smaller windfarms and those in more remote locations. The constraints facing the construction sector have been confirmed by recent analysis from the Construction Industry Training Board (CITB), which indicates that 19,950 extra construction workers will be needed in Scotland before 2027 (approximately 3,910 new starts per year) (CITB, 2023).
Digital skills: of those interviewed 14 (64%) also identified a growing need for digital skills. This ranged from the ability to undertake analysis of large datasets that are produced from the sensor systems now embedded within modern turbines, to the use of drones to visually inspect turbine blades and nacelles without having to climb the turbine. Employing individuals with such skills allows operators and ISPs to monitor turbine performance remotely and more effectively, and to identify issues and take preventative action at an earlier point, thus minimising turbine downtime. SCADA, IT and data managers were also highlighted as needed to oversee the installation and operation of such systems.
Other specific skilled roles that were identified by those interviewed included: project managers (with specific experience in different onshore wind project stages and disciplines – eight interviewees), stakeholder engagement specialists (to work with LAs, landowners and local communities – seven interviewees), procurement specialists (two interviewees), legal and financial experts (two interviewees), regulatory compliance experts (one interviewee), energy traders (to understand the financial processes of energy management and trading on the market – one interviewee), quantity surveyors (one interviewee), CAD technicians (one interviewee) and operational control room staff (one interviewee).
Skills challenges in remote locations
As already noted, many of the wind farms that are within the planning process are located in remote regions, including Highland, Dumfries & Galloway, and Argyll & Bute. Of those interviewed eight (36%) stated that it was difficult to recruit and retain a local workforce for construction and installation and then O&M of a wind farm in remote areas, with four highlighting Highland, Dumfries & Galloway, and Argyll & Bute as being particularly challenging. Instead, those working on these project stages often travel from outside the area and spend up to two weeks onsite and two weeks off. Two of the ISPs operate both local and regional (travelling) teams as a result but find that it can be difficult to recruit and retain people in these regional teams. From the regional perspective, the remote and rural areas often struggle to support, cater, and accommodate the large number of temporary workforces in construction phases of projects.
Sectors competing for skills required in onshore wind
The onshore wind sector is heavily influenced by a number of other sectors, mainly offshore wind, but also wider infrastructure development.
Offshore wind uses many of the same skillsets as onshore wind, meaning that workers can transfer relatively easily from one sector to the other. Feedback from 13 (59%) of stakeholders interviewed during this study indicates that salaries tend to be higher for offshore wind, to compensate people for long periods away from home (typically two weeks) and longer shifts (generally longer hours and seven days a week). This observation is also supported by those providing training (AIS Group, 2024). Two developers and two ISPs that were interviewed as part of this study suggested that younger workers, in particular, were attracted by the higher salaries in offshore wind.
There are a number of large infrastructure projects taking place across the UK, including transport (e.g., HS2 and electrifying the rail network), decommissioning of nuclear power stations, upgrading and reinforcing the electrical grid (in anticipation of increased renewable electricity generation), and upgrades to the national gas network. Each of these needs a cohort of workers with construction and engineering, as well as other skills. Four (18%) stakeholders that were interviewed as part of this study highlighted their concerns of staff shortages in construction companies.
Altogether, this means that there is high competition between sectors for similar skilled workers and the services of the companies that employ them. Overall, nine (41%) of stakeholders indicated a shortage of skilled people affecting the wider sector. This, in turn, can cause delays to project starts and for projects to take longer than originally planned.
The emerging need and opportunities for remanufacturing
Four interviewees noted that lead times for securing wind turbines for new installations were increasing (18 months was quoted by one), and that parts were not always readily available. One stakeholder stated that they were aware of turbines that were idle because it had not been possible to secure the necessary parts.
This offers an opportunity to enhance Scotland’s remanufacturing sector. The ISPs that were consulted indicated that they routinely source remanufactured parts from UK, Danish and Dutch suppliers, and, in some cases, they can do so more quickly than new parts can be provided by OEMs. With the increasing age of wind turbine installations, and with many of the older models no longer manufactured, it becomes even more pressing to have a domestic supply chain.
Options for addressing skills shortages
Feedback from stakeholder engagement
The overriding sentiment is that the skill shortages need to be addressed urgently through encouraging more people into the sector. In the short term, this means attracting people with some existing, relevant and transferrable skills and experience to address current shortages. These individuals will have some understanding of what is required of them from their previous roles but will need to be supported through retraining and upskilling. These roles could be technical, managerial or operational. Given the projected growth of the sector and the small size of some of the companies operating within onshore wind, and ISPs in particular, it is clear that this will require external support.
At the same time, there needs to be a greater effort to encourage younger talent to enter the sector. These will be people coming through further and higher education systems via apprenticeships, or certificate, diploma and degree programmes. These individuals will be critical in three to five years’ time when onshore wind activity is expected to be at its peak. For those entering technical roles, there will be a need to ensure greater opportunities for practical, on-the-job experience. In this regard, increasing the intake and scope of apprenticeships and training schemes, such as the Wind Training Network (ESP, 2024), will be important. This network, established by ESP, has 11 further education institutions as its members but is only delivering between 70 and 80 trained individuals per year[5]. On its own, this is far too small to have a significant impact. There is, therefore, a need for more strategic and wider intervention to meet the forecast numbers of skilled workforce demand.
The most pressing action is to raise awareness of the broad range of career opportunities directly or indirectly associated with the onshore wind energy sector, especially for regional workforces. There is scope for targeted campaigns in rural areas where the majority of the new installations will take place – to demonstrate well-paid, highly skilled jobs for local people. For example, according to UK Government statistics a wind turbine technician can expect a starting salary of £25,000 reaching £47,000 with experience (National Careers Service, 2024). This compares well with the average UK salary (across all sectors and experience) of around £35,000 (Office for National Statistics, 2023). This could also help address population decline, due to younger people moving to more populated parts of the country (National Records of Scotland, 2021).
For O&M, onshore wind provides a long-term, potentially whole-life, career opportunity. Many of these and other skills required are readily transferrable to other sectors, including offshore wind and other onshore renewables, such as solar photovoltaic and battery storage. This could have an additional benefit of retaining people in their home regions, addressing the issue of depopulation and demographic changes in rural and remote areas (National Records of Scotland, 2021). For the construction sector, it is clear that Scotland is entering a phase of intensive infrastructure development in the energy and transport sectors in particular, but also across many aspects of the built environment. As a result, there will be ample employment opportunities available to individuals with these skillsets for the foreseeable future.
Therefore, there needs to be concerted action to increase the visibility of the sector to individuals in secondary, further and higher education. These are the people that could address potential workforce shortfalls towards the end of this decade and into the 2030s.
Several of those that were interviewed indicated that they had existing connections with further and higher education institutions, through recruitment, offering placements and internships, and giving lectures and talks to students. Four of the operators, two of the ISPs, one of the consultancy firms and one of the construction firms are already working with the further education sector, including Ayrshire, Dumfries & Galloway, and Dundee & Angus Colleges, to develop and refine training courses, including for wind turbine technicians. There is an opportunity to strengthen, coordinate and expand these developments through organisations such as ESP which has established strong connections between industry and the further education sector.
Overview of international skills strategies in the onshore wind sector
The Global Wind Organisation (GWO) has developed a series of certified courses that cover safety and technical aspects for technicians working in the onshore and offshore wind sectors (Global Wind Organisation, 2024). This comprises 16 standards divided into 27 training modules, which are delivered by third party training providers across the globe. Individuals completing the training are awarded certificates that can be verified by employers through an online global database. In 2023 around 156,400 individuals had certificates in at least one GWO module.
In terms of technical training for specific wind turbines, the Danish Wind Power Academy (dwpa) was one of the first dedicated training providers for the sector (Danish Wind Power Academy, 2024). Established in 2004, the trainers it employs have significant experience in technical work in the sector and can provide training across multiple wind turbine manufacturers and models. This training can be provided online or in-person and several of those interviewed for this study indicated that they had sent staff on dwpa courses, because of the high level of trainer expertise. BZEE, based in Germany, is another leading training provider (BZEE, 2024). Founded in 2000 by the German wind industry, it has developed certified training courses for the wind sector. It has a global network of training providers that deliver technical training including on specific manufacturers’ equipment. There are no such technical training facilities in Scotland. Companies instead use a combination of internal training and sending staff to training providers such as dwpa and BZEE.
There is the opportunity to consider the creation of training provision akin to dwpa or BZEE in Scotland.
Conclusions and recommendations
In conclusion, this study has indicated that the sector has skilled workforce shortages. Scotland urgently needs significantly more people to enter the onshore wind industry workforce if the country is to achieve the 20 GW ambition by 2030.
If skill shortages are not addressed, the impact on the ambition to install 20 GW of onshore wind by 2030 is likely to be severe. By 2027, our model predicts that on average four times more FTEs will be required for construction and installation than in 2024 and, within this, five times more civils contractors will be needed. More than 46% of these individuals will be required to build wind farms in Highland and Dumfries and Galloway, regions where stakeholders have highlighted that it is already difficult to recruit individuals. For O&M the figures are smaller and the timeframes longer: around 2.5 times more FTE will be required in 2030 than in 2024. However, the regions with the highest requirement are again Highland and Dumfries and Galloway, with around 37% of the total projected requirement.
Specific project findings include:
- A peak of almost 20,500 FTE will be required by 2027 across the whole of Scotland, from around 6,900 in 2024. This includes almost 18,800 FTE for construction and installation activities, representing 92% of the total workforce required.
- O&M requirements will increase from around 600 FTE in 2024 to 1,500 FTE in 2030. This number is expected to be maintained or even increased during the following decade.
- 46% of individuals constructing and installing wind farms will be working in the local authorities in Highland and Dumfries and Galloway, and a further 21% in East Ayrshire and Argyll and Bute.
- Around 37% of all O&M FTE will be working in Highland and Dumfries & Galloway from 2027 onwards.
- Technical expertise shortages, particularly in high voltage engineers and wind turbine technicians will pose significant challenges to project development and operation. An average of almost 3,000 FTE will be required each year, peaking at almost 4,500 in 2027, across Scotland to enable grid connections. A further 800 FTE wind turbine technicians will be required on average each year across Scotland to maintain installed turbines.
- A lack of skilled planners and environmental specialists will hamper the planning and consenting process, leading to delays. An average of 100 FTE planners and 434 FTE environmental consultants will be required each year to enable wind farm developments.
- Remote project locations will exacerbate workforce shortages and require innovative strategies to attract and retain talent in rural areas.
- There is a strong case for enhancing remanufacturing capacity in Scotland.
- Diverse skillsets encompassing project management, stakeholder engagement and regulatory compliance will be essential for effective project execution and communication.
Addressing these shortages will be challenging. For example, the Industrial Strategy Council, established by the UK Government in 2018, projected that by 2030 around 20% of the UK’s workforce would be under-skilled for their jobs (Industrial Strategy Council, 2020). In 2022, the IET reported that the UK had a shortfall of 173,000 skilled workers in science, technology, engineering and maths sectors, a situation that the IET had been monitoring for the previous 15 years (The Institution of Engineering and Technology, 2022). The solutions recommended from both the Industrial Strategy Council and the IET were for closer collaboration between government, industry and education/training providers to address these challenges, and that upskilling and reskilling would be key elements of this.
Recommendations
Investing in skills development is essential for the success of individual onshore wind projects and for achieving Scotland’s broader renewable energy goals. Addressing these shortages will require a comprehensive approach, including workforce development initiatives, training programmes and industry-academy collaborations. In this regard, collaboration between public, private and education sector stakeholders will be crucial to bridge skills divides and unlock the full potential of Scotland’s onshore wind resources.
Further actions may include:
- Undertaking an awareness raising programme of career opportunities within the sector, the transferrable nature of the skills developed and that this is a sector that is a key contributor to achieving net zero, and will be active for a long time (potentially a whole life career).
- Targeted campaigns in rural areas where the majority of the new installations will take place, to demonstrate well-paid, highly skilled jobs for local people. This could also help address population decline, due to younger people moving to more populated parts of the country.
- Extending wind turbine technician training in Scotland to support the O&M of onshore, and eventually offshore, wind farms. This could build on the Wind Training Network already established by ESP and extend this training to specific wind turbine models, as provided by dwpa and BZEE. Alternatively, it could be delivered in partnership with one or both of these organisations, for example, establishing a subsidiary of dwpa or BZEE in Scotland.
References
AIS Group (2024). More information available at: https://training.aisgroup.co.uk/pages/expertareaarticle.aspx?id=86
Blackridge Research & Consulting (2022). Global Top 15 Wind Turbine Manufacturers (2022). Available at: https://www.blackridgeresearch.com/blog/top-wind-turbine-manufacturers-makers-companies-suppliers
Bloomberg NEF (2023). Goldwind and Vestas in Photo Finish for Top Spot as Global Wind Power Additions Fall. Available at: https://about.bnef.com/blog/goldwind-and-vestas-in-photo-finish-for-top-spot-as-global-wind-power-additions-fall/
BVG Associates (2023). Scotland onshore wind pipeline analysis 2023-2030. Available at: https://www.scottishrenewables.com/assets/000/003/621/Scotland_2030_Pipeline_Analysis_Dec_22_FULL_REPORT_original.pdf
BZEE (2024). More information available at: https://www.bzee-association.org/
Danish Wind Power Academy (2024). More information available at: https://danishwpa.com/
Department for Energy Security and Net Zero (2023). Renewable Energy Planning Database. Available at: https://www.gov.uk/government/publications/renewable-energy-planning-database-monthly-extract
ESP (2024). Wind Training Network established by ESP in 2012 to support the sector growth. More information available at: https://esp-scotland.ac.uk/energy-transition/
Global Wind Energy Council (2023). Mission Critical: Building the global wind energy supply chain for a 1.5°C world. Available at: https://gwec.net/supplychainreport2023/
Global Wind Energy Council & Global Wind Organisation (2023). Global Wind Workforce Outlook 2023-2027. Available at: https://gwec.net/global-wind-workforce-outlook-2023-2027-pr/
Global Wind Organisation (2024). More information available at: https://www.globalwindsafety.org/
Industrial Strategy Council (2020). Rising to the UK’s Skills Challenges. Available at: https://industrialstrategycouncil.org/sites/default/files/attachments/Rising%20to%20the%20UK%27s%20skills%20challenges.pdf
International Energy Agency (2024). More information available at: https://www.iea.org/energy-system/renewables/wind
ITPEnergised (2024). One of the partners delivering this study, is an established environmental and technology consultancy that has advised clients in more than 500 onshore wind farm projects. More information available at: https://www.itpenergised.com/
National Careers Service (2024). More information available at: https://nationalcareers.service.gov.uk/job-profiles/wind-turbine-technician
National Records of Scotland (2021). Population Grows in Large Cities, Declines in Remote Areas. Available at: https://www.nrscotland.gov.uk/news/2021/population-grows-in-large-cities-declines-in-remote-areas
Office for National Statistics (2021). Low carbon and renewable energy economy, UK: 2021. Available at: https://www.ons.gov.uk/economy/environmentalaccounts/bulletins/finalestimates/2021
Office for National Statistics (2023). Employee earnings in the UK: 2023. Available at: https://www.ons.gov.uk/employmentandlabourmarket/peopleinwork/earningsandworkinghours/bulletins/annualsurveyofhoursandearnings/2023
OurWorldInData (2024). Renewable Energy. Available at: https://ourworldindata.org/renewable-energy
Ramboll (2023). Assessment of the structure, conduct and performance of Scotland’s onshore wind, offshore wind and hydrogen sectors. Available at: https://www.climatexchange.org.uk/projects/economic-analysis-of-scotlands-wind-and-hydrogen-sectors/
ReBladeLtd (2024). More information available at: https://reblade.com/
Renewable Parts Ltd (2024). More information available at: https://www.renewable-parts.com/
Scottish Government (2022). Onshore Wind: Policy Statement 2022. Available at: https://www.gov.scot/publications/onshore-wind-policy-statement-2022/
Scottish Government (2023). Onshore Wind Sector Deal for Scotland. Available at: https://www.gov.scot/publications/onshore-wind-sector-deal-scotland/
The Construction Industry Training Board (2023). 19,550 extra construction workers needed in Scotland by 2027. Available at: https://www.citb.co.uk/about-citb/news-events-and-blogs/19-550-extra-construction-workers-needed-in-scotland-by-2027/
The Institution of Engineering and Technology (2022). Engineering Kids’ Futures. Available at: https://www.theiet.org/media/11077/engineering-kids-futures.pdf
Wind Europe (2024). More information available at: https://windeurope.org/about-wind/wind-basics/
Appendices
Appendix A – Onshore wind global market overview
As the onshore wind sector has matured, so has the ability to maximise the amount of electricity produced, even in areas with lower wind speeds. Turbines have become larger, with rotor diameters typically 120 m long compared with 15 m in 1985. Turbines now generate up to 7.5 MW compared with less than 1 MW in 1985 (Wind Europe, 2024). Countries across the globe are looking to wind (in addition to solar and hydro) to provide clean and sustainable energy. According to the International Energy Agency (IEA), combined onshore and offshore wind generated more than 2,100 TWh of electricity in 115 countries across the world in 2022 (International Energy Agency, 2024). China is dominating this growth, installing 59 GW in 2023 alone (half of all global installations in 2023), compared with 17.9 GW in the European Union (EU) and 11 GW in the United States (US). However, to achieve global net zero targets, annual installations will need to reach 350 GW by 2030. Onshore wind accounts for 93% of all installed wind capacity, although the share from offshore wind is expected to increase, with offshore responsible for 18% of new capacity installed in 2022. Wind is second to hydropower in terms of global renewable energy production (OurWorldInData, 2024).

Figure 5: Key components of a wind turbine. From ‘Background analysis of the quality of the energy data to be considered for the European Reference Life Cycle Database (ELCD)’ (2013). 10.2788/5377
Manufacturing of wind turbines and their parts takes place in several countries. China dominates with ten of the top fifteen global manufacturers (Blackridge Research & Consulting, 2022). Vestas Wind Systems (Denmark) and Goldwind (China) are the largest manufacturers by installed turbine capacity (Bloomberg NEF, 2023). Other European manufacturers include Siemens Gamesa Renewable Energy (Spain), GE Renewable Energy (France), Nordex (Germany) and ENERCON (Germany). Each of these companies exports turbines across the globe. The only wind turbine manufacturing sites in the UK are for offshore wind turbine blades: Vestas has a site located on the Isle of Wight, and Siemens Gamesa has a site in Hull.
Manufacturing is not, however, keeping pace with the anticipated demand for the installation or supply of spare parts for operations and maintenance (Global Wind Energy Council, 2023). This has been attributed to a number of factors including increasing manufacturing costs and uncertainty regarding the timing of large-scale installations in different countries. Leading global organisations such as the IEA and the Global Wind Energy Council (GWEC) have stated publicly that more needs to be done to support the wider onshore wind supply chain to meet the global installed capacity ambition. The key components of a turbine are highlighted in Figure 5.
Although manufacturing of new onshore turbines and their components is not expected to happen within Scotland within the period to 2030; refurbishment and remanufacturing of parts for existing, largely legacy turbines, is already happening and has potential to be expanded. This will require skilled people.
Global trends regarding skills demand in the onshore wind sector
Construction / installation, and operations and maintenance (O&M) of windfarms will require the largest numbers of individuals, compared to other project stages in the period to 2030. Globally, it is estimated that by 2027 there will be a need for 256,000 technicians to construct and install onshore wind turbines and a further 243,500 to undertake O&M activities, an annual increase of 17% on 2022 figures (Global Wind Energy Council & Global Wind Organisation, 2023). Of all technicians employed in the wind sector, 87% are expected to work onshore. Further analysis suggests that almost 43% of these individuals will be new recruits to the sector (based on growth projections and an annual attrition rate of 6%) (International Energy Agency, 2024). Overall, this indicates a large global competition for individuals with such skills.
For new entrants into technical roles, wind sector employers tend to recruit either directly from further or higher education or from other sectors that have relevant transferable skills, e.g., oil & gas, or vehicle maintenance. These individuals are then provided with in-house training, supplemented as required with external training, that is specific to the wind sector.
Appendix B – Onshore wind project lifecycle
|
Stage |
Feasibility |
Development |
Construction |
O&M |
End-of-life |
|---|---|---|---|---|---|
|
Duration |
1 year |
3-4 years |
1-2 years |
25+ years | |
|
Project lifecycle activities |
|
|
|
|
|
Appendix C – Job roles, skill level and years of experience
The job roles, skill level and years of experience in the table below were produced through consultation with a range of IPTEnergised members of staff that have experience of, and responsibility for, delivering different phases of onshore wind projects. This internal assessment was validated by sharing with all engaged stakeholders at the end of February 2024.
|
Job role |
Skill level |
Exp. Yrs (>) |
|---|---|---|
|
Civil engineer |
Post-grad |
5 |
|
Electrical engineer |
Degree |
5 |
|
Mechanical engineer |
Degree |
5 |
|
Environmental consultant – ECoW |
Variable |
2 |
|
Environmental consultant – ornithologist |
Variable |
4 |
|
Environmental consultant – ecologist |
Variable |
4 |
|
Environmental consultant – hydro/hydrogeo/geologist/peat specialist |
Degree |
4 |
|
Environmental consultant – noise & vibration |
Degree |
4 |
|
Environmental consultant – cultural heritage/archaeologists |
Degree |
4 |
|
Environmental consultant – forester |
HND/HNC (+) |
2 |
|
Project manager |
Degree |
3 |
|
Health & safety officer |
HNC/HND/GWO |
3 |
|
Wind turbine technician |
HNC/HND/GWO |
1 |
|
Workshop mechanic |
Variable |
1 |
|
HV technician |
Variable |
5 |
|
Logistics manager |
Variable |
1 |
|
Electrician |
Variable |
1 |
|
IT manager |
Post-grad |
2 |
|
Civils contractor |
Variable |
1 |
|
Transport operative |
Variable |
5 |
|
Asset manager |
Degree |
2 |
|
Consultant – site design and modelling |
Degree |
2 |
|
Consultant – energy yield assessors and WindPro design specialists |
Degree |
2 |
|
Consultant – shadow flicker |
Degree |
2 |
|
Consultant – grid connection consultancy and application |
Degree |
2 |
|
Consultant – landscape & visual consultant |
Degree |
2 |
|
Consultant – carbon consultant/specialist |
Degree |
2 |
|
Consultant – aviation, radar & telecommunications |
Degree |
2 |
|
Back-office support |
Variable |
1 |
|
Grid connection installation |
HNC/HND |
5 |
|
DNO EHV commissioning engineer |
HNC/HND |
10 |
|
Protection engineer |
HNC/HND |
10 |
|
Crane/lifting contractor |
HNC/HND |
2 |
|
Planning officers |
Degree |
4 |
|
DNO case worker |
Degree |
4 |
|
Financial analyst |
Degree |
1 |
|
eBoP contractor |
Degree |
5 |
|
Structural engineer |
Degree (+) |
5 |
|
TSA/OEM project delivery team |
Variable |
1 |
Appendix D – FTE requirements for different project stages
Detailed model description
A model was developed to estimate the workforce requirement in the onshore wind industry that will enable us to provide a breakdown of the total workforce requirements into specific job roles.
To develop the model, we used the knowledge base of our project partner IPTEnergised, who have developed and supported over 500 onshore wind projects, to create a simulated onshore wind farm (90MW installed capacity) and a detailed description of job roles and their fulltime equivalents across all stages of the wind farm life cycle (feasibility, development, construction, operations and maintenance, end of life). This part of the model served as a basis for the estimated FTEs per job role per project stage, normalised to 1GW (FTE/GW). The resulting FTE number per GW was then multiplied by the BVGA forecasts of total GW capacity in each wind farm life cycle stage in the timeframe from 2024 to 2030. This calculation yielded the number of FTEs by job role by project stage across the entire pipeline of Scottish onshore wind projects in 2024-2030.
As a quality control for the FTE/GW assumption from the IPTEnergised, we used the data from LCREE 2021 that has been interpreted by Ramboll (2023) to break down the total employment numbers into those involved in the construction and operations of onshore wind farms. We divided this number by the onshore wind capacity under construction and in operation, respectively, to yield an estimate for FTEs per GW that are independent from those presented in the IPTEnergised model. This quality control exercise showed that the FTE/GW assumptions presented by IPTEnergised are consistent with the employment in the sector in 2021. The 2021 time point was used to enable the use of Ramboll interpretation of LCREE 2021 data. LCREE 2022 was released in March 2023. LCREE is an industry self-reported dataset that has certain limitations associated with the differences in individual interpretation of employment in the low carbon/renewable energy sector.
|
FTE/GW |
LCREE 2021 (Ramboll Interpretation) / REPD 2021 |
IPTEnergised |
|
Construction |
1929 |
1644 |
|
Operations |
100 |
56 |
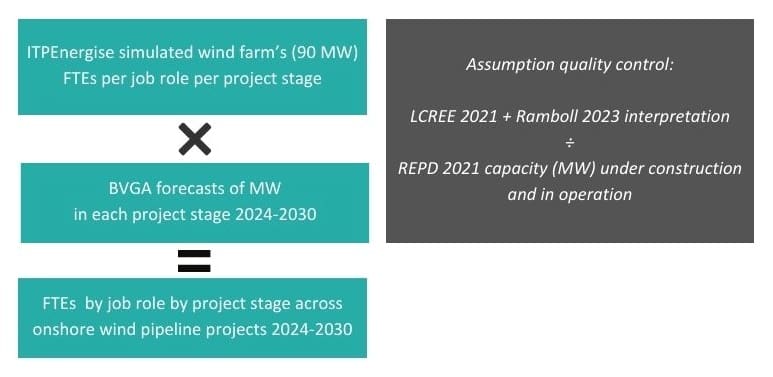 The figure below illustrates the data sources and activities carried out to create and validate the model.
Figure 6: Data sources for model validation.
The heatmaps below illustrate FTE requirements for different project stages in 2024-2030. A darker colour indicates a higher value, representing a relatively higher FTE demand for a job role.
|
Job roles (feasibility) |
2024 |
2025 |
2026 |
2027 |
2028 |
2029 |
2030 |
|
Project manager |
77 |
56 |
36 |
13 |
5 |
2 |
3 |
|
Consultant – Site design and modelling |
31 |
22 |
14 |
5 |
2 |
1 |
1 |
|
Consultant – energy yield assessors & WindPro design |
46 |
33 |
22 |
8 |
3 |
1 |
2 |
|
Consultant – grid connection consultancy and application |
46 |
33 |
22 |
8 |
3 |
1 |
2 |
|
Planning officers |
46 |
33 |
22 |
8 |
3 |
1 |
2 |
|
Environmental consultant |
46 |
33 |
22 |
8 |
3 |
1 |
2 |
|
Financial analyst |
307 |
222 |
143 |
52 |
21 |
7 |
12 |
|
FTE |
599 |
433 |
280 |
101 |
40 |
13 |
24 |
|
Job roles (development) |
2024 |
2025 |
2026 |
2027 |
2028 |
2029 |
2030 |
|
Project manager |
154 |
131 |
125 |
88 |
60 |
13 |
9 |
|
Environmental consultant |
694 |
561 |
394 |
269 |
60 |
40 |
0 |
|
Planning officers |
123 |
105 |
100 |
70 |
48 |
11 |
7 |
|
DNO case worker |
46 |
39 |
37 |
26 |
18 |
4 |
3 |
|
Consultant – grid connection & application |
46 |
39 |
37 |
26 |
18 |
4 |
3 |
|
FTE |
1065 |
875 |
693 |
479 |
203 |
71 |
21 |
|
Job roles (construction) |
2024 |
2025 |
2026 |
2027 |
2028 |
2029 |
2030 |
|
Project manager |
31 |
68 |
95 |
127 |
100 |
96 |
58 |
|
Civils contractor |
1577 |
3392 |
4783 |
6357 |
5034 |
4835 |
2907 |
|
Civil engineer |
63 |
136 |
192 |
255 |
202 |
194 |
116 |
|
Planning officers |
6 |
14 |
19 |
26 |
20 |
20 |
12 |
|
Crane/lifting contractor |
473 |
1017 |
1435 |
1907 |
1510 |
1450 |
872 |
|
Grid connection installation1 |
1104 |
2374 |
3348 |
4450 |
3524 |
3385 |
2035 |
|
DNO EHV commissioning engineer2 |
126 |
271 |
382 |
508 |
402 |
387 |
232 |
|
Transport operative |
473 |
1017 |
1435 |
1907 |
1510 |
1450 |
872 |
|
Logistics manager |
31 |
68 |
95 |
127 |
100 |
96 |
58 |
|
Back-office support |
158 |
339 |
479 |
636 |
504 |
484 |
291 |
|
Health & safety officer |
95 |
203 |
287 |
381 |
302 |
290 |
174 |
|
Environmental consultant |
31 |
68 |
95 |
127 |
100 |
96 |
58 |
|
Environmental consultant – EcoW |
9 |
20 |
29 |
38 |
30 |
29 |
17 |
|
TSA/OEM project delivery team |
95 |
203 |
287 |
381 |
302 |
290 |
174 |
|
Electrical engineer |
63 |
136 |
192 |
255 |
202 |
194 |
116 |
|
eBoP contractor |
315 |
678 |
956 |
1271 |
1006 |
967 |
581 |
|
FTE |
4651 |
10005 |
14110 |
18752 |
14849 |
14263 |
8576 |
|
Job roles (operations) |
2024 |
2025 |
2026 |
2027 |
2028 |
2029 |
2030 |
|
Wind turbine technician |
465 |
531 |
596 |
776 |
931 |
1097 |
1198 |
|
HV technician |
11 |
13 |
14 |
18 |
22 |
26 |
28 |
|
IT manager |
11 |
13 |
14 |
18 |
22 |
26 |
28 |
|
Asset manager |
22 |
25 |
28 |
37 |
44 |
52 |
56 |
|
Crane/lifting contractor |
1 |
1 |
1 |
2 |
2 |
2 |
3 |
|
Logistics manager |
33 |
38 |
42 |
55 |
66 |
78 |
85 |
|
Back-office support |
11 |
13 |
14 |
18 |
22 |
26 |
28 |
|
Health & safety officer |
11 |
13 |
14 |
18 |
22 |
26 |
28 |
|
Environmental consultant |
11 |
13 |
14 |
18 |
22 |
26 |
28 |
|
Electrician |
1 |
1 |
1 |
2 |
2 |
2 |
3 |
|
FTE |
576 |
659 |
739 |
962 |
1154 |
1360 |
1486 |
|
Job roles (end of life) |
2024 |
2025 |
2026 |
2027 |
2028 |
2029 |
2030 |
|
Project manager |
0 |
1 |
0 |
1 |
1 |
12 |
3 |
|
Civils contractor |
1 |
37 |
2 |
59 |
55 |
621 |
157 |
|
Civil engineer |
0 |
1 |
0 |
2 |
2 |
25 |
6 |
|
Planning officers |
0 |
0 |
0 |
0 |
0 |
2 |
1 |
|
Crane/lifting contractor |
0 |
11 |
1 |
18 |
16 |
186 |
47 |
|
Grid connection installation1 |
1 |
26 |
1 |
41 |
38 |
435 |
110 |
|
DNO EHV commissioning engineer2 |
0 |
3 |
0 |
5 |
4 |
50 |
13 |
|
Transport operative |
0 |
11 |
1 |
18 |
16 |
186 |
47 |
|
Logistics manager |
0 |
1 |
0 |
1 |
1 |
12 |
3 |
|
Back-office support |
0 |
4 |
0 |
6 |
5 |
62 |
16 |
|
Health & safety officer |
0 |
2 |
0 |
4 |
3 |
37 |
9 |
|
Environmental consultant |
0 |
1 |
0 |
1 |
1 |
12 |
3 |
|
Environmental consultant – EcoW |
0 |
0 |
0 |
0 |
0 |
4 |
1 |
|
TSA/OEM project delivery team |
0 |
2 |
0 |
4 |
3 |
37 |
9 |
|
Electrical engineer |
0 |
1 |
0 |
2 |
2 |
25 |
6 |
|
eBoP contractor |
0 |
7 |
0 |
12 |
11 |
124 |
31 |
|
FTE |
4 |
110 |
6 |
174 |
162 |
1833 |
463 |
Notes:
- Grid connection installation requires multiple skills and can vary dependent on the specific wind farm location. Specific skilled roles are:
- Project managers
- Designers
- Land agents (for land rights)
- Equipment manufacture
- Civils teams for installation
- Cable pullers, jointers, etc
- Linesmen (for OHL connections)
- Commissioning engineers
- SAPs
- Protection engineers
These are additional FTEs to these with the same skillsets required for other aspects of the construction and installation phase. However, the same individual can perform multiple roles that require the same skillset (up to one FTE) across this phase.
- Two DNO EHV commissioning engineers are required for each of the developer and the subcontractor for the DNO.
Appendix E – FTE requirements by project stage and Local Authority
Local authorities with no forecast activities in specific project stages are not included in the tables below.
|
Local authority |
2023 |
2024 |
2025 |
2026 |
2027 |
2028 |
2029 |
2030 |
|
Aberdeen City Council |
0 |
0 |
0 |
0 |
0 |
0 |
0 |
0 |
|
Aberdeenshire Council |
26 |
15 |
8 |
5 |
0 |
0 |
0 |
0 |
|
Argyll and Bute Council |
100 |
81 |
57 |
25 |
4 |
4 |
0 |
0 |
|
Clackmannanshire Council |
2 |
2 |
2 |
2 |
0 |
0 |
0 |
0 |
|
Dumfries & Galloway Council |
86 |
55 |
36 |
25 |
10 |
0 |
0 |
0 |
|
East Ayrshire Council |
59 |
58 |
6 |
1 |
0 |
0 |
0 |
0 |
|
East Lothian Council |
8 |
0 |
0 |
0 |
0 |
0 |
0 |
0 |
|
Fife Council |
0 |
0 |
0 |
0 |
0 |
0 |
0 |
0 |
|
Highland Council |
182 |
140 |
106 |
59 |
12 |
0 |
0 |
0 |
|
Midlothian Council |
7 |
0 |
0 |
0 |
0 |
0 |
0 |
0 |
|
Moray Council |
9 |
9 |
7 |
0 |
0 |
0 |
0 |
0 |
|
North Ayrshire Council |
5 |
5 |
5 |
5 |
0 |
0 |
0 |
0 |
|
North Lanarkshire Council |
20 |
17 |
17 |
1 |
0 |
0 |
0 |
0 |
|
Orkney Islands Council |
2 |
0 |
0 |
0 |
0 |
0 |
0 |
0 |
|
Perth & Kinross Council |
31 |
31 |
31 |
10 |
0 |
0 |
0 |
0 |
|
Scottish Borders Council |
72 |
59 |
27 |
20 |
12 |
0 |
0 |
0 |
|
Shetland Islands Council |
1 |
0 |
2 |
2 |
2 |
2 |
0 |
0 |
|
South Ayrshire Council |
11 |
5 |
2 |
15 |
13 |
13 |
13 |
0 |
|
South Lanarkshire Council |
27 |
23 |
17 |
14 |
14 |
0 |
0 |
0 |
|
Stirling Council |
5 |
0 |
0 |
0 |
0 |
0 |
0 |
0 |
|
Unknown |
105 |
108 |
121 |
101 |
37 |
22 |
0 |
25 |
|
West Dunbartonshire Council |
9 |
0 |
0 |
0 |
0 |
0 |
0 |
0 |
|
West Lothian Council |
2 |
0 |
0 |
0 |
0 |
0 |
0 |
0 |
|
Western Isles Council / Comhairle nan Eilan Siar |
6 |
6 |
0 |
0 |
0 |
0 |
0 |
0 |
|
Total |
775 |
613 |
443 |
286 |
103 |
41 |
13 |
25 |
|
Local authority |
2023 |
2024 |
2025 |
2026 |
2027 |
2028 |
2029 |
2030 |
|
Aberdeen City Council |
0 |
0 |
0 |
0 |
0 |
0 |
0 |
0 |
|
Aberdeenshire Council |
27 |
20 |
19 |
17 |
7 |
3 |
0 |
0 |
|
Angus Council |
1 |
0 |
0 |
0 |
0 |
0 |
0 |
0 |
|
Argyll and Bute Council |
47 |
56 |
65 |
58 |
24 |
12 |
4 |
4 |
|
Clackmannanshire Council |
0 |
0 |
0 |
2 |
2 |
0 |
0 |
0 |
|
Dumfries & Galloway Council |
154 |
136 |
67 |
36 |
28 |
24 |
0 |
0 |
|
East Ayrshire Council |
19 |
59 |
57 |
51 |
1 |
0 |
0 |
0 |
|
East Lothian Council |
8 |
8 |
8 |
0 |
0 |
0 |
0 |
0 |
|
East Renfrewshire Council |
0 |
0 |
0 |
0 |
0 |
0 |
0 |
0 |
|
Fife Council |
0 |
0 |
0 |
0 |
0 |
0 |
0 |
0 |
|
Highland Council |
161 |
134 |
116 |
130 |
77 |
55 |
0 |
0 |
|
Midlothian Council |
7 |
7 |
0 |
0 |
0 |
0 |
0 |
0 |
|
Moray Council |
16 |
15 |
9 |
7 |
0 |
0 |
0 |
0 |
|
North Ayrshire Council |
3 |
0 |
0 |
5 |
5 |
5 |
0 |
0 |
|
North Lanarkshire Council |
3 |
3 |
17 |
17 |
17 |
0 |
0 |
0 |
|
Orkney Islands Council |
4 |
2 |
2 |
0 |
0 |
0 |
0 |
0 |
|
Perth & Kinross Council |
4 |
0 |
21 |
31 |
31 |
6 |
0 |
0 |
|
Scottish Borders Council |
78 |
81 |
66 |
47 |
26 |
20 |
0 |
0 |
|
Shetland Islands Council |
9 |
1 |
1 |
0 |
0 |
2 |
2 |
0 |
|
South Ayrshire Council |
23 |
24 |
9 |
2 |
2 |
2 |
13 |
13 |
|
South Lanarkshire Council |
36 |
23 |
27 |
6 |
14 |
14 |
0 |
0 |
|
Stirling Council |
5 |
5 |
0 |
0 |
0 |
0 |
0 |
0 |
|
Unknown |
0 |
25 |
25 |
80 |
117 |
97 |
34 |
18 |
|
West Dunbartonshire Council |
9 |
9 |
9 |
9 |
0 |
0 |
0 |
0 |
|
West Lothian Council |
5 |
2 |
0 |
0 |
0 |
0 |
0 |
0 |
|
Western Isles Council / Comhairle nan Eilan Siar |
0 |
6 |
6 |
0 |
0 |
0 |
0 |
0 |
|
Total |
619 |
616 |
523 |
497 |
349 |
239 |
53 |
35 |
|
Local authority |
2024 |
2025 |
2026 |
2027 |
2028 |
2029 |
2030 |
|
Aberdeenshire Council |
81 |
149 |
283 |
696 |
806 |
424 |
191 |
|
Argyll and Bute Council |
0 |
345 |
1024 |
1748 |
2317 |
1421 |
571 |
|
Dumfries & Galloway Council |
416 |
2028 |
3723 |
4335 |
2013 |
1573 |
725 |
|
East Ayrshire Council |
0 |
323 |
704 |
2018 |
1669 |
1398 |
35 |
|
East Lothian Council |
0 |
0 |
230 |
230 |
230 |
0 |
0 |
|
Highland Council |
514 |
1788 |
2819 |
4173 |
3071 |
2615 |
1834 |
|
Midlothian Council |
0 |
0 |
0 |
208 |
208 |
208 |
0 |
|
Moray Council |
162 |
1232 |
1321 |
948 |
344 |
56 |
0 |
|
North Ayrshire Council |
2 |
2 |
0 |
0 |
0 |
0 |
0 |
|
North Lanarkshire Council |
0 |
68 |
68 |
0 |
0 |
475 |
475 |
|
Orkney Islands Council |
51 |
51 |
46 |
46 |
0 |
0 |
0 |
|
Perth & Kinross Council |
0 |
129 |
129 |
129 |
397 |
863 |
466 |
|
Scottish Borders Council |
955 |
1436 |
1095 |
909 |
1022 |
981 |
1012 |
|
Shetland Islands Council |
855 |
93 |
475 |
475 |
382 |
0 |
0 |
|
South Ayrshire Council |
383 |
561 |
699 |
694 |
516 |
153 |
0 |
|
South Lanarkshire Council |
1024 |
1248 |
258 |
883 |
663 |
538 |
38 |
|
Stirling Council |
0 |
195 |
195 |
0 |
0 |
0 |
0 |
|
Unknown |
0 |
0 |
733 |
733 |
116 |
2644 |
2423 |
|
West Dunbartonshire Council |
0 |
0 |
0 |
0 |
257 |
257 |
257 |
|
West Lothian Council |
107 |
167 |
38 |
0 |
0 |
0 |
0 |
|
Western Isles Council / Comhairle nan Eilan Siar |
12 |
0 |
0 |
168 |
554 |
386 |
386 |
|
Total |
4562 |
9813 |
13840 |
18393 |
14564 |
13990 |
8412 |
|
Local authority |
2023 |
2024 |
2025 |
2026 |
2027 |
2028 |
2029 |
2030 |
|
Aberdeenshire Council |
51 |
55 |
55 |
63 |
63 |
87 |
99 |
107 |
|
Angus Council |
2 |
2 |
2 |
2 |
2 |
2 |
2 |
2 |
|
Argyll and Bute Council |
42 |
39 |
39 |
50 |
58 |
115 |
177 |
188 |
|
Clackmannanshire Council |
5 |
5 |
5 |
5 |
5 |
5 |
5 |
5 |
|
Dumfries & Galloway Council |
112 |
112 |
124 |
146 |
280 |
332 |
382 |
395 |
|
East Ayrshire Council |
90 |
90 |
90 |
96 |
127 |
141 |
210 |
158 |
|
East Lothian Council |
15 |
15 |
15 |
15 |
15 |
27 |
27 |
27 |
|
East Renfrewshire Council |
4 |
4 |
4 |
4 |
4 |
4 |
4 |
4 |
|
Falkirk Council |
4 |
4 |
4 |
4 |
4 |
4 |
4 |
4 |
|
Fife Council |
9 |
9 |
9 |
9 |
9 |
9 |
9 |
9 |
|
Highland Council |
212 |
214 |
224 |
252 |
335 |
422 |
486 |
547 |
|
Inverclyde Council |
3 |
3 |
3 |
3 |
3 |
3 |
3 |
3 |
|
Midlothian Council |
0 |
0 |
0 |
0 |
0 |
0 |
11 |
11 |
|
Moray Council |
50 |
50 |
50 |
73 |
114 |
129 |
132 |
132 |
|
North Ayrshire Council |
13 |
13 |
13 |
13 |
13 |
13 |
13 |
11 |
|
North Lanarkshire Council |
29 |
29 |
29 |
32 |
32 |
32 |
32 |
47 |
|
Orkney Islands Council |
5 |
5 |
7 |
7 |
9 |
9 |
9 |
8 |
|
Perth & Kinross Council |
30 |
30 |
30 |
30 |
37 |
37 |
58 |
82 |
|
Scottish Borders Council |
74 |
77 |
123 |
140 |
154 |
174 |
202 |
218 |
|
Shetland Islands Council |
1 |
1 |
1 |
1 |
6 |
25 |
25 |
25 |
|
South Ayrshire Council |
55 |
55 |
67 |
75 |
84 |
103 |
111 |
111 |
|
South Lanarkshire Council |
135 |
139 |
193 |
193 |
206 |
213 |
239 |
241 |
|
Stirling Council |
16 |
16 |
16 |
26 |
26 |
26 |
26 |
26 |
|
Unknown |
0 |
3 |
3 |
3 |
41 |
41 |
41 |
129 |
|
West Dunbartonshire Council |
0 |
0 |
0 |
0 |
0 |
0 |
0 |
13 |
|
West Lothian Council |
18 |
20 |
26 |
28 |
28 |
28 |
28 |
28 |
|
Western Isles Council / Comhairle nan Eilan Siar |
4 |
5 |
5 |
5 |
5 |
14 |
14 |
34 |
|
Total |
980 |
996 |
1138 |
1276 |
1661 |
1994 |
2349 |
2566 |
|
Local authority |
2023 |
2024 |
2025 |
2026 |
2027 |
2028 |
2029 |
2030 |
|
Aberdeenshire Council |
0 |
0 |
0 |
0 |
2 |
0 |
28 |
61 |
|
Argyll and Bute Council |
57 |
0 |
27 |
0 |
25 |
0 |
1 |
0 |
|
Dumfries & Galloway Council |
0 |
0 |
0 |
0 |
42 |
4 |
0 |
73 |
|
East Ayrshire Council |
0 |
0 |
0 |
0 |
0 |
22 |
1040 |
0 |
|
East Renfrewshire Council |
0 |
0 |
0 |
4 |
0 |
0 |
0 |
0 |
|
Highland Council |
0 |
0 |
0 |
0 |
0 |
97 |
0 |
25 |
|
Moray Council |
0 |
0 |
0 |
0 |
0 |
0 |
0 |
98 |
|
North Ayrshire Council |
0 |
0 |
0 |
0 |
0 |
0 |
46 |
0 |
|
North Lanarkshire Council |
0 |
0 |
0 |
0 |
0 |
0 |
186 |
53 |
|
Orkney Islands Council |
0 |
3 |
3 |
0 |
5 |
4 |
7 |
2 |
|
Perth & Kinross Council |
0 |
0 |
0 |
0 |
0 |
0 |
0 |
52 |
|
Scottish Borders Council |
0 |
0 |
53 |
0 |
60 |
0 |
130 |
0 |
|
Shetland Islands Council |
0 |
0 |
4 |
0 |
3 |
0 |
0 |
0 |
|
South Lanarkshire Council |
0 |
0 |
0 |
1 |
0 |
0 |
0 |
0 |
|
Total |
58 |
3 |
87 |
5 |
137 |
127 |
1439 |
363 |
Appendix F – Stakeholder interview structure
The interview structure was approved by the project Steering Group as follows:
- Lifecycle of an onshore wind project: could you walk us through the typical lifecycle of one of your onshore wind projects and the key workforce needs at each stage?
- Project-specific workforce requirements: for your current and upcoming projects, what specific job roles and skills levels are you prioritising?
- Workforce composition and numbers: what does the workforce composition look like in terms of numbers and roles for a typical wind farm project?
- Skill level assessment: how do you assess the skill levels required for various job roles within your projects? What overlaps are there with related sectors, particularly offshore wind?
- Project development challenges: are there any unique challenges in project development that are creating new demands for specific skills or roles?
- Adaptation to technological advancements: how is your workforce adapting to the rapid technological advancements in the wind energy sector? What internal training do you provide (e.g., including apprenticeship programmes)?
- Collaboration with educational institutions: what role can partnerships with universities and vocational training institutes play in addressing the skill gaps?
- Attracting and retaining talent: do you experience recruitment difficulties (current or predicted) for any specific roles? What strategies can be implemented to make the onshore wind sector more attractive to skilled professionals, especially in a competitive job market? Is it more difficult to recruit in certain locations than others?
- Impact of policy changes: how do recent and upcoming policy changes influence the skill needs in the sector, and how is the industry adapting? What are the anticipated challenges in scaling up to meet this target?
- Incorporating circular economy principles: how can the industry integrate circular economy principles into its workforce development plans (e.g., recycling, repowering, decommissioning)?
Appendix G – Further insights from stakeholder engagement
In addition to workforce and skills issues, interviewees also highlighted a number of other factors that are constraining sector development. Of these, delays to grid connections and planning consent were stated by all of those interviewed as causing significant issues. We discuss here the delays caused by skills shortages outside the onshore wind industry.
Securing a grid connection date that aligns with project timelines is the most important factor for all developers. Without this the project cannot progress beyond early development stages. At present developers are being offered grid connection dates of mid 2030s for new projects. However, two reported that existing dates that had been agreed with the distribution network operator (DNO) have also been delayed. These delays can be due to a number of issues: resource shortages with the DNO due to competing demands; or lack of skilled workers (e.g., high voltage electrical engineers); or delays in planning consent for DNO operations (e.g., installing the 400kV lines that are required to connect to wind farms to the grid).
Planning consent from local authorities and the ECU within the Scottish Government (for wind farms larger than 50 MW) are also causing significant delays. Developers indicated that the process of securing planning permission can take several years, primarily because of personnel shortages within the LAs and the ECU, but, in some cases, also the time taken in addressing objections from the local community which can trigger a public inquiry. 64% of those interviewed (of which nine were developers) indicated that this was a significant issue. The SOWSD commitment to halve the consenting time to one year (or two years if there is a public inquiry) has been welcomed by the sector, but individuals remain sceptical that this will be achieved given that the resource in planning departments has not been increased.
Five developers also commented that projects which had been granted a grid connection date but had not progressed through the planning consent process for several years, should be removed to free resources and increase the chances of other projects being granted a grid connection.
These delays can increase developer costs. For example, other permits and leases may need to be maintained and paid for, the costs for subcontract labour and materials may increase, and interest on finance and investment still needs to be paid. Furthermore, according to our own estimates and those of interviewed stakeholders, significant investment (around £1.2-1.3M per MW) will need to remain ring-fenced for the construction of the wind farm. At the same time the revenue stream to pay for this investment and generate profit is delayed.
It became apparent through discussing these aspects with developers that the delays in grid connection and planning consent, and subsequent impacts mean that there is now an increased number of projects that are effectively ‘paused’ because they are no longer commercially viable. It is also clear that the main factor causing these delays is a lack of skilled human resources in grid operators and in planning departments (opinion of 64% of all stakeholders interviewed).
© The University of Edinburgh, 2024
Prepared by Optimat and ITPEnergised on behalf of ClimateXChange, The University of Edinburgh. All rights reserved.
While every effort is made to ensure the information in this report is accurate, no legal responsibility is accepted for any errors, omissions or misleading statements. The views expressed represent those of the author(s), and do not necessarily represent those of the host institutions or funders.
Scottish Government, 2023: page 6. ↑
For further detail see Section 5 and Appendices D and E. ↑
FTE refers to the number of hours that a full-time employee works for an organisation. One FTE can therefore be one full-time member of staff or multiple part-time employees. ↑
Appendix B provides further details of a wind farm’s project lifecycle, while Appendix C provides a more detailed description of the qualifications and experience required for different job roles. ↑
Feedback from stakeholder interviews. ↑